Free Statistics

of Irreproducible Research!

Author's title

Author*Unverified author*
R Software Modulerwasp_autocorrelation.wasp
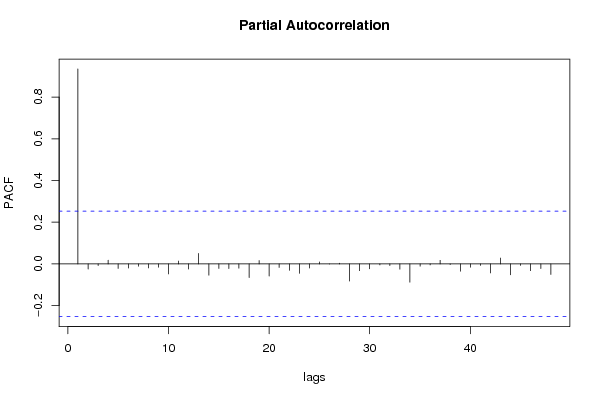
Title produced by software(Partial) Autocorrelation Function
Date of computationFri, 07 Dec 2007 06:14:20 -0700
Cite this page as followsStatistical Computations at FreeStatistics.org, Office for Research Development and Education, URL https://freestatistics.org/blog/index.php?v=date/2007/Dec/07/t1197032462222d94y0i2qoc2h.htm/, Retrieved Sun, 28 Apr 2024 23:09:01 +0000
Statistical Computations at FreeStatistics.org, Office for Research Development and Education, URL https://freestatistics.org/blog/index.php?pk=2807, Retrieved Sun, 28 Apr 2024 23:09:01 +0000
QR Codes:

Original text written by user:
IsPrivate?No (this computation is public)
User-defined keywords
Estimated Impact195
Family? (F = Feedback message, R = changed R code, M = changed R Module, P = changed Parameters, D = changed Data)
-       [(Partial) Autocorrelation Function] [Autocorrelation F...] [2007-12-07 13:14:20] [40a229849a2b804e343854d9b3fa1a24] [Current]
Feedback Forum

Post a new message
Dataseries X:
106.48
106.83
107.14
107.94
108.46
108.81
108.92
108.99
109.16
109.22
109.43
109.23
109.93
110.09
110.33
110.11
110.35
110.09
110.44
110.39
110.62
110.43
110.46
110.55
110.94
111.56
111.82
111.73
111.57
111.85
112.06
112.2
112.47
112.15
112.36
112.32
112.67
113.02
113.05
113.5
113.67
113.65
114
114.03
114.08
114.49
114.48
114.25
114.68
115.28
115.9
115.87
116.09
116.29
116.76
116.78
116.65
116.46
116.82
116.91


Summary of compuational transaction
Raw Inputview raw input (R code)
Raw Outputview raw output of R engine
Computing time3 seconds
R Server'Herman Ole Andreas Wold' @ 193.190.124.10:1001

\begin{tabular}{lllllllll}
\hline
Summary of compuational transaction \tabularnewline
Raw Input & view raw input (R code)  \tabularnewline
Raw Output & view raw output of R engine  \tabularnewline
Computing time & 3 seconds \tabularnewline
R Server & 'Herman Ole Andreas Wold' @ 193.190.124.10:1001 \tabularnewline
\hline
\end{tabular}
%Source: https://freestatistics.org/blog/index.php?pk=2807&T=0

[TABLE]
[ROW][C]Summary of compuational transaction[/C][/ROW]
[ROW][C]Raw Input[/C][C]view raw input (R code) [/C][/ROW]
[ROW][C]Raw Output[/C][C]view raw output of R engine [/C][/ROW]
[ROW][C]Computing time[/C][C]3 seconds[/C][/ROW]
[ROW][C]R Server[/C][C]'Herman Ole Andreas Wold' @ 193.190.124.10:1001[/C][/ROW]
[/TABLE]
Source: https://freestatistics.org/blog/index.php?pk=2807&T=0

Globally Unique Identifier (entire table): ba.freestatistics.org/blog/index.php?pk=2807&T=0

As an alternative you can also use a QR Code:  

The GUIDs for individual cells are displayed in the table below:

Summary of compuational transaction
Raw Inputview raw input (R code)
Raw Outputview raw output of R engine
Computing time3 seconds
R Server'Herman Ole Andreas Wold' @ 193.190.124.10:1001


Autocorrelation Function
Time lag kACF(k)T-STATP-value
017.7460
10.9347357.24040
20.8705886.74350
30.8097256.27210
40.75535.85050
50.70195.43691e-06
60.6496675.03232e-06
70.5996574.64491e-05
80.5509474.26763.6e-05
90.5039723.90370.000121
100.454553.52090.000414
110.410863.18250.001157
120.3677962.84890.003001
130.3349422.59440.005945
140.2980182.30840.012219
150.2615252.02580.023621
160.2252531.74480.04307
170.1902651.47380.072883
180.1507081.16740.123838
190.1169290.90570.184352
200.0800710.62020.268728
210.0450840.34920.364074
220.0107340.08310.467006
23-0.025678-0.19890.578495
24-0.059611-0.46170.677033
25-0.088545-0.68590.75228
26-0.112411-0.87070.806314
27-0.132817-1.02880.846147
28-0.159574-1.23610.889372
29-0.18724-1.45040.923917
30-0.212194-1.64360.94726
31-0.234088-1.81320.962601
32-0.251999-1.9520.972194
33-0.269612-2.08840.979494
34-0.29384-2.27610.986788
35-0.314942-2.43950.99116
36-0.331518-2.56790.99363
37-0.342882-2.6560.994942
38-0.350418-2.71430.995671
39-0.359334-2.78340.996408
40-0.365458-2.83080.996846
41-0.369196-2.85980.997088
42-0.375028-2.9050.997432
43-0.374854-2.90360.997422
44-0.377277-2.92240.997554
45-0.377781-2.92630.997581
46-0.377408-2.92340.997561
47-0.377351-2.92290.997558

\begin{tabular}{lllllllll}
\hline
Autocorrelation Function \tabularnewline
Time lag k & ACF(k) & T-STAT & P-value \tabularnewline
0 & 1 & 7.746 & 0 \tabularnewline
1 & 0.934735 & 7.2404 & 0 \tabularnewline
2 & 0.870588 & 6.7435 & 0 \tabularnewline
3 & 0.809725 & 6.2721 & 0 \tabularnewline
4 & 0.7553 & 5.8505 & 0 \tabularnewline
5 & 0.7019 & 5.4369 & 1e-06 \tabularnewline
6 & 0.649667 & 5.0323 & 2e-06 \tabularnewline
7 & 0.599657 & 4.6449 & 1e-05 \tabularnewline
8 & 0.550947 & 4.2676 & 3.6e-05 \tabularnewline
9 & 0.503972 & 3.9037 & 0.000121 \tabularnewline
10 & 0.45455 & 3.5209 & 0.000414 \tabularnewline
11 & 0.41086 & 3.1825 & 0.001157 \tabularnewline
12 & 0.367796 & 2.8489 & 0.003001 \tabularnewline
13 & 0.334942 & 2.5944 & 0.005945 \tabularnewline
14 & 0.298018 & 2.3084 & 0.012219 \tabularnewline
15 & 0.261525 & 2.0258 & 0.023621 \tabularnewline
16 & 0.225253 & 1.7448 & 0.04307 \tabularnewline
17 & 0.190265 & 1.4738 & 0.072883 \tabularnewline
18 & 0.150708 & 1.1674 & 0.123838 \tabularnewline
19 & 0.116929 & 0.9057 & 0.184352 \tabularnewline
20 & 0.080071 & 0.6202 & 0.268728 \tabularnewline
21 & 0.045084 & 0.3492 & 0.364074 \tabularnewline
22 & 0.010734 & 0.0831 & 0.467006 \tabularnewline
23 & -0.025678 & -0.1989 & 0.578495 \tabularnewline
24 & -0.059611 & -0.4617 & 0.677033 \tabularnewline
25 & -0.088545 & -0.6859 & 0.75228 \tabularnewline
26 & -0.112411 & -0.8707 & 0.806314 \tabularnewline
27 & -0.132817 & -1.0288 & 0.846147 \tabularnewline
28 & -0.159574 & -1.2361 & 0.889372 \tabularnewline
29 & -0.18724 & -1.4504 & 0.923917 \tabularnewline
30 & -0.212194 & -1.6436 & 0.94726 \tabularnewline
31 & -0.234088 & -1.8132 & 0.962601 \tabularnewline
32 & -0.251999 & -1.952 & 0.972194 \tabularnewline
33 & -0.269612 & -2.0884 & 0.979494 \tabularnewline
34 & -0.29384 & -2.2761 & 0.986788 \tabularnewline
35 & -0.314942 & -2.4395 & 0.99116 \tabularnewline
36 & -0.331518 & -2.5679 & 0.99363 \tabularnewline
37 & -0.342882 & -2.656 & 0.994942 \tabularnewline
38 & -0.350418 & -2.7143 & 0.995671 \tabularnewline
39 & -0.359334 & -2.7834 & 0.996408 \tabularnewline
40 & -0.365458 & -2.8308 & 0.996846 \tabularnewline
41 & -0.369196 & -2.8598 & 0.997088 \tabularnewline
42 & -0.375028 & -2.905 & 0.997432 \tabularnewline
43 & -0.374854 & -2.9036 & 0.997422 \tabularnewline
44 & -0.377277 & -2.9224 & 0.997554 \tabularnewline
45 & -0.377781 & -2.9263 & 0.997581 \tabularnewline
46 & -0.377408 & -2.9234 & 0.997561 \tabularnewline
47 & -0.377351 & -2.9229 & 0.997558 \tabularnewline
\hline
\end{tabular}
%Source: https://freestatistics.org/blog/index.php?pk=2807&T=1

[TABLE]
[ROW][C]Autocorrelation Function[/C][/ROW]
[ROW][C]Time lag k[/C][C]ACF(k)[/C][C]T-STAT[/C][C]P-value[/C][/ROW]
[ROW][C]0[/C][C]1[/C][C]7.746[/C][C]0[/C][/ROW]
[ROW][C]1[/C][C]0.934735[/C][C]7.2404[/C][C]0[/C][/ROW]
[ROW][C]2[/C][C]0.870588[/C][C]6.7435[/C][C]0[/C][/ROW]
[ROW][C]3[/C][C]0.809725[/C][C]6.2721[/C][C]0[/C][/ROW]
[ROW][C]4[/C][C]0.7553[/C][C]5.8505[/C][C]0[/C][/ROW]
[ROW][C]5[/C][C]0.7019[/C][C]5.4369[/C][C]1e-06[/C][/ROW]
[ROW][C]6[/C][C]0.649667[/C][C]5.0323[/C][C]2e-06[/C][/ROW]
[ROW][C]7[/C][C]0.599657[/C][C]4.6449[/C][C]1e-05[/C][/ROW]
[ROW][C]8[/C][C]0.550947[/C][C]4.2676[/C][C]3.6e-05[/C][/ROW]
[ROW][C]9[/C][C]0.503972[/C][C]3.9037[/C][C]0.000121[/C][/ROW]
[ROW][C]10[/C][C]0.45455[/C][C]3.5209[/C][C]0.000414[/C][/ROW]
[ROW][C]11[/C][C]0.41086[/C][C]3.1825[/C][C]0.001157[/C][/ROW]
[ROW][C]12[/C][C]0.367796[/C][C]2.8489[/C][C]0.003001[/C][/ROW]
[ROW][C]13[/C][C]0.334942[/C][C]2.5944[/C][C]0.005945[/C][/ROW]
[ROW][C]14[/C][C]0.298018[/C][C]2.3084[/C][C]0.012219[/C][/ROW]
[ROW][C]15[/C][C]0.261525[/C][C]2.0258[/C][C]0.023621[/C][/ROW]
[ROW][C]16[/C][C]0.225253[/C][C]1.7448[/C][C]0.04307[/C][/ROW]
[ROW][C]17[/C][C]0.190265[/C][C]1.4738[/C][C]0.072883[/C][/ROW]
[ROW][C]18[/C][C]0.150708[/C][C]1.1674[/C][C]0.123838[/C][/ROW]
[ROW][C]19[/C][C]0.116929[/C][C]0.9057[/C][C]0.184352[/C][/ROW]
[ROW][C]20[/C][C]0.080071[/C][C]0.6202[/C][C]0.268728[/C][/ROW]
[ROW][C]21[/C][C]0.045084[/C][C]0.3492[/C][C]0.364074[/C][/ROW]
[ROW][C]22[/C][C]0.010734[/C][C]0.0831[/C][C]0.467006[/C][/ROW]
[ROW][C]23[/C][C]-0.025678[/C][C]-0.1989[/C][C]0.578495[/C][/ROW]
[ROW][C]24[/C][C]-0.059611[/C][C]-0.4617[/C][C]0.677033[/C][/ROW]
[ROW][C]25[/C][C]-0.088545[/C][C]-0.6859[/C][C]0.75228[/C][/ROW]
[ROW][C]26[/C][C]-0.112411[/C][C]-0.8707[/C][C]0.806314[/C][/ROW]
[ROW][C]27[/C][C]-0.132817[/C][C]-1.0288[/C][C]0.846147[/C][/ROW]
[ROW][C]28[/C][C]-0.159574[/C][C]-1.2361[/C][C]0.889372[/C][/ROW]
[ROW][C]29[/C][C]-0.18724[/C][C]-1.4504[/C][C]0.923917[/C][/ROW]
[ROW][C]30[/C][C]-0.212194[/C][C]-1.6436[/C][C]0.94726[/C][/ROW]
[ROW][C]31[/C][C]-0.234088[/C][C]-1.8132[/C][C]0.962601[/C][/ROW]
[ROW][C]32[/C][C]-0.251999[/C][C]-1.952[/C][C]0.972194[/C][/ROW]
[ROW][C]33[/C][C]-0.269612[/C][C]-2.0884[/C][C]0.979494[/C][/ROW]
[ROW][C]34[/C][C]-0.29384[/C][C]-2.2761[/C][C]0.986788[/C][/ROW]
[ROW][C]35[/C][C]-0.314942[/C][C]-2.4395[/C][C]0.99116[/C][/ROW]
[ROW][C]36[/C][C]-0.331518[/C][C]-2.5679[/C][C]0.99363[/C][/ROW]
[ROW][C]37[/C][C]-0.342882[/C][C]-2.656[/C][C]0.994942[/C][/ROW]
[ROW][C]38[/C][C]-0.350418[/C][C]-2.7143[/C][C]0.995671[/C][/ROW]
[ROW][C]39[/C][C]-0.359334[/C][C]-2.7834[/C][C]0.996408[/C][/ROW]
[ROW][C]40[/C][C]-0.365458[/C][C]-2.8308[/C][C]0.996846[/C][/ROW]
[ROW][C]41[/C][C]-0.369196[/C][C]-2.8598[/C][C]0.997088[/C][/ROW]
[ROW][C]42[/C][C]-0.375028[/C][C]-2.905[/C][C]0.997432[/C][/ROW]
[ROW][C]43[/C][C]-0.374854[/C][C]-2.9036[/C][C]0.997422[/C][/ROW]
[ROW][C]44[/C][C]-0.377277[/C][C]-2.9224[/C][C]0.997554[/C][/ROW]
[ROW][C]45[/C][C]-0.377781[/C][C]-2.9263[/C][C]0.997581[/C][/ROW]
[ROW][C]46[/C][C]-0.377408[/C][C]-2.9234[/C][C]0.997561[/C][/ROW]
[ROW][C]47[/C][C]-0.377351[/C][C]-2.9229[/C][C]0.997558[/C][/ROW]
[/TABLE]
Source: https://freestatistics.org/blog/index.php?pk=2807&T=1

Globally Unique Identifier (entire table): ba.freestatistics.org/blog/index.php?pk=2807&T=1

As an alternative you can also use a QR Code:  

The GUIDs for individual cells are displayed in the table below:

Autocorrelation Function
Time lag kACF(k)T-STATP-value
017.7460
10.9347357.24040
20.8705886.74350
30.8097256.27210
40.75535.85050
50.70195.43691e-06
60.6496675.03232e-06
70.5996574.64491e-05
80.5509474.26763.6e-05
90.5039723.90370.000121
100.454553.52090.000414
110.410863.18250.001157
120.3677962.84890.003001
130.3349422.59440.005945
140.2980182.30840.012219
150.2615252.02580.023621
160.2252531.74480.04307
170.1902651.47380.072883
180.1507081.16740.123838
190.1169290.90570.184352
200.0800710.62020.268728
210.0450840.34920.364074
220.0107340.08310.467006
23-0.025678-0.19890.578495
24-0.059611-0.46170.677033
25-0.088545-0.68590.75228
26-0.112411-0.87070.806314
27-0.132817-1.02880.846147
28-0.159574-1.23610.889372
29-0.18724-1.45040.923917
30-0.212194-1.64360.94726
31-0.234088-1.81320.962601
32-0.251999-1.9520.972194
33-0.269612-2.08840.979494
34-0.29384-2.27610.986788
35-0.314942-2.43950.99116
36-0.331518-2.56790.99363
37-0.342882-2.6560.994942
38-0.350418-2.71430.995671
39-0.359334-2.78340.996408
40-0.365458-2.83080.996846
41-0.369196-2.85980.997088
42-0.375028-2.9050.997432
43-0.374854-2.90360.997422
44-0.377277-2.92240.997554
45-0.377781-2.92630.997581
46-0.377408-2.92340.997561
47-0.377351-2.92290.997558


Partial Autocorrelation Function
Time lag kPACF(k)T-STATP-value
00.9347357.24040
1-0.024873-0.19270.576064
2-0.008203-0.06350.525227
30.0177660.13760.445503
4-0.021721-0.16820.566523
5-0.019817-0.15350.560742
6-0.011267-0.08730.534627
7-0.019665-0.15230.560279
8-0.015906-0.12320.548822
9-0.048472-0.37550.64568
100.0133660.10350.458942
11-0.02511-0.19450.576779
120.0501920.38880.349405
13-0.053959-0.4180.661268
14-0.021589-0.16720.566124
15-0.022172-0.17170.567891
16-0.020479-0.15860.562753
17-0.065556-0.50780.69327
180.0160340.12420.450788
19-0.05858-0.45380.67418
20-0.017346-0.13440.553218
21-0.030856-0.2390.594044
22-0.045266-0.35060.636454
23-0.019975-0.15470.561223
240.0096290.07460.470397
25-6e-04-0.00460.501846
260.0034480.02670.489389
27-0.082317-0.63760.736929
28-0.032919-0.2550.600199
29-0.023782-0.18420.572766
30-0.005023-0.03890.515453
31-0.008304-0.06430.525537
32-0.025546-0.19790.578097
33-0.087998-0.68160.750953
34-0.011252-0.08720.534581
35-0.004852-0.03760.514927
360.017420.13490.446558
37-0.003291-0.02550.510128
38-0.034851-0.270.605938
39-0.015943-0.12350.548936
40-0.0077-0.05960.523681
41-0.043728-0.33870.631997
420.0276790.21440.415481
43-0.052378-0.40570.656804
44-0.00767-0.05940.523588
45-0.032602-0.25250.599255
46-0.022207-0.1720.567996
47-0.050705-0.39280.652056

\begin{tabular}{lllllllll}
\hline
Partial Autocorrelation Function \tabularnewline
Time lag k & PACF(k) & T-STAT & P-value \tabularnewline
0 & 0.934735 & 7.2404 & 0 \tabularnewline
1 & -0.024873 & -0.1927 & 0.576064 \tabularnewline
2 & -0.008203 & -0.0635 & 0.525227 \tabularnewline
3 & 0.017766 & 0.1376 & 0.445503 \tabularnewline
4 & -0.021721 & -0.1682 & 0.566523 \tabularnewline
5 & -0.019817 & -0.1535 & 0.560742 \tabularnewline
6 & -0.011267 & -0.0873 & 0.534627 \tabularnewline
7 & -0.019665 & -0.1523 & 0.560279 \tabularnewline
8 & -0.015906 & -0.1232 & 0.548822 \tabularnewline
9 & -0.048472 & -0.3755 & 0.64568 \tabularnewline
10 & 0.013366 & 0.1035 & 0.458942 \tabularnewline
11 & -0.02511 & -0.1945 & 0.576779 \tabularnewline
12 & 0.050192 & 0.3888 & 0.349405 \tabularnewline
13 & -0.053959 & -0.418 & 0.661268 \tabularnewline
14 & -0.021589 & -0.1672 & 0.566124 \tabularnewline
15 & -0.022172 & -0.1717 & 0.567891 \tabularnewline
16 & -0.020479 & -0.1586 & 0.562753 \tabularnewline
17 & -0.065556 & -0.5078 & 0.69327 \tabularnewline
18 & 0.016034 & 0.1242 & 0.450788 \tabularnewline
19 & -0.05858 & -0.4538 & 0.67418 \tabularnewline
20 & -0.017346 & -0.1344 & 0.553218 \tabularnewline
21 & -0.030856 & -0.239 & 0.594044 \tabularnewline
22 & -0.045266 & -0.3506 & 0.636454 \tabularnewline
23 & -0.019975 & -0.1547 & 0.561223 \tabularnewline
24 & 0.009629 & 0.0746 & 0.470397 \tabularnewline
25 & -6e-04 & -0.0046 & 0.501846 \tabularnewline
26 & 0.003448 & 0.0267 & 0.489389 \tabularnewline
27 & -0.082317 & -0.6376 & 0.736929 \tabularnewline
28 & -0.032919 & -0.255 & 0.600199 \tabularnewline
29 & -0.023782 & -0.1842 & 0.572766 \tabularnewline
30 & -0.005023 & -0.0389 & 0.515453 \tabularnewline
31 & -0.008304 & -0.0643 & 0.525537 \tabularnewline
32 & -0.025546 & -0.1979 & 0.578097 \tabularnewline
33 & -0.087998 & -0.6816 & 0.750953 \tabularnewline
34 & -0.011252 & -0.0872 & 0.534581 \tabularnewline
35 & -0.004852 & -0.0376 & 0.514927 \tabularnewline
36 & 0.01742 & 0.1349 & 0.446558 \tabularnewline
37 & -0.003291 & -0.0255 & 0.510128 \tabularnewline
38 & -0.034851 & -0.27 & 0.605938 \tabularnewline
39 & -0.015943 & -0.1235 & 0.548936 \tabularnewline
40 & -0.0077 & -0.0596 & 0.523681 \tabularnewline
41 & -0.043728 & -0.3387 & 0.631997 \tabularnewline
42 & 0.027679 & 0.2144 & 0.415481 \tabularnewline
43 & -0.052378 & -0.4057 & 0.656804 \tabularnewline
44 & -0.00767 & -0.0594 & 0.523588 \tabularnewline
45 & -0.032602 & -0.2525 & 0.599255 \tabularnewline
46 & -0.022207 & -0.172 & 0.567996 \tabularnewline
47 & -0.050705 & -0.3928 & 0.652056 \tabularnewline
\hline
\end{tabular}
%Source: https://freestatistics.org/blog/index.php?pk=2807&T=2

[TABLE]
[ROW][C]Partial Autocorrelation Function[/C][/ROW]
[ROW][C]Time lag k[/C][C]PACF(k)[/C][C]T-STAT[/C][C]P-value[/C][/ROW]
[ROW][C]0[/C][C]0.934735[/C][C]7.2404[/C][C]0[/C][/ROW]
[ROW][C]1[/C][C]-0.024873[/C][C]-0.1927[/C][C]0.576064[/C][/ROW]
[ROW][C]2[/C][C]-0.008203[/C][C]-0.0635[/C][C]0.525227[/C][/ROW]
[ROW][C]3[/C][C]0.017766[/C][C]0.1376[/C][C]0.445503[/C][/ROW]
[ROW][C]4[/C][C]-0.021721[/C][C]-0.1682[/C][C]0.566523[/C][/ROW]
[ROW][C]5[/C][C]-0.019817[/C][C]-0.1535[/C][C]0.560742[/C][/ROW]
[ROW][C]6[/C][C]-0.011267[/C][C]-0.0873[/C][C]0.534627[/C][/ROW]
[ROW][C]7[/C][C]-0.019665[/C][C]-0.1523[/C][C]0.560279[/C][/ROW]
[ROW][C]8[/C][C]-0.015906[/C][C]-0.1232[/C][C]0.548822[/C][/ROW]
[ROW][C]9[/C][C]-0.048472[/C][C]-0.3755[/C][C]0.64568[/C][/ROW]
[ROW][C]10[/C][C]0.013366[/C][C]0.1035[/C][C]0.458942[/C][/ROW]
[ROW][C]11[/C][C]-0.02511[/C][C]-0.1945[/C][C]0.576779[/C][/ROW]
[ROW][C]12[/C][C]0.050192[/C][C]0.3888[/C][C]0.349405[/C][/ROW]
[ROW][C]13[/C][C]-0.053959[/C][C]-0.418[/C][C]0.661268[/C][/ROW]
[ROW][C]14[/C][C]-0.021589[/C][C]-0.1672[/C][C]0.566124[/C][/ROW]
[ROW][C]15[/C][C]-0.022172[/C][C]-0.1717[/C][C]0.567891[/C][/ROW]
[ROW][C]16[/C][C]-0.020479[/C][C]-0.1586[/C][C]0.562753[/C][/ROW]
[ROW][C]17[/C][C]-0.065556[/C][C]-0.5078[/C][C]0.69327[/C][/ROW]
[ROW][C]18[/C][C]0.016034[/C][C]0.1242[/C][C]0.450788[/C][/ROW]
[ROW][C]19[/C][C]-0.05858[/C][C]-0.4538[/C][C]0.67418[/C][/ROW]
[ROW][C]20[/C][C]-0.017346[/C][C]-0.1344[/C][C]0.553218[/C][/ROW]
[ROW][C]21[/C][C]-0.030856[/C][C]-0.239[/C][C]0.594044[/C][/ROW]
[ROW][C]22[/C][C]-0.045266[/C][C]-0.3506[/C][C]0.636454[/C][/ROW]
[ROW][C]23[/C][C]-0.019975[/C][C]-0.1547[/C][C]0.561223[/C][/ROW]
[ROW][C]24[/C][C]0.009629[/C][C]0.0746[/C][C]0.470397[/C][/ROW]
[ROW][C]25[/C][C]-6e-04[/C][C]-0.0046[/C][C]0.501846[/C][/ROW]
[ROW][C]26[/C][C]0.003448[/C][C]0.0267[/C][C]0.489389[/C][/ROW]
[ROW][C]27[/C][C]-0.082317[/C][C]-0.6376[/C][C]0.736929[/C][/ROW]
[ROW][C]28[/C][C]-0.032919[/C][C]-0.255[/C][C]0.600199[/C][/ROW]
[ROW][C]29[/C][C]-0.023782[/C][C]-0.1842[/C][C]0.572766[/C][/ROW]
[ROW][C]30[/C][C]-0.005023[/C][C]-0.0389[/C][C]0.515453[/C][/ROW]
[ROW][C]31[/C][C]-0.008304[/C][C]-0.0643[/C][C]0.525537[/C][/ROW]
[ROW][C]32[/C][C]-0.025546[/C][C]-0.1979[/C][C]0.578097[/C][/ROW]
[ROW][C]33[/C][C]-0.087998[/C][C]-0.6816[/C][C]0.750953[/C][/ROW]
[ROW][C]34[/C][C]-0.011252[/C][C]-0.0872[/C][C]0.534581[/C][/ROW]
[ROW][C]35[/C][C]-0.004852[/C][C]-0.0376[/C][C]0.514927[/C][/ROW]
[ROW][C]36[/C][C]0.01742[/C][C]0.1349[/C][C]0.446558[/C][/ROW]
[ROW][C]37[/C][C]-0.003291[/C][C]-0.0255[/C][C]0.510128[/C][/ROW]
[ROW][C]38[/C][C]-0.034851[/C][C]-0.27[/C][C]0.605938[/C][/ROW]
[ROW][C]39[/C][C]-0.015943[/C][C]-0.1235[/C][C]0.548936[/C][/ROW]
[ROW][C]40[/C][C]-0.0077[/C][C]-0.0596[/C][C]0.523681[/C][/ROW]
[ROW][C]41[/C][C]-0.043728[/C][C]-0.3387[/C][C]0.631997[/C][/ROW]
[ROW][C]42[/C][C]0.027679[/C][C]0.2144[/C][C]0.415481[/C][/ROW]
[ROW][C]43[/C][C]-0.052378[/C][C]-0.4057[/C][C]0.656804[/C][/ROW]
[ROW][C]44[/C][C]-0.00767[/C][C]-0.0594[/C][C]0.523588[/C][/ROW]
[ROW][C]45[/C][C]-0.032602[/C][C]-0.2525[/C][C]0.599255[/C][/ROW]
[ROW][C]46[/C][C]-0.022207[/C][C]-0.172[/C][C]0.567996[/C][/ROW]
[ROW][C]47[/C][C]-0.050705[/C][C]-0.3928[/C][C]0.652056[/C][/ROW]
[/TABLE]
Source: https://freestatistics.org/blog/index.php?pk=2807&T=2

Globally Unique Identifier (entire table): ba.freestatistics.org/blog/index.php?pk=2807&T=2

As an alternative you can also use a QR Code:  

The GUIDs for individual cells are displayed in the table below:

Partial Autocorrelation Function
Time lag kPACF(k)T-STATP-value
00.9347357.24040
1-0.024873-0.19270.576064
2-0.008203-0.06350.525227
30.0177660.13760.445503
4-0.021721-0.16820.566523
5-0.019817-0.15350.560742
6-0.011267-0.08730.534627
7-0.019665-0.15230.560279
8-0.015906-0.12320.548822
9-0.048472-0.37550.64568
100.0133660.10350.458942
11-0.02511-0.19450.576779
120.0501920.38880.349405
13-0.053959-0.4180.661268
14-0.021589-0.16720.566124
15-0.022172-0.17170.567891
16-0.020479-0.15860.562753
17-0.065556-0.50780.69327
180.0160340.12420.450788
19-0.05858-0.45380.67418
20-0.017346-0.13440.553218
21-0.030856-0.2390.594044
22-0.045266-0.35060.636454
23-0.019975-0.15470.561223
240.0096290.07460.470397
25-6e-04-0.00460.501846
260.0034480.02670.489389
27-0.082317-0.63760.736929
28-0.032919-0.2550.600199
29-0.023782-0.18420.572766
30-0.005023-0.03890.515453
31-0.008304-0.06430.525537
32-0.025546-0.19790.578097
33-0.087998-0.68160.750953
34-0.011252-0.08720.534581
35-0.004852-0.03760.514927
360.017420.13490.446558
37-0.003291-0.02550.510128
38-0.034851-0.270.605938
39-0.015943-0.12350.548936
40-0.0077-0.05960.523681
41-0.043728-0.33870.631997
420.0276790.21440.415481
43-0.052378-0.40570.656804
44-0.00767-0.05940.523588
45-0.032602-0.25250.599255
46-0.022207-0.1720.567996
47-0.050705-0.39280.652056


Parameters (Session):
par1 = 48 ; par2 = 1 ; par3 = 0 ; par4 = 0 ; par5 = 12 ;
Parameters (R input):
par1 = 48 ; par2 = 1 ; par3 = 0 ; par4 = 0 ; par5 = 12 ;
R code (references can be found in the software module):
if (par1 == 'Default') {
par1 = 10*log10(length(x))
} else {
par1 <- as.numeric(par1)
}
par2 <- as.numeric(par2)
par3 <- as.numeric(par3)
par4 <- as.numeric(par4)
par5 <- as.numeric(par5)
if (par2 == 0) {
x <- log(x)
} else {
x <- (x ^ par2 - 1) / par2
}
if (par3 > 0) x <- diff(x,lag=1,difference=par3)
if (par4 > 0) x <- diff(x,lag=par5,difference=par4)
bitmap(file='pic1.png')
racf <- acf(x,par1,main='Autocorrelation',xlab='lags',ylab='ACF')
dev.off()
bitmap(file='pic2.png')
rpacf <- pacf(x,par1,main='Partial Autocorrelation',xlab='lags',ylab='PACF')
dev.off()
(myacf <- c(racf$acf))
(mypacf <- c(rpacf$acf))
lengthx <- length(x)
sqrtn <- sqrt(lengthx)
load(file='createtable')
a<-table.start()
a<-table.row.start(a)
a<-table.element(a,'Autocorrelation Function',4,TRUE)
a<-table.row.end(a)
a<-table.row.start(a)
a<-table.element(a,'Time lag k',header=TRUE)
a<-table.element(a,hyperlink('basics.htm','ACF(k)','click here for more information about the Autocorrelation Function'),header=TRUE)
a<-table.element(a,'T-STAT',header=TRUE)
a<-table.element(a,'P-value',header=TRUE)
a<-table.row.end(a)
for (i in 1:par1) {
a<-table.row.start(a)
a<-table.element(a,i-1,header=TRUE)
a<-table.element(a,round(myacf[i],6))
mytstat <- myacf[i]*sqrtn
a<-table.element(a,round(mytstat,4))
a<-table.element(a,round(1-pt(mytstat,lengthx),6))
a<-table.row.end(a)
}
a<-table.end(a)
table.save(a,file='mytable.tab')
a<-table.start()
a<-table.row.start(a)
a<-table.element(a,'Partial Autocorrelation Function',4,TRUE)
a<-table.row.end(a)
a<-table.row.start(a)
a<-table.element(a,'Time lag k',header=TRUE)
a<-table.element(a,hyperlink('basics.htm','PACF(k)','click here for more information about the Partial Autocorrelation Function'),header=TRUE)
a<-table.element(a,'T-STAT',header=TRUE)
a<-table.element(a,'P-value',header=TRUE)
a<-table.row.end(a)
for (i in 1:par1) {
a<-table.row.start(a)
a<-table.element(a,i-1,header=TRUE)
a<-table.element(a,round(mypacf[i],6))
mytstat <- mypacf[i]*sqrtn
a<-table.element(a,round(mytstat,4))
a<-table.element(a,round(1-pt(mytstat,lengthx),6))
a<-table.row.end(a)
}
a<-table.end(a)
table.save(a,file='mytable1.tab')