Free Statistics

of Irreproducible Research!

Author's title

Cross Correlation functie met stationaire reekst_Investering- en Cosumptieg...

Author*Unverified author*
R Software Modulerwasp_cross.wasp
Title produced by softwareCross Correlation Function
Date of computationFri, 07 Dec 2007 06:00:15 -0700
Cite this page as followsStatistical Computations at FreeStatistics.org, Office for Research Development and Education, URL https://freestatistics.org/blog/index.php?v=date/2007/Dec/07/t1197031628fgbcp1f799kx5js.htm/, Retrieved Mon, 29 Apr 2024 04:46:08 +0000
Statistical Computations at FreeStatistics.org, Office for Research Development and Education, URL https://freestatistics.org/blog/index.php?pk=2799, Retrieved Mon, 29 Apr 2024 04:46:08 +0000
QR Codes:

Original text written by user:
IsPrivate?No (this computation is public)
User-defined keywords
Estimated Impact184
Family? (F = Feedback message, R = changed R code, M = changed R Module, P = changed Parameters, D = changed Data)
-       [Cross Correlation Function] [Cross Correlation...] [2007-12-07 13:00:15] [ca5e0f9f346e091f4d0fe7e17f7dba21] [Current]
Feedback Forum

Post a new message
Dataseries X:
101.5
126.6
93.9
89.8
93.4
101.5
110.4
105.9
108.4
113.9
86.1
69.4
101.2
100.5
98
106.6
90.1
96.9
125.9
112
100
123.9
79.8
83.4
113.6
112.9
104
109.9
99
106.3
128.9
111.1
102.9
130
87
87.5
117.6
103.4
110.8
112.6
102.5
112.4
135.6
105.1
127.7
137
91
90.5
122.4
123.3
124.3
120
118.1
119
142.7
123.6
129.6
146.9
108.7
99.4
Dataseries Y:
108.4
117
103.8
100.8
110.6
104
112.6
107.3
98.9
109.8
104.9
102.2
123.9
124.9
112.7
121.9
100.6
104.3
120.4
107.5
102.9
125.6
107.5
108.8
128.4
121.1
119.5
128.7
108.7
105.5
119.8
111.3
110.6
120.1
97.5
107.7
127.3
117.2
119.8
116.2
111
112.4
130.6
109.1
118.8
123.9
101.6
112.8
128
129.6
125.8
119.5
115.7
113.6
129.7
112
116.8
126.3
112.9
115.9


Summary of compuational transaction
Raw Inputview raw input (R code)
Raw Outputview raw output of R engine
Computing time2 seconds
R Server'Herman Ole Andreas Wold' @ 193.190.124.10:1001

\begin{tabular}{lllllllll}
\hline
Summary of compuational transaction \tabularnewline
Raw Input & view raw input (R code)  \tabularnewline
Raw Output & view raw output of R engine  \tabularnewline
Computing time & 2 seconds \tabularnewline
R Server & 'Herman Ole Andreas Wold' @ 193.190.124.10:1001 \tabularnewline
\hline
\end{tabular}
%Source: https://freestatistics.org/blog/index.php?pk=2799&T=0

[TABLE]
[ROW][C]Summary of compuational transaction[/C][/ROW]
[ROW][C]Raw Input[/C][C]view raw input (R code) [/C][/ROW]
[ROW][C]Raw Output[/C][C]view raw output of R engine [/C][/ROW]
[ROW][C]Computing time[/C][C]2 seconds[/C][/ROW]
[ROW][C]R Server[/C][C]'Herman Ole Andreas Wold' @ 193.190.124.10:1001[/C][/ROW]
[/TABLE]
Source: https://freestatistics.org/blog/index.php?pk=2799&T=0

Globally Unique Identifier (entire table): ba.freestatistics.org/blog/index.php?pk=2799&T=0

As an alternative you can also use a QR Code:  

The GUIDs for individual cells are displayed in the table below:

Summary of compuational transaction
Raw Inputview raw input (R code)
Raw Outputview raw output of R engine
Computing time2 seconds
R Server'Herman Ole Andreas Wold' @ 193.190.124.10:1001


Cross Correlation Function
ParameterValue
Box-Cox transformation parameter (lambda) of X series2
Degree of non-seasonal differencing (d) of X series0
Degree of seasonal differencing (D) of X series1
Seasonal Period (s)12
Box-Cox transformation parameter (lambda) of Y series-2
Degree of non-seasonal differencing (d) of Y series0
Degree of seasonal differencing (D) of Y series1
krho(Y[t],X[t+k])
-130.0810938038380115
-120.304232705725053
-11-0.202469291527186
-100.152707971710018
-9-0.0677105051896198
-8-0.290809437445196
-70.159058463215349
-6-0.0402946866187471
-5-0.260061115517287
-40.114837890726032
-3-0.114829759088935
-2-0.287577094351474
-10.0296554210263577
0-0.448224006656535
1-0.123475461478978
20.227733401252619
3-0.191722670893751
40.0009977148594156
50.147286062714674
6-0.139535248728912
70.0402881963146388
80.0786808156153546
9-0.166581678382475
100.099152486365756
110.127626376187594
12-0.156416802054561
130.0602813675749309

\begin{tabular}{lllllllll}
\hline
Cross Correlation Function \tabularnewline
Parameter & Value \tabularnewline
Box-Cox transformation parameter (lambda) of X series & 2 \tabularnewline
Degree of non-seasonal differencing (d) of X series & 0 \tabularnewline
Degree of seasonal differencing (D) of X series & 1 \tabularnewline
Seasonal Period (s) & 12 \tabularnewline
Box-Cox transformation parameter (lambda) of Y series & -2 \tabularnewline
Degree of non-seasonal differencing (d) of Y series & 0 \tabularnewline
Degree of seasonal differencing (D) of Y series & 1 \tabularnewline
k & rho(Y[t],X[t+k]) \tabularnewline
-13 & 0.0810938038380115 \tabularnewline
-12 & 0.304232705725053 \tabularnewline
-11 & -0.202469291527186 \tabularnewline
-10 & 0.152707971710018 \tabularnewline
-9 & -0.0677105051896198 \tabularnewline
-8 & -0.290809437445196 \tabularnewline
-7 & 0.159058463215349 \tabularnewline
-6 & -0.0402946866187471 \tabularnewline
-5 & -0.260061115517287 \tabularnewline
-4 & 0.114837890726032 \tabularnewline
-3 & -0.114829759088935 \tabularnewline
-2 & -0.287577094351474 \tabularnewline
-1 & 0.0296554210263577 \tabularnewline
0 & -0.448224006656535 \tabularnewline
1 & -0.123475461478978 \tabularnewline
2 & 0.227733401252619 \tabularnewline
3 & -0.191722670893751 \tabularnewline
4 & 0.0009977148594156 \tabularnewline
5 & 0.147286062714674 \tabularnewline
6 & -0.139535248728912 \tabularnewline
7 & 0.0402881963146388 \tabularnewline
8 & 0.0786808156153546 \tabularnewline
9 & -0.166581678382475 \tabularnewline
10 & 0.099152486365756 \tabularnewline
11 & 0.127626376187594 \tabularnewline
12 & -0.156416802054561 \tabularnewline
13 & 0.0602813675749309 \tabularnewline
\hline
\end{tabular}
%Source: https://freestatistics.org/blog/index.php?pk=2799&T=1

[TABLE]
[ROW][C]Cross Correlation Function[/C][/ROW]
[ROW][C]Parameter[/C][C]Value[/C][/ROW]
[ROW][C]Box-Cox transformation parameter (lambda) of X series[/C][C]2[/C][/ROW]
[ROW][C]Degree of non-seasonal differencing (d) of X series[/C][C]0[/C][/ROW]
[ROW][C]Degree of seasonal differencing (D) of X series[/C][C]1[/C][/ROW]
[ROW][C]Seasonal Period (s)[/C][C]12[/C][/ROW]
[ROW][C]Box-Cox transformation parameter (lambda) of Y series[/C][C]-2[/C][/ROW]
[ROW][C]Degree of non-seasonal differencing (d) of Y series[/C][C]0[/C][/ROW]
[ROW][C]Degree of seasonal differencing (D) of Y series[/C][C]1[/C][/ROW]
[ROW][C]k[/C][C]rho(Y[t],X[t+k])[/C][/ROW]
[ROW][C]-13[/C][C]0.0810938038380115[/C][/ROW]
[ROW][C]-12[/C][C]0.304232705725053[/C][/ROW]
[ROW][C]-11[/C][C]-0.202469291527186[/C][/ROW]
[ROW][C]-10[/C][C]0.152707971710018[/C][/ROW]
[ROW][C]-9[/C][C]-0.0677105051896198[/C][/ROW]
[ROW][C]-8[/C][C]-0.290809437445196[/C][/ROW]
[ROW][C]-7[/C][C]0.159058463215349[/C][/ROW]
[ROW][C]-6[/C][C]-0.0402946866187471[/C][/ROW]
[ROW][C]-5[/C][C]-0.260061115517287[/C][/ROW]
[ROW][C]-4[/C][C]0.114837890726032[/C][/ROW]
[ROW][C]-3[/C][C]-0.114829759088935[/C][/ROW]
[ROW][C]-2[/C][C]-0.287577094351474[/C][/ROW]
[ROW][C]-1[/C][C]0.0296554210263577[/C][/ROW]
[ROW][C]0[/C][C]-0.448224006656535[/C][/ROW]
[ROW][C]1[/C][C]-0.123475461478978[/C][/ROW]
[ROW][C]2[/C][C]0.227733401252619[/C][/ROW]
[ROW][C]3[/C][C]-0.191722670893751[/C][/ROW]
[ROW][C]4[/C][C]0.0009977148594156[/C][/ROW]
[ROW][C]5[/C][C]0.147286062714674[/C][/ROW]
[ROW][C]6[/C][C]-0.139535248728912[/C][/ROW]
[ROW][C]7[/C][C]0.0402881963146388[/C][/ROW]
[ROW][C]8[/C][C]0.0786808156153546[/C][/ROW]
[ROW][C]9[/C][C]-0.166581678382475[/C][/ROW]
[ROW][C]10[/C][C]0.099152486365756[/C][/ROW]
[ROW][C]11[/C][C]0.127626376187594[/C][/ROW]
[ROW][C]12[/C][C]-0.156416802054561[/C][/ROW]
[ROW][C]13[/C][C]0.0602813675749309[/C][/ROW]
[/TABLE]
Source: https://freestatistics.org/blog/index.php?pk=2799&T=1

Globally Unique Identifier (entire table): ba.freestatistics.org/blog/index.php?pk=2799&T=1

As an alternative you can also use a QR Code:  

The GUIDs for individual cells are displayed in the table below:

Cross Correlation Function
ParameterValue
Box-Cox transformation parameter (lambda) of X series2
Degree of non-seasonal differencing (d) of X series0
Degree of seasonal differencing (D) of X series1
Seasonal Period (s)12
Box-Cox transformation parameter (lambda) of Y series-2
Degree of non-seasonal differencing (d) of Y series0
Degree of seasonal differencing (D) of Y series1
krho(Y[t],X[t+k])
-130.0810938038380115
-120.304232705725053
-11-0.202469291527186
-100.152707971710018
-9-0.0677105051896198
-8-0.290809437445196
-70.159058463215349
-6-0.0402946866187471
-5-0.260061115517287
-40.114837890726032
-3-0.114829759088935
-2-0.287577094351474
-10.0296554210263577
0-0.448224006656535
1-0.123475461478978
20.227733401252619
3-0.191722670893751
40.0009977148594156
50.147286062714674
6-0.139535248728912
70.0402881963146388
80.0786808156153546
9-0.166581678382475
100.099152486365756
110.127626376187594
12-0.156416802054561
130.0602813675749309


Parameters (Session):
par1 = 2.0 ; par2 = 0 ; par3 = 1 ; par4 = 12 ; par5 = -2.0 ; par6 = 0 ; par7 = 1 ;
Parameters (R input):
par1 = 2.0 ; par2 = 0 ; par3 = 1 ; par4 = 12 ; par5 = -2.0 ; par6 = 0 ; par7 = 1 ;
R code (references can be found in the software module):
par1 <- as.numeric(par1)
par2 <- as.numeric(par2)
par3 <- as.numeric(par3)
par4 <- as.numeric(par4)
par5 <- as.numeric(par5)
par6 <- as.numeric(par6)
par7 <- as.numeric(par7)
if (par1 == 0) {
x <- log(x)
} else {
x <- (x ^ par1 - 1) / par1
}
if (par5 == 0) {
y <- log(y)
} else {
y <- (y ^ par5 - 1) / par5
}
if (par2 > 0) x <- diff(x,lag=1,difference=par2)
if (par6 > 0) y <- diff(y,lag=1,difference=par6)
if (par3 > 0) x <- diff(x,lag=par4,difference=par3)
if (par7 > 0) x <- diff(y,lag=par4,difference=par7)
x
y
bitmap(file='test1.png')
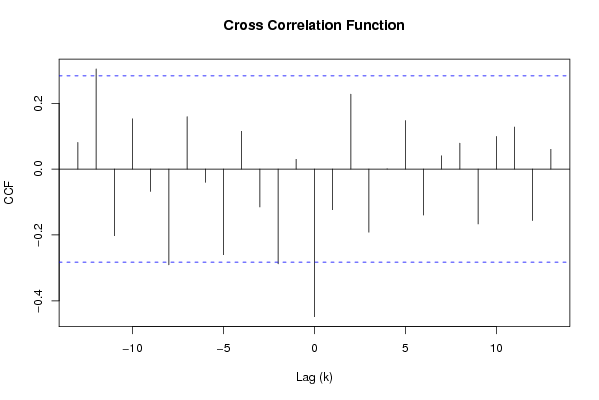
(r <- ccf(x,y,main='Cross Correlation Function',ylab='CCF',xlab='Lag (k)'))
dev.off()
load(file='createtable')
a<-table.start()
a<-table.row.start(a)
a<-table.element(a,'Cross Correlation Function',2,TRUE)
a<-table.row.end(a)
a<-table.row.start(a)
a<-table.element(a,'Parameter',header=TRUE)
a<-table.element(a,'Value',header=TRUE)
a<-table.row.end(a)
a<-table.row.start(a)
a<-table.element(a,'Box-Cox transformation parameter (lambda) of X series',header=TRUE)
a<-table.element(a,par1)
a<-table.row.end(a)
a<-table.row.start(a)
a<-table.element(a,'Degree of non-seasonal differencing (d) of X series',header=TRUE)
a<-table.element(a,par2)
a<-table.row.end(a)
a<-table.row.start(a)
a<-table.element(a,'Degree of seasonal differencing (D) of X series',header=TRUE)
a<-table.element(a,par3)
a<-table.row.end(a)
a<-table.row.start(a)
a<-table.element(a,'Seasonal Period (s)',header=TRUE)
a<-table.element(a,par4)
a<-table.row.end(a)
a<-table.row.start(a)
a<-table.element(a,'Box-Cox transformation parameter (lambda) of Y series',header=TRUE)
a<-table.element(a,par5)
a<-table.row.end(a)
a<-table.row.start(a)
a<-table.element(a,'Degree of non-seasonal differencing (d) of Y series',header=TRUE)
a<-table.element(a,par6)
a<-table.row.end(a)
a<-table.row.start(a)
a<-table.element(a,'Degree of seasonal differencing (D) of Y series',header=TRUE)
a<-table.element(a,par7)
a<-table.row.end(a)
a<-table.row.start(a)
a<-table.element(a,'k',header=TRUE)
a<-table.element(a,'rho(Y[t],X[t+k])',header=TRUE)
a<-table.row.end(a)
mylength <- length(r$acf)
myhalf <- floor((mylength-1)/2)
for (i in 1:mylength) {
a<-table.row.start(a)
a<-table.element(a,i-myhalf-1,header=TRUE)
a<-table.element(a,r$acf[i])
a<-table.row.end(a)
}
a<-table.end(a)
table.save(a,file='mytable.tab')