Free Statistics

of Irreproducible Research!

Author's title

Author*Unverified author*
R Software Modulerwasp_autocorrelation.wasp
Title produced by software(Partial) Autocorrelation Function
Date of computationFri, 07 Dec 2007 05:52:38 -0700
Cite this page as followsStatistical Computations at FreeStatistics.org, Office for Research Development and Education, URL https://freestatistics.org/blog/index.php?v=date/2007/Dec/07/t11970311883m9upweg59kdz14.htm/, Retrieved Mon, 29 Apr 2024 04:06:12 +0000
Statistical Computations at FreeStatistics.org, Office for Research Development and Education, URL https://freestatistics.org/blog/index.php?pk=2791, Retrieved Mon, 29 Apr 2024 04:06:12 +0000
QR Codes:

Original text written by user:
IsPrivate?No (this computation is public)
User-defined keywords
Estimated Impact185
Family? (F = Feedback message, R = changed R code, M = changed R Module, P = changed Parameters, D = changed Data)
-       [(Partial) Autocorrelation Function] [wisselkoers autoc...] [2007-12-07 12:52:38] [e24e91da8d334fb8882bf413603fde71] [Current]
Feedback Forum

Post a new message
Dataseries X:
1.0014
1.0183
1.0622
1.0773
1.0807
1.0848
1.1582
1.1663
1.1372
1.1139
1.1222
1.1692
1.1702
1.2286
1.2613
1.2646
1.2262
1.1985
1.2007
1.2138
1.2266
1.2176
1.2218
1.249
1.2991
1.3408
1.3119
1.3014
1.3201
1.2938
1.2694
1.2165
1.2037
1.2292
1.2256
1.2015
1.1786
1.1856
1.2103
1.1938
1.202
1.2271
1.277
1.265
1.2684
1.2811
1.2727
1.2611
1.2881
1.3213
1.2999
1.3074
1.3242
1.3516
1.3511
1.3419
1.3716
1.3622
1.3896
1.4227


Summary of compuational transaction
Raw Inputview raw input (R code)
Raw Outputview raw output of R engine
Computing time2 seconds
R Server'Gwilym Jenkins' @ 72.249.127.135

\begin{tabular}{lllllllll}
\hline
Summary of compuational transaction \tabularnewline
Raw Input & view raw input (R code)  \tabularnewline
Raw Output & view raw output of R engine  \tabularnewline
Computing time & 2 seconds \tabularnewline
R Server & 'Gwilym Jenkins' @ 72.249.127.135 \tabularnewline
\hline
\end{tabular}
%Source: https://freestatistics.org/blog/index.php?pk=2791&T=0

[TABLE]
[ROW][C]Summary of compuational transaction[/C][/ROW]
[ROW][C]Raw Input[/C][C]view raw input (R code) [/C][/ROW]
[ROW][C]Raw Output[/C][C]view raw output of R engine [/C][/ROW]
[ROW][C]Computing time[/C][C]2 seconds[/C][/ROW]
[ROW][C]R Server[/C][C]'Gwilym Jenkins' @ 72.249.127.135[/C][/ROW]
[/TABLE]
Source: https://freestatistics.org/blog/index.php?pk=2791&T=0

Globally Unique Identifier (entire table): ba.freestatistics.org/blog/index.php?pk=2791&T=0

As an alternative you can also use a QR Code:  

The GUIDs for individual cells are displayed in the table below:

Summary of compuational transaction
Raw Inputview raw input (R code)
Raw Outputview raw output of R engine
Computing time2 seconds
R Server'Gwilym Jenkins' @ 72.249.127.135


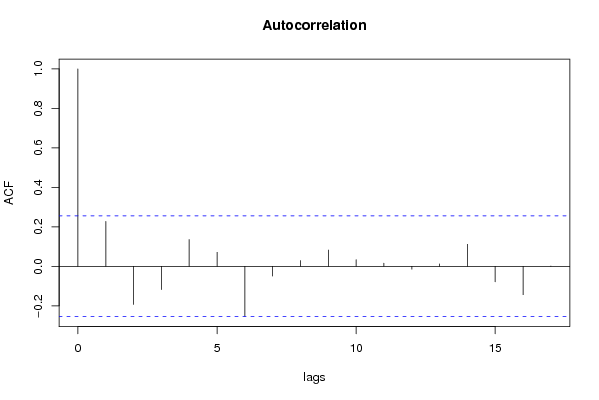
Autocorrelation Function
Time lag kACF(k)T-STATP-value
017.68110
10.2273151.7460.043005
2-0.193427-1.48570.928664
3-0.118167-0.90770.816124
40.1352531.03890.151546
50.0709450.54490.293924
6-0.253376-1.94620.971802
7-0.049308-0.37870.646882
80.0290880.22340.411987
90.0822410.63170.26501
100.0331950.2550.399815
110.0154980.1190.452824
12-0.014481-0.11120.544094
130.011840.09090.463923
140.1112430.85450.198149
15-0.078359-0.60190.725223
16-0.143999-1.10610.863409

\begin{tabular}{lllllllll}
\hline
Autocorrelation Function \tabularnewline
Time lag k & ACF(k) & T-STAT & P-value \tabularnewline
0 & 1 & 7.6811 & 0 \tabularnewline
1 & 0.227315 & 1.746 & 0.043005 \tabularnewline
2 & -0.193427 & -1.4857 & 0.928664 \tabularnewline
3 & -0.118167 & -0.9077 & 0.816124 \tabularnewline
4 & 0.135253 & 1.0389 & 0.151546 \tabularnewline
5 & 0.070945 & 0.5449 & 0.293924 \tabularnewline
6 & -0.253376 & -1.9462 & 0.971802 \tabularnewline
7 & -0.049308 & -0.3787 & 0.646882 \tabularnewline
8 & 0.029088 & 0.2234 & 0.411987 \tabularnewline
9 & 0.082241 & 0.6317 & 0.26501 \tabularnewline
10 & 0.033195 & 0.255 & 0.399815 \tabularnewline
11 & 0.015498 & 0.119 & 0.452824 \tabularnewline
12 & -0.014481 & -0.1112 & 0.544094 \tabularnewline
13 & 0.01184 & 0.0909 & 0.463923 \tabularnewline
14 & 0.111243 & 0.8545 & 0.198149 \tabularnewline
15 & -0.078359 & -0.6019 & 0.725223 \tabularnewline
16 & -0.143999 & -1.1061 & 0.863409 \tabularnewline
\hline
\end{tabular}
%Source: https://freestatistics.org/blog/index.php?pk=2791&T=1

[TABLE]
[ROW][C]Autocorrelation Function[/C][/ROW]
[ROW][C]Time lag k[/C][C]ACF(k)[/C][C]T-STAT[/C][C]P-value[/C][/ROW]
[ROW][C]0[/C][C]1[/C][C]7.6811[/C][C]0[/C][/ROW]
[ROW][C]1[/C][C]0.227315[/C][C]1.746[/C][C]0.043005[/C][/ROW]
[ROW][C]2[/C][C]-0.193427[/C][C]-1.4857[/C][C]0.928664[/C][/ROW]
[ROW][C]3[/C][C]-0.118167[/C][C]-0.9077[/C][C]0.816124[/C][/ROW]
[ROW][C]4[/C][C]0.135253[/C][C]1.0389[/C][C]0.151546[/C][/ROW]
[ROW][C]5[/C][C]0.070945[/C][C]0.5449[/C][C]0.293924[/C][/ROW]
[ROW][C]6[/C][C]-0.253376[/C][C]-1.9462[/C][C]0.971802[/C][/ROW]
[ROW][C]7[/C][C]-0.049308[/C][C]-0.3787[/C][C]0.646882[/C][/ROW]
[ROW][C]8[/C][C]0.029088[/C][C]0.2234[/C][C]0.411987[/C][/ROW]
[ROW][C]9[/C][C]0.082241[/C][C]0.6317[/C][C]0.26501[/C][/ROW]
[ROW][C]10[/C][C]0.033195[/C][C]0.255[/C][C]0.399815[/C][/ROW]
[ROW][C]11[/C][C]0.015498[/C][C]0.119[/C][C]0.452824[/C][/ROW]
[ROW][C]12[/C][C]-0.014481[/C][C]-0.1112[/C][C]0.544094[/C][/ROW]
[ROW][C]13[/C][C]0.01184[/C][C]0.0909[/C][C]0.463923[/C][/ROW]
[ROW][C]14[/C][C]0.111243[/C][C]0.8545[/C][C]0.198149[/C][/ROW]
[ROW][C]15[/C][C]-0.078359[/C][C]-0.6019[/C][C]0.725223[/C][/ROW]
[ROW][C]16[/C][C]-0.143999[/C][C]-1.1061[/C][C]0.863409[/C][/ROW]
[/TABLE]
Source: https://freestatistics.org/blog/index.php?pk=2791&T=1

Globally Unique Identifier (entire table): ba.freestatistics.org/blog/index.php?pk=2791&T=1

As an alternative you can also use a QR Code:  

The GUIDs for individual cells are displayed in the table below:

Autocorrelation Function
Time lag kACF(k)T-STATP-value
017.68110
10.2273151.7460.043005
2-0.193427-1.48570.928664
3-0.118167-0.90770.816124
40.1352531.03890.151546
50.0709450.54490.293924
6-0.253376-1.94620.971802
7-0.049308-0.37870.646882
80.0290880.22340.411987
90.0822410.63170.26501
100.0331950.2550.399815
110.0154980.1190.452824
12-0.014481-0.11120.544094
130.011840.09090.463923
140.1112430.85450.198149
15-0.078359-0.60190.725223
16-0.143999-1.10610.863409


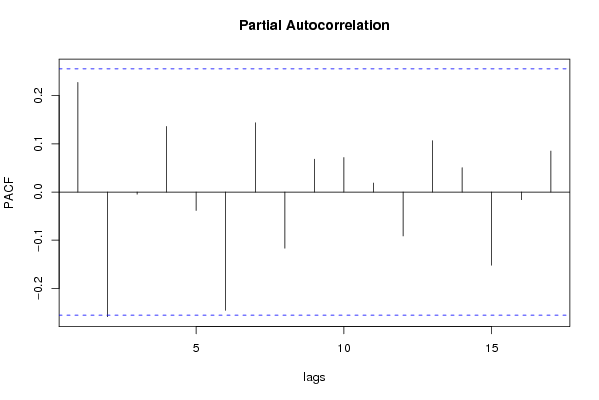
Partial Autocorrelation Function
Time lag kPACF(k)T-STATP-value
00.2273151.7460.043005
1-0.258454-1.98520.974113
2-0.004615-0.03540.514078
30.1358561.04350.15048
4-0.038206-0.29350.614901
5-0.245308-1.88420.967769
60.1435811.10290.137282
7-0.116577-0.89540.812905
80.0680370.52260.301603
90.0714820.54910.292517
100.0185590.14260.443565
11-0.091108-0.69980.756604
120.1064750.81790.208366
130.0504190.38730.349972
14-0.151657-1.16490.875626
15-0.01584-0.12170.548213
160.0850120.6530.25815

\begin{tabular}{lllllllll}
\hline
Partial Autocorrelation Function \tabularnewline
Time lag k & PACF(k) & T-STAT & P-value \tabularnewline
0 & 0.227315 & 1.746 & 0.043005 \tabularnewline
1 & -0.258454 & -1.9852 & 0.974113 \tabularnewline
2 & -0.004615 & -0.0354 & 0.514078 \tabularnewline
3 & 0.135856 & 1.0435 & 0.15048 \tabularnewline
4 & -0.038206 & -0.2935 & 0.614901 \tabularnewline
5 & -0.245308 & -1.8842 & 0.967769 \tabularnewline
6 & 0.143581 & 1.1029 & 0.137282 \tabularnewline
7 & -0.116577 & -0.8954 & 0.812905 \tabularnewline
8 & 0.068037 & 0.5226 & 0.301603 \tabularnewline
9 & 0.071482 & 0.5491 & 0.292517 \tabularnewline
10 & 0.018559 & 0.1426 & 0.443565 \tabularnewline
11 & -0.091108 & -0.6998 & 0.756604 \tabularnewline
12 & 0.106475 & 0.8179 & 0.208366 \tabularnewline
13 & 0.050419 & 0.3873 & 0.349972 \tabularnewline
14 & -0.151657 & -1.1649 & 0.875626 \tabularnewline
15 & -0.01584 & -0.1217 & 0.548213 \tabularnewline
16 & 0.085012 & 0.653 & 0.25815 \tabularnewline
\hline
\end{tabular}
%Source: https://freestatistics.org/blog/index.php?pk=2791&T=2

[TABLE]
[ROW][C]Partial Autocorrelation Function[/C][/ROW]
[ROW][C]Time lag k[/C][C]PACF(k)[/C][C]T-STAT[/C][C]P-value[/C][/ROW]
[ROW][C]0[/C][C]0.227315[/C][C]1.746[/C][C]0.043005[/C][/ROW]
[ROW][C]1[/C][C]-0.258454[/C][C]-1.9852[/C][C]0.974113[/C][/ROW]
[ROW][C]2[/C][C]-0.004615[/C][C]-0.0354[/C][C]0.514078[/C][/ROW]
[ROW][C]3[/C][C]0.135856[/C][C]1.0435[/C][C]0.15048[/C][/ROW]
[ROW][C]4[/C][C]-0.038206[/C][C]-0.2935[/C][C]0.614901[/C][/ROW]
[ROW][C]5[/C][C]-0.245308[/C][C]-1.8842[/C][C]0.967769[/C][/ROW]
[ROW][C]6[/C][C]0.143581[/C][C]1.1029[/C][C]0.137282[/C][/ROW]
[ROW][C]7[/C][C]-0.116577[/C][C]-0.8954[/C][C]0.812905[/C][/ROW]
[ROW][C]8[/C][C]0.068037[/C][C]0.5226[/C][C]0.301603[/C][/ROW]
[ROW][C]9[/C][C]0.071482[/C][C]0.5491[/C][C]0.292517[/C][/ROW]
[ROW][C]10[/C][C]0.018559[/C][C]0.1426[/C][C]0.443565[/C][/ROW]
[ROW][C]11[/C][C]-0.091108[/C][C]-0.6998[/C][C]0.756604[/C][/ROW]
[ROW][C]12[/C][C]0.106475[/C][C]0.8179[/C][C]0.208366[/C][/ROW]
[ROW][C]13[/C][C]0.050419[/C][C]0.3873[/C][C]0.349972[/C][/ROW]
[ROW][C]14[/C][C]-0.151657[/C][C]-1.1649[/C][C]0.875626[/C][/ROW]
[ROW][C]15[/C][C]-0.01584[/C][C]-0.1217[/C][C]0.548213[/C][/ROW]
[ROW][C]16[/C][C]0.085012[/C][C]0.653[/C][C]0.25815[/C][/ROW]
[/TABLE]
Source: https://freestatistics.org/blog/index.php?pk=2791&T=2

Globally Unique Identifier (entire table): ba.freestatistics.org/blog/index.php?pk=2791&T=2

As an alternative you can also use a QR Code:  

The GUIDs for individual cells are displayed in the table below:

Partial Autocorrelation Function
Time lag kPACF(k)T-STATP-value
00.2273151.7460.043005
1-0.258454-1.98520.974113
2-0.004615-0.03540.514078
30.1358561.04350.15048
4-0.038206-0.29350.614901
5-0.245308-1.88420.967769
60.1435811.10290.137282
7-0.116577-0.89540.812905
80.0680370.52260.301603
90.0714820.54910.292517
100.0185590.14260.443565
11-0.091108-0.69980.756604
120.1064750.81790.208366
130.0504190.38730.349972
14-0.151657-1.16490.875626
15-0.01584-0.12170.548213
160.0850120.6530.25815


Parameters (Session):
par1 = Default ; par2 = 1 ; par3 = 1 ; par4 = 0 ; par5 = 12 ;
Parameters (R input):
par1 = Default ; par2 = 1 ; par3 = 1 ; par4 = 0 ; par5 = 12 ;
R code (references can be found in the software module):
if (par1 == 'Default') {
par1 = 10*log10(length(x))
} else {
par1 <- as.numeric(par1)
}
par2 <- as.numeric(par2)
par3 <- as.numeric(par3)
par4 <- as.numeric(par4)
par5 <- as.numeric(par5)
if (par2 == 0) {
x <- log(x)
} else {
x <- (x ^ par2 - 1) / par2
}
if (par3 > 0) x <- diff(x,lag=1,difference=par3)
if (par4 > 0) x <- diff(x,lag=par5,difference=par4)
bitmap(file='pic1.png')
racf <- acf(x,par1,main='Autocorrelation',xlab='lags',ylab='ACF')
dev.off()
bitmap(file='pic2.png')
rpacf <- pacf(x,par1,main='Partial Autocorrelation',xlab='lags',ylab='PACF')
dev.off()
(myacf <- c(racf$acf))
(mypacf <- c(rpacf$acf))
lengthx <- length(x)
sqrtn <- sqrt(lengthx)
load(file='createtable')
a<-table.start()
a<-table.row.start(a)
a<-table.element(a,'Autocorrelation Function',4,TRUE)
a<-table.row.end(a)
a<-table.row.start(a)
a<-table.element(a,'Time lag k',header=TRUE)
a<-table.element(a,hyperlink('basics.htm','ACF(k)','click here for more information about the Autocorrelation Function'),header=TRUE)
a<-table.element(a,'T-STAT',header=TRUE)
a<-table.element(a,'P-value',header=TRUE)
a<-table.row.end(a)
for (i in 1:par1) {
a<-table.row.start(a)
a<-table.element(a,i-1,header=TRUE)
a<-table.element(a,round(myacf[i],6))
mytstat <- myacf[i]*sqrtn
a<-table.element(a,round(mytstat,4))
a<-table.element(a,round(1-pt(mytstat,lengthx),6))
a<-table.row.end(a)
}
a<-table.end(a)
table.save(a,file='mytable.tab')
a<-table.start()
a<-table.row.start(a)
a<-table.element(a,'Partial Autocorrelation Function',4,TRUE)
a<-table.row.end(a)
a<-table.row.start(a)
a<-table.element(a,'Time lag k',header=TRUE)
a<-table.element(a,hyperlink('basics.htm','PACF(k)','click here for more information about the Partial Autocorrelation Function'),header=TRUE)
a<-table.element(a,'T-STAT',header=TRUE)
a<-table.element(a,'P-value',header=TRUE)
a<-table.row.end(a)
for (i in 1:par1) {
a<-table.row.start(a)
a<-table.element(a,i-1,header=TRUE)
a<-table.element(a,round(mypacf[i],6))
mytstat <- mypacf[i]*sqrtn
a<-table.element(a,round(mytstat,4))
a<-table.element(a,round(1-pt(mytstat,lengthx),6))
a<-table.row.end(a)
}
a<-table.end(a)
table.save(a,file='mytable1.tab')