Free Statistics
of Irreproducible Research!
Description of Statistical Computation | |||||||||||||||||||||||||||||||||||||||||||||||||||
|---|---|---|---|---|---|---|---|---|---|---|---|---|---|---|---|---|---|---|---|---|---|---|---|---|---|---|---|---|---|---|---|---|---|---|---|---|---|---|---|---|---|---|---|---|---|---|---|---|---|---|---|
| Author's title | |||||||||||||||||||||||||||||||||||||||||||||||||||
| Author | *Unverified author* | ||||||||||||||||||||||||||||||||||||||||||||||||||
| R Software Module | rwasp_pairs.wasp | ||||||||||||||||||||||||||||||||||||||||||||||||||
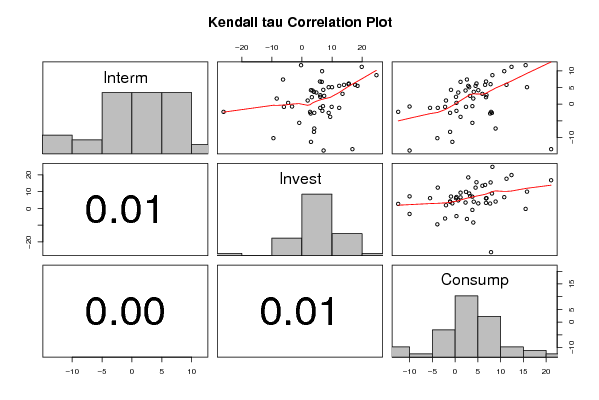
| Title produced by software | Kendall tau Correlation Matrix | ||||||||||||||||||||||||||||||||||||||||||||||||||
| Date of computation | Fri, 07 Dec 2007 05:50:43 -0700 | ||||||||||||||||||||||||||||||||||||||||||||||||||
| Cite this page as follows | Statistical Computations at FreeStatistics.org, Office for Research Development and Education, URL https://freestatistics.org/blog/index.php?v=date/2007/Dec/07/t1197031051ykuhuichuu698nn.htm/, Retrieved Mon, 29 Apr 2024 06:45:32 +0000 | ||||||||||||||||||||||||||||||||||||||||||||||||||
| Statistical Computations at FreeStatistics.org, Office for Research Development and Education, URL https://freestatistics.org/blog/index.php?pk=2789, Retrieved Mon, 29 Apr 2024 06:45:32 +0000 | |||||||||||||||||||||||||||||||||||||||||||||||||||
| QR Codes: | |||||||||||||||||||||||||||||||||||||||||||||||||||
|
| |||||||||||||||||||||||||||||||||||||||||||||||||||
| Original text written by user: | |||||||||||||||||||||||||||||||||||||||||||||||||||
| IsPrivate? | No (this computation is public) | ||||||||||||||||||||||||||||||||||||||||||||||||||
| User-defined keywords | |||||||||||||||||||||||||||||||||||||||||||||||||||
| Estimated Impact | 194 | ||||||||||||||||||||||||||||||||||||||||||||||||||
Tree of Dependent Computations | |||||||||||||||||||||||||||||||||||||||||||||||||||
| Family? (F = Feedback message, R = changed R code, M = changed R Module, P = changed Parameters, D = changed Data) | |||||||||||||||||||||||||||||||||||||||||||||||||||
| - [Kendall tau Correlation Matrix] [Correlation Matri...] [2007-12-07 12:50:43] [ca5e0f9f346e091f4d0fe7e17f7dba21] [Current] | |||||||||||||||||||||||||||||||||||||||||||||||||||
| Feedback Forum | |||||||||||||||||||||||||||||||||||||||||||||||||||
Post a new message | |||||||||||||||||||||||||||||||||||||||||||||||||||
Dataset | |||||||||||||||||||||||||||||||||||||||||||||||||||
| Dataseries X: | |||||||||||||||||||||||||||||||||||||||||||||||||||
11,7 -0,3 15,5 -2,3 -26,1 7,9 -7,3 4,1 8,9 -13,5 16,8 21,1 -0,7 -3,3 -10 0,4 -4,6 0,3 6 15,5 7,8 2,2 6,1 0,2 1,7 -8,4 4 5,1 10 15,8 7,4 -6,3 2,6 5,8 14 6,6 5,5 12,4 4,5 -1,1 12,4 -3,8 6,8 6 6,8 2,1 3,3 6,8 -2,6 8,9 8,1 -3,8 9,4 1,2 -11,3 3 -0,6 -5,6 -0,9 3,8 -2,8 2,9 7,7 -1,1 6,1 -5,5 -13,9 7,2 -10 -2,6 4,1 -1,1 -8,3 4 -1,1 -10,2 -9,5 -3,9 -2 6,8 0,3 -2,3 2,7 -12,5 4,1 3,5 2,3 2,7 6,1 6,9 9,9 6,7 10,8 -0,8 -6 -2,2 8,7 24,8 8,2 -0,6 7 3,8 3,7 4 4,1 4,2 3 5,1 3,5 4,8 0,7 11,2 19,9 12,4 3,1 13,5 6 2,5 7,4 3,3 6,2 15,6 4,7 6,7 6,6 1,2 4,3 7,1 -0,9 5,5 18,5 2,9 1,1 1,9 -2 -0,8 9,9 2,4 5,8 17,7 11,3 5,1 8,9 3,1 | |||||||||||||||||||||||||||||||||||||||||||||||||||
Tables (Output of Computation) | |||||||||||||||||||||||||||||||||||||||||||||||||||
| |||||||||||||||||||||||||||||||||||||||||||||||||||
Figures (Output of Computation) | |||||||||||||||||||||||||||||||||||||||||||||||||||
Input Parameters & R Code | |||||||||||||||||||||||||||||||||||||||||||||||||||
| Parameters (Session): | |||||||||||||||||||||||||||||||||||||||||||||||||||
| Parameters (R input): | |||||||||||||||||||||||||||||||||||||||||||||||||||
| R code (references can be found in the software module): | |||||||||||||||||||||||||||||||||||||||||||||||||||
panel.tau <- function(x, y, digits=2, prefix='', cex.cor) | |||||||||||||||||||||||||||||||||||||||||||||||||||