Free Statistics

of Irreproducible Research!

Author's title

Author*Unverified author*
R Software Modulerwasp_arimabackwardselection.wasp
Title produced by softwareARIMA Backward Selection
Date of computationFri, 07 Dec 2007 05:09:56 -0700
Cite this page as followsStatistical Computations at FreeStatistics.org, Office for Research Development and Education, URL https://freestatistics.org/blog/index.php?v=date/2007/Dec/07/t1197028616zu8zzu9wjld7o21.htm/, Retrieved Mon, 29 Apr 2024 06:56:03 +0000
Statistical Computations at FreeStatistics.org, Office for Research Development and Education, URL https://freestatistics.org/blog/index.php?pk=2770, Retrieved Mon, 29 Apr 2024 06:56:03 +0000
QR Codes:

Original text written by user:
IsPrivate?No (this computation is public)
User-defined keywords
Estimated Impact212
Family? (F = Feedback message, R = changed R code, M = changed R Module, P = changed Parameters, D = changed Data)
-       [ARIMA Backward Selection] [Verbetering_works...] [2007-12-07 12:09:56] [129742d52914620af0bad7eb53591257] [Current]
Feedback Forum

Post a new message
Dataseries X:
33259
33250
32875
32424
31867
31871
33140
33555
33324
32358
31857
32101
32810
32057
31663
31325
31103
31012
32511
33677
32213
31635
31043
31303
31899
31384
30650
30400
30003
29896
31557
31883
30830
30354
29756
29934
30599
30378
29925
29471
29567
29419
30796
31475
31708
31917
30871
31512
32362
31928
31699
30363
30386
30364
32806
33423
33071
33888
34805
35489
37259
37722
38764
39594
40004
40715
44028
45564
44277
44976
45406
47379
49200
50221
51573
53091
53337
54978
57885
67099
67169
69796
70600
71982
73957
75273
76322
77078
77954
79238
82179
83834
83744
84861
86478
88290
90287
91230
92380
92506
94172
94728
96581
97344
98346
98214
98366
98768


Summary of compuational transaction
Raw Inputview raw input (R code)
Raw Outputview raw output of R engine
Computing time3 seconds
R Server'Gwilym Jenkins' @ 72.249.127.135

\begin{tabular}{lllllllll}
\hline
Summary of compuational transaction \tabularnewline
Raw Input & view raw input (R code)  \tabularnewline
Raw Output & view raw output of R engine  \tabularnewline
Computing time & 3 seconds \tabularnewline
R Server & 'Gwilym Jenkins' @ 72.249.127.135 \tabularnewline
\hline
\end{tabular}
%Source: https://freestatistics.org/blog/index.php?pk=2770&T=0

[TABLE]
[ROW][C]Summary of compuational transaction[/C][/ROW]
[ROW][C]Raw Input[/C][C]view raw input (R code) [/C][/ROW]
[ROW][C]Raw Output[/C][C]view raw output of R engine [/C][/ROW]
[ROW][C]Computing time[/C][C]3 seconds[/C][/ROW]
[ROW][C]R Server[/C][C]'Gwilym Jenkins' @ 72.249.127.135[/C][/ROW]
[/TABLE]
Source: https://freestatistics.org/blog/index.php?pk=2770&T=0

Globally Unique Identifier (entire table): ba.freestatistics.org/blog/index.php?pk=2770&T=0

As an alternative you can also use a QR Code:  

The GUIDs for individual cells are displayed in the table below:

Summary of compuational transaction
Raw Inputview raw input (R code)
Raw Outputview raw output of R engine
Computing time3 seconds
R Server'Gwilym Jenkins' @ 72.249.127.135


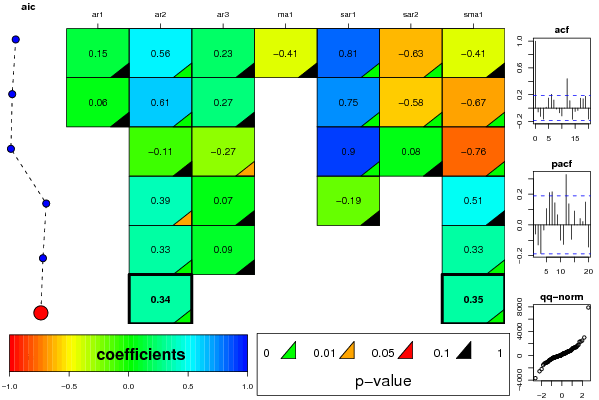
ARIMA Parameter Estimation and Backward Selection
Iterationar1ar2ar3ma1sar1sar2sma1
Estimates ( 1 )0.14710.55530.2298-0.40550.8059-0.6301-0.4055
(p-val)(0.5785 )(0 )(0.2476 )(0.6672 )(0 )(0 )(0.6672 )
Estimates ( 2 )0.06190.60580.274900.7527-0.577-0.6733
(p-val)(0.7712 )(0 )(0.1088 )(NA )(0 )(0 )(4e-04 )
Estimates ( 3 )0-0.1099-0.266200.89980.0767-0.7619
(p-val)(NA )(0.3408 )(0.0141 )(NA )(0 )(0.6044 )(0 )
Estimates ( 4 )00.39430.0660-0.187200.5141
(p-val)(NA )(0.0119 )(0.5652 )(NA )(0.606 )(NA )(0.1577 )
Estimates ( 5 )00.33420.08860000.3326
(p-val)(NA )(7e-04 )(0.3362 )(NA )(NA )(NA )(0.0011 )
Estimates ( 6 )00.343900000.354
(p-val)(NA )(3e-04 )(NA )(NA )(NA )(NA )(5e-04 )

\begin{tabular}{lllllllll}
\hline
ARIMA Parameter Estimation and Backward Selection \tabularnewline
Iteration & ar1 & ar2 & ar3 & ma1 & sar1 & sar2 & sma1 \tabularnewline
Estimates ( 1 ) & 0.1471 & 0.5553 & 0.2298 & -0.4055 & 0.8059 & -0.6301 & -0.4055 \tabularnewline
(p-val) & (0.5785 ) & (0 ) & (0.2476 ) & (0.6672 ) & (0 ) & (0 ) & (0.6672 ) \tabularnewline
Estimates ( 2 ) & 0.0619 & 0.6058 & 0.2749 & 0 & 0.7527 & -0.577 & -0.6733 \tabularnewline
(p-val) & (0.7712 ) & (0 ) & (0.1088 ) & (NA ) & (0 ) & (0 ) & (4e-04 ) \tabularnewline
Estimates ( 3 ) & 0 & -0.1099 & -0.2662 & 0 & 0.8998 & 0.0767 & -0.7619 \tabularnewline
(p-val) & (NA ) & (0.3408 ) & (0.0141 ) & (NA ) & (0 ) & (0.6044 ) & (0 ) \tabularnewline
Estimates ( 4 ) & 0 & 0.3943 & 0.066 & 0 & -0.1872 & 0 & 0.5141 \tabularnewline
(p-val) & (NA ) & (0.0119 ) & (0.5652 ) & (NA ) & (0.606 ) & (NA ) & (0.1577 ) \tabularnewline
Estimates ( 5 ) & 0 & 0.3342 & 0.0886 & 0 & 0 & 0 & 0.3326 \tabularnewline
(p-val) & (NA ) & (7e-04 ) & (0.3362 ) & (NA ) & (NA ) & (NA ) & (0.0011 ) \tabularnewline
Estimates ( 6 ) & 0 & 0.3439 & 0 & 0 & 0 & 0 & 0.354 \tabularnewline
(p-val) & (NA ) & (3e-04 ) & (NA ) & (NA ) & (NA ) & (NA ) & (5e-04 ) \tabularnewline
\hline
\end{tabular}
%Source: https://freestatistics.org/blog/index.php?pk=2770&T=1

[TABLE]
[ROW][C]ARIMA Parameter Estimation and Backward Selection[/C][/ROW]
[ROW][C]Iteration[/C][C]ar1[/C][C]ar2[/C][C]ar3[/C][C]ma1[/C][C]sar1[/C][C]sar2[/C][C]sma1[/C][/ROW]
[ROW][C]Estimates ( 1 )[/C][C]0.1471[/C][C]0.5553[/C][C]0.2298[/C][C]-0.4055[/C][C]0.8059[/C][C]-0.6301[/C][C]-0.4055[/C][/ROW]
[ROW][C](p-val)[/C][C](0.5785 )[/C][C](0 )[/C][C](0.2476 )[/C][C](0.6672 )[/C][C](0 )[/C][C](0 )[/C][C](0.6672 )[/C][/ROW]
[ROW][C]Estimates ( 2 )[/C][C]0.0619[/C][C]0.6058[/C][C]0.2749[/C][C]0[/C][C]0.7527[/C][C]-0.577[/C][C]-0.6733[/C][/ROW]
[ROW][C](p-val)[/C][C](0.7712 )[/C][C](0 )[/C][C](0.1088 )[/C][C](NA )[/C][C](0 )[/C][C](0 )[/C][C](4e-04 )[/C][/ROW]
[ROW][C]Estimates ( 3 )[/C][C]0[/C][C]-0.1099[/C][C]-0.2662[/C][C]0[/C][C]0.8998[/C][C]0.0767[/C][C]-0.7619[/C][/ROW]
[ROW][C](p-val)[/C][C](NA )[/C][C](0.3408 )[/C][C](0.0141 )[/C][C](NA )[/C][C](0 )[/C][C](0.6044 )[/C][C](0 )[/C][/ROW]
[ROW][C]Estimates ( 4 )[/C][C]0[/C][C]0.3943[/C][C]0.066[/C][C]0[/C][C]-0.1872[/C][C]0[/C][C]0.5141[/C][/ROW]
[ROW][C](p-val)[/C][C](NA )[/C][C](0.0119 )[/C][C](0.5652 )[/C][C](NA )[/C][C](0.606 )[/C][C](NA )[/C][C](0.1577 )[/C][/ROW]
[ROW][C]Estimates ( 5 )[/C][C]0[/C][C]0.3342[/C][C]0.0886[/C][C]0[/C][C]0[/C][C]0[/C][C]0.3326[/C][/ROW]
[ROW][C](p-val)[/C][C](NA )[/C][C](7e-04 )[/C][C](0.3362 )[/C][C](NA )[/C][C](NA )[/C][C](NA )[/C][C](0.0011 )[/C][/ROW]
[ROW][C]Estimates ( 6 )[/C][C]0[/C][C]0.3439[/C][C]0[/C][C]0[/C][C]0[/C][C]0[/C][C]0.354[/C][/ROW]
[ROW][C](p-val)[/C][C](NA )[/C][C](3e-04 )[/C][C](NA )[/C][C](NA )[/C][C](NA )[/C][C](NA )[/C][C](5e-04 )[/C][/ROW]
[/TABLE]
Source: https://freestatistics.org/blog/index.php?pk=2770&T=1

Globally Unique Identifier (entire table): ba.freestatistics.org/blog/index.php?pk=2770&T=1

As an alternative you can also use a QR Code:  

The GUIDs for individual cells are displayed in the table below:

ARIMA Parameter Estimation and Backward Selection
Iterationar1ar2ar3ma1sar1sar2sma1
Estimates ( 1 )0.14710.55530.2298-0.40550.8059-0.6301-0.4055
(p-val)(0.5785 )(0 )(0.2476 )(0.6672 )(0 )(0 )(0.6672 )
Estimates ( 2 )0.06190.60580.274900.7527-0.577-0.6733
(p-val)(0.7712 )(0 )(0.1088 )(NA )(0 )(0 )(4e-04 )
Estimates ( 3 )0-0.1099-0.266200.89980.0767-0.7619
(p-val)(NA )(0.3408 )(0.0141 )(NA )(0 )(0.6044 )(0 )
Estimates ( 4 )00.39430.0660-0.187200.5141
(p-val)(NA )(0.0119 )(0.5652 )(NA )(0.606 )(NA )(0.1577 )
Estimates ( 5 )00.33420.08860000.3326
(p-val)(NA )(7e-04 )(0.3362 )(NA )(NA )(NA )(0.0011 )
Estimates ( 6 )00.343900000.354
(p-val)(NA )(3e-04 )(NA )(NA )(NA )(NA )(5e-04 )


Estimated ARIMA Residuals
Value
33.2589783931702
-7.91207710197769
-361.373925608862
-323.127352578253
-323.416963031977
295.49889116074
1396.83160777466
-1.53942013119187
-654.970842701264
-999.268592844647
-128.230079218773
629.960866705679
752.495166138516
-1040.43151502322
-306.566331038141
-47.1680714328868
-7.94380414353873
59.5019832446051
1583.34295374734
689.517531520149
-2186.24698182053
-373.396925606117
-81.7828083237073
610.03134056583
642.175633634328
-763.032139252598
-702.468198403101
102.955594970743
-140.310747491072
88.22104774541
1786.48774930462
-197.194697576077
-1533.08867998589
-222.211339484114
-201.035644446551
497.200941114224
741.67070056298
-474.182639264101
-533.327495230016
-261.666061897497
353.99456439419
-73.8694846667713
1409.68726726279
251.156918319095
-297.64246160382
-40.9012137305763
-1170.40449425815
939.743035174404
868.56635648735
-844.452992859297
-289.025039897489
-1170.10570210361
527.103203940831
269.508209532814
2463.00225766685
-196.781088932275
-1100.78178718414
760.59576550527
727.060345229867
200.321967987962
1324.544541926
-287.309595685416
485.398156638017
357.078185471408
-98.0137042901843
373.910386689597
2978.11549994820
271.654417158112
-2547.58785471595
739.459190414549
478.200400026268
1694.32550114839
1051.91468486965
-26.3276182624395
577.405732246669
823.467266661974
-570.142172614927
1203.52261708272
2290.10202817534
7882.15736374175
-3668.20707581607
509.926903934174
-204.975728871941
565.964646540087
1285.41848132442
355.42213297596
148.319977325635
91.9301727439743
378.282165482553
812.625778745933
2311.02185708241
379.724480361692
-1312.94215564092
740.036983688959
1254.40500137889
1029.47829220077
1015.27587738143
-143.454748029340
369.792672066033
-489.006167269414
1360.75527131109
-40.4902609045675
1298.49186009378
-2.19699673212017
334.176281947308
-662.248740938259
-30.2252180153155
367.431243500658

\begin{tabular}{lllllllll}
\hline
Estimated ARIMA Residuals \tabularnewline
Value \tabularnewline
33.2589783931702 \tabularnewline
-7.91207710197769 \tabularnewline
-361.373925608862 \tabularnewline
-323.127352578253 \tabularnewline
-323.416963031977 \tabularnewline
295.49889116074 \tabularnewline
1396.83160777466 \tabularnewline
-1.53942013119187 \tabularnewline
-654.970842701264 \tabularnewline
-999.268592844647 \tabularnewline
-128.230079218773 \tabularnewline
629.960866705679 \tabularnewline
752.495166138516 \tabularnewline
-1040.43151502322 \tabularnewline
-306.566331038141 \tabularnewline
-47.1680714328868 \tabularnewline
-7.94380414353873 \tabularnewline
59.5019832446051 \tabularnewline
1583.34295374734 \tabularnewline
689.517531520149 \tabularnewline
-2186.24698182053 \tabularnewline
-373.396925606117 \tabularnewline
-81.7828083237073 \tabularnewline
610.03134056583 \tabularnewline
642.175633634328 \tabularnewline
-763.032139252598 \tabularnewline
-702.468198403101 \tabularnewline
102.955594970743 \tabularnewline
-140.310747491072 \tabularnewline
88.22104774541 \tabularnewline
1786.48774930462 \tabularnewline
-197.194697576077 \tabularnewline
-1533.08867998589 \tabularnewline
-222.211339484114 \tabularnewline
-201.035644446551 \tabularnewline
497.200941114224 \tabularnewline
741.67070056298 \tabularnewline
-474.182639264101 \tabularnewline
-533.327495230016 \tabularnewline
-261.666061897497 \tabularnewline
353.99456439419 \tabularnewline
-73.8694846667713 \tabularnewline
1409.68726726279 \tabularnewline
251.156918319095 \tabularnewline
-297.64246160382 \tabularnewline
-40.9012137305763 \tabularnewline
-1170.40449425815 \tabularnewline
939.743035174404 \tabularnewline
868.56635648735 \tabularnewline
-844.452992859297 \tabularnewline
-289.025039897489 \tabularnewline
-1170.10570210361 \tabularnewline
527.103203940831 \tabularnewline
269.508209532814 \tabularnewline
2463.00225766685 \tabularnewline
-196.781088932275 \tabularnewline
-1100.78178718414 \tabularnewline
760.59576550527 \tabularnewline
727.060345229867 \tabularnewline
200.321967987962 \tabularnewline
1324.544541926 \tabularnewline
-287.309595685416 \tabularnewline
485.398156638017 \tabularnewline
357.078185471408 \tabularnewline
-98.0137042901843 \tabularnewline
373.910386689597 \tabularnewline
2978.11549994820 \tabularnewline
271.654417158112 \tabularnewline
-2547.58785471595 \tabularnewline
739.459190414549 \tabularnewline
478.200400026268 \tabularnewline
1694.32550114839 \tabularnewline
1051.91468486965 \tabularnewline
-26.3276182624395 \tabularnewline
577.405732246669 \tabularnewline
823.467266661974 \tabularnewline
-570.142172614927 \tabularnewline
1203.52261708272 \tabularnewline
2290.10202817534 \tabularnewline
7882.15736374175 \tabularnewline
-3668.20707581607 \tabularnewline
509.926903934174 \tabularnewline
-204.975728871941 \tabularnewline
565.964646540087 \tabularnewline
1285.41848132442 \tabularnewline
355.42213297596 \tabularnewline
148.319977325635 \tabularnewline
91.9301727439743 \tabularnewline
378.282165482553 \tabularnewline
812.625778745933 \tabularnewline
2311.02185708241 \tabularnewline
379.724480361692 \tabularnewline
-1312.94215564092 \tabularnewline
740.036983688959 \tabularnewline
1254.40500137889 \tabularnewline
1029.47829220077 \tabularnewline
1015.27587738143 \tabularnewline
-143.454748029340 \tabularnewline
369.792672066033 \tabularnewline
-489.006167269414 \tabularnewline
1360.75527131109 \tabularnewline
-40.4902609045675 \tabularnewline
1298.49186009378 \tabularnewline
-2.19699673212017 \tabularnewline
334.176281947308 \tabularnewline
-662.248740938259 \tabularnewline
-30.2252180153155 \tabularnewline
367.431243500658 \tabularnewline
\hline
\end{tabular}
%Source: https://freestatistics.org/blog/index.php?pk=2770&T=2

[TABLE]
[ROW][C]Estimated ARIMA Residuals[/C][/ROW]
[ROW][C]Value[/C][/ROW]
[ROW][C]33.2589783931702[/C][/ROW]
[ROW][C]-7.91207710197769[/C][/ROW]
[ROW][C]-361.373925608862[/C][/ROW]
[ROW][C]-323.127352578253[/C][/ROW]
[ROW][C]-323.416963031977[/C][/ROW]
[ROW][C]295.49889116074[/C][/ROW]
[ROW][C]1396.83160777466[/C][/ROW]
[ROW][C]-1.53942013119187[/C][/ROW]
[ROW][C]-654.970842701264[/C][/ROW]
[ROW][C]-999.268592844647[/C][/ROW]
[ROW][C]-128.230079218773[/C][/ROW]
[ROW][C]629.960866705679[/C][/ROW]
[ROW][C]752.495166138516[/C][/ROW]
[ROW][C]-1040.43151502322[/C][/ROW]
[ROW][C]-306.566331038141[/C][/ROW]
[ROW][C]-47.1680714328868[/C][/ROW]
[ROW][C]-7.94380414353873[/C][/ROW]
[ROW][C]59.5019832446051[/C][/ROW]
[ROW][C]1583.34295374734[/C][/ROW]
[ROW][C]689.517531520149[/C][/ROW]
[ROW][C]-2186.24698182053[/C][/ROW]
[ROW][C]-373.396925606117[/C][/ROW]
[ROW][C]-81.7828083237073[/C][/ROW]
[ROW][C]610.03134056583[/C][/ROW]
[ROW][C]642.175633634328[/C][/ROW]
[ROW][C]-763.032139252598[/C][/ROW]
[ROW][C]-702.468198403101[/C][/ROW]
[ROW][C]102.955594970743[/C][/ROW]
[ROW][C]-140.310747491072[/C][/ROW]
[ROW][C]88.22104774541[/C][/ROW]
[ROW][C]1786.48774930462[/C][/ROW]
[ROW][C]-197.194697576077[/C][/ROW]
[ROW][C]-1533.08867998589[/C][/ROW]
[ROW][C]-222.211339484114[/C][/ROW]
[ROW][C]-201.035644446551[/C][/ROW]
[ROW][C]497.200941114224[/C][/ROW]
[ROW][C]741.67070056298[/C][/ROW]
[ROW][C]-474.182639264101[/C][/ROW]
[ROW][C]-533.327495230016[/C][/ROW]
[ROW][C]-261.666061897497[/C][/ROW]
[ROW][C]353.99456439419[/C][/ROW]
[ROW][C]-73.8694846667713[/C][/ROW]
[ROW][C]1409.68726726279[/C][/ROW]
[ROW][C]251.156918319095[/C][/ROW]
[ROW][C]-297.64246160382[/C][/ROW]
[ROW][C]-40.9012137305763[/C][/ROW]
[ROW][C]-1170.40449425815[/C][/ROW]
[ROW][C]939.743035174404[/C][/ROW]
[ROW][C]868.56635648735[/C][/ROW]
[ROW][C]-844.452992859297[/C][/ROW]
[ROW][C]-289.025039897489[/C][/ROW]
[ROW][C]-1170.10570210361[/C][/ROW]
[ROW][C]527.103203940831[/C][/ROW]
[ROW][C]269.508209532814[/C][/ROW]
[ROW][C]2463.00225766685[/C][/ROW]
[ROW][C]-196.781088932275[/C][/ROW]
[ROW][C]-1100.78178718414[/C][/ROW]
[ROW][C]760.59576550527[/C][/ROW]
[ROW][C]727.060345229867[/C][/ROW]
[ROW][C]200.321967987962[/C][/ROW]
[ROW][C]1324.544541926[/C][/ROW]
[ROW][C]-287.309595685416[/C][/ROW]
[ROW][C]485.398156638017[/C][/ROW]
[ROW][C]357.078185471408[/C][/ROW]
[ROW][C]-98.0137042901843[/C][/ROW]
[ROW][C]373.910386689597[/C][/ROW]
[ROW][C]2978.11549994820[/C][/ROW]
[ROW][C]271.654417158112[/C][/ROW]
[ROW][C]-2547.58785471595[/C][/ROW]
[ROW][C]739.459190414549[/C][/ROW]
[ROW][C]478.200400026268[/C][/ROW]
[ROW][C]1694.32550114839[/C][/ROW]
[ROW][C]1051.91468486965[/C][/ROW]
[ROW][C]-26.3276182624395[/C][/ROW]
[ROW][C]577.405732246669[/C][/ROW]
[ROW][C]823.467266661974[/C][/ROW]
[ROW][C]-570.142172614927[/C][/ROW]
[ROW][C]1203.52261708272[/C][/ROW]
[ROW][C]2290.10202817534[/C][/ROW]
[ROW][C]7882.15736374175[/C][/ROW]
[ROW][C]-3668.20707581607[/C][/ROW]
[ROW][C]509.926903934174[/C][/ROW]
[ROW][C]-204.975728871941[/C][/ROW]
[ROW][C]565.964646540087[/C][/ROW]
[ROW][C]1285.41848132442[/C][/ROW]
[ROW][C]355.42213297596[/C][/ROW]
[ROW][C]148.319977325635[/C][/ROW]
[ROW][C]91.9301727439743[/C][/ROW]
[ROW][C]378.282165482553[/C][/ROW]
[ROW][C]812.625778745933[/C][/ROW]
[ROW][C]2311.02185708241[/C][/ROW]
[ROW][C]379.724480361692[/C][/ROW]
[ROW][C]-1312.94215564092[/C][/ROW]
[ROW][C]740.036983688959[/C][/ROW]
[ROW][C]1254.40500137889[/C][/ROW]
[ROW][C]1029.47829220077[/C][/ROW]
[ROW][C]1015.27587738143[/C][/ROW]
[ROW][C]-143.454748029340[/C][/ROW]
[ROW][C]369.792672066033[/C][/ROW]
[ROW][C]-489.006167269414[/C][/ROW]
[ROW][C]1360.75527131109[/C][/ROW]
[ROW][C]-40.4902609045675[/C][/ROW]
[ROW][C]1298.49186009378[/C][/ROW]
[ROW][C]-2.19699673212017[/C][/ROW]
[ROW][C]334.176281947308[/C][/ROW]
[ROW][C]-662.248740938259[/C][/ROW]
[ROW][C]-30.2252180153155[/C][/ROW]
[ROW][C]367.431243500658[/C][/ROW]
[/TABLE]
Source: https://freestatistics.org/blog/index.php?pk=2770&T=2

Globally Unique Identifier (entire table): ba.freestatistics.org/blog/index.php?pk=2770&T=2

As an alternative you can also use a QR Code:  

The GUIDs for individual cells are displayed in the table below:

Estimated ARIMA Residuals
Value
33.2589783931702
-7.91207710197769
-361.373925608862
-323.127352578253
-323.416963031977
295.49889116074
1396.83160777466
-1.53942013119187
-654.970842701264
-999.268592844647
-128.230079218773
629.960866705679
752.495166138516
-1040.43151502322
-306.566331038141
-47.1680714328868
-7.94380414353873
59.5019832446051
1583.34295374734
689.517531520149
-2186.24698182053
-373.396925606117
-81.7828083237073
610.03134056583
642.175633634328
-763.032139252598
-702.468198403101
102.955594970743
-140.310747491072
88.22104774541
1786.48774930462
-197.194697576077
-1533.08867998589
-222.211339484114
-201.035644446551
497.200941114224
741.67070056298
-474.182639264101
-533.327495230016
-261.666061897497
353.99456439419
-73.8694846667713
1409.68726726279
251.156918319095
-297.64246160382
-40.9012137305763
-1170.40449425815
939.743035174404
868.56635648735
-844.452992859297
-289.025039897489
-1170.10570210361
527.103203940831
269.508209532814
2463.00225766685
-196.781088932275
-1100.78178718414
760.59576550527
727.060345229867
200.321967987962
1324.544541926
-287.309595685416
485.398156638017
357.078185471408
-98.0137042901843
373.910386689597
2978.11549994820
271.654417158112
-2547.58785471595
739.459190414549
478.200400026268
1694.32550114839
1051.91468486965
-26.3276182624395
577.405732246669
823.467266661974
-570.142172614927
1203.52261708272
2290.10202817534
7882.15736374175
-3668.20707581607
509.926903934174
-204.975728871941
565.964646540087
1285.41848132442
355.42213297596
148.319977325635
91.9301727439743
378.282165482553
812.625778745933
2311.02185708241
379.724480361692
-1312.94215564092
740.036983688959
1254.40500137889
1029.47829220077
1015.27587738143
-143.454748029340
369.792672066033
-489.006167269414
1360.75527131109
-40.4902609045675
1298.49186009378
-2.19699673212017
334.176281947308
-662.248740938259
-30.2252180153155
367.431243500658


Parameters (Session):
par1 = FALSE ; par2 = 1 ; par3 = 1 ; par4 = 0 ; par5 = 1 ; par6 = 3 ; par7 = 1 ; par8 = 2 ; par9 = 1 ;
Parameters (R input):
par1 = FALSE ; par2 = 1 ; par3 = 1 ; par4 = 0 ; par5 = 1 ; par6 = 3 ; par7 = 1 ; par8 = 2 ; par9 = 1 ;
R code (references can be found in the software module):
library(lattice)
if (par1 == 'TRUE') par1 <- TRUE
if (par1 == 'FALSE') par1 <- FALSE
par2 <- as.numeric(par2) #Box-Cox lambda transformation parameter
par3 <- as.numeric(par3) #degree of non-seasonal differencing
par4 <- as.numeric(par4) #degree of seasonal differencing
par5 <- as.numeric(par5) #seasonal period
par6 <- as.numeric(par6) #degree (p) of the non-seasonal AR(p) polynomial
par7 <- as.numeric(par7) #degree (q) of the non-seasonal MA(q) polynomial
par8 <- as.numeric(par8) #degree (P) of the seasonal AR(P) polynomial
par9 <- as.numeric(par9) #degree (Q) of the seasonal MA(Q) polynomial
armaGR <- function(arima.out, names, n){
try1 <- arima.out$coef
try2 <- sqrt(diag(arima.out$var.coef))
try.data.frame <- data.frame(matrix(NA,ncol=4,nrow=length(names)))
dimnames(try.data.frame) <- list(names,c('coef','std','tstat','pv'))
try.data.frame[,1] <- try1
for(i in 1:length(try2)) try.data.frame[which(rownames(try.data.frame)==names(try2)[i]),2] <- try2[i]
try.data.frame[,3] <- try.data.frame[,1] / try.data.frame[,2]
try.data.frame[,4] <- round((1-pt(abs(try.data.frame[,3]),df=n-(length(try2)+1)))*2,5)
vector <- rep(NA,length(names))
vector[is.na(try.data.frame[,4])] <- 0
maxi <- which.max(try.data.frame[,4])
continue <- max(try.data.frame[,4],na.rm=TRUE) > .05
vector[maxi] <- 0
list(summary=try.data.frame,next.vector=vector,continue=continue)
}
arimaSelect <- function(series, order=c(13,0,0), seasonal=list(order=c(2,0,0),period=12), include.mean=F){
nrc <- order[1]+order[3]+seasonal$order[1]+seasonal$order[3]
coeff <- matrix(NA, nrow=nrc, ncol=nrc)
pval <- matrix(NA, nrow=nrc, ncol=nrc)
mylist <- rep(list(NULL), nrc)
names <- NULL
if(order[1] > 0) names <- paste('ar',1:order[1],sep='')
if(order[3] > 0) names <- c( names , paste('ma',1:order[3],sep='') )
if(seasonal$order[1] > 0) names <- c(names, paste('sar',1:seasonal$order[1],sep=''))
if(seasonal$order[3] > 0) names <- c(names, paste('sma',1:seasonal$order[3],sep=''))
arima.out <- arima(series, order=order, seasonal=seasonal, include.mean=include.mean, method='ML')
mylist[[1]] <- arima.out
last.arma <- armaGR(arima.out, names, length(series))
mystop <- FALSE
i <- 1
coeff[i,] <- last.arma[[1]][,1]
pval [i,] <- last.arma[[1]][,4]
i <- 2
aic <- arima.out$aic
while(!mystop){
mylist[[i]] <- arima.out
arima.out <- arima(series, order=order, seasonal=seasonal, include.mean=include.mean, method='ML', fixed=last.arma$next.vector)
aic <- c(aic, arima.out$aic)
last.arma <- armaGR(arima.out, names, length(series))
mystop <- !last.arma$continue
coeff[i,] <- last.arma[[1]][,1]
pval [i,] <- last.arma[[1]][,4]
i <- i+1
}
list(coeff, pval, mylist, aic=aic)
}
arimaSelectplot <- function(arimaSelect.out,noms,choix){
noms <- names(arimaSelect.out[[3]][[1]]$coef)
coeff <- arimaSelect.out[[1]]
k <- min(which(is.na(coeff[,1])))-1
coeff <- coeff[1:k,]
pval <- arimaSelect.out[[2]][1:k,]
aic <- arimaSelect.out$aic[1:k]
coeff[coeff==0] <- NA
n <- ncol(coeff)
if(missing(choix)) choix <- k
layout(matrix(c(1,1,1,2,
3,3,3,2,
3,3,3,4,
5,6,7,7),nr=4),
widths=c(10,35,45,15),
heights=c(30,30,15,15))
couleurs <- rainbow(75)[1:50]#(50)
ticks <- pretty(coeff)
par(mar=c(1,1,3,1))
plot(aic,k:1-.5,type='o',pch=21,bg='blue',cex=2,axes=F,lty=2,xpd=NA)
points(aic[choix],k-choix+.5,pch=21,cex=4,bg=2,xpd=NA)
title('aic',line=2)
par(mar=c(3,0,0,0))
plot(0,axes=F,xlab='',ylab='',xlim=range(ticks),ylim=c(.1,1))
rect(xleft = min(ticks) + (0:49)/50*(max(ticks)-min(ticks)),
xright = min(ticks) + (1:50)/50*(max(ticks)-min(ticks)),
ytop = rep(1,50),
ybottom= rep(0,50),col=couleurs,border=NA)
axis(1,ticks)
rect(xleft=min(ticks),xright=max(ticks),ytop=1,ybottom=0)
text(mean(coeff,na.rm=T),.5,'coefficients',cex=2,font=2)
par(mar=c(1,1,3,1))
image(1:n,1:k,t(coeff[k:1,]),axes=F,col=couleurs,zlim=range(ticks))
for(i in 1:n) for(j in 1:k) if(!is.na(coeff[j,i])) {
if(pval[j,i]<.01) symb = 'green'
else if( (pval[j,i]<.05) & (pval[j,i]>=.01)) symb = 'orange'
else if( (pval[j,i]<.1) & (pval[j,i]>=.05)) symb = 'red'
else symb = 'black'
polygon(c(i+.5 ,i+.2 ,i+.5 ,i+.5),
c(k-j+0.5,k-j+0.5,k-j+0.8,k-j+0.5),
col=symb)
if(j==choix) {
rect(xleft=i-.5,
xright=i+.5,
ybottom=k-j+1.5,
ytop=k-j+.5,
lwd=4)
text(i,
k-j+1,
round(coeff[j,i],2),
cex=1.2,
font=2)
}
else{
rect(xleft=i-.5,xright=i+.5,ybottom=k-j+1.5,ytop=k-j+.5)
text(i,k-j+1,round(coeff[j,i],2),cex=1.2,font=1)
}
}
axis(3,1:n,noms)
par(mar=c(0.5,0,0,0.5))
plot(0,axes=F,xlab='',ylab='',type='n',xlim=c(0,8),ylim=c(-.2,.8))
cols <- c('green','orange','red','black')
niv <- c('0','0.01','0.05','0.1')
for(i in 0:3){
polygon(c(1+2*i ,1+2*i ,1+2*i-.5 ,1+2*i),
c(.4 ,.7 , .4 , .4),
col=cols[i+1])
text(2*i,0.5,niv[i+1],cex=1.5)
}
text(8,.5,1,cex=1.5)
text(4,0,'p-value',cex=2)
box()
residus <- arimaSelect.out[[3]][[choix]]$res
par(mar=c(1,2,4,1))
acf(residus,main='')
title('acf',line=.5)
par(mar=c(1,2,4,1))
pacf(residus,main='')
title('pacf',line=.5)
par(mar=c(2,2,4,1))
qqnorm(residus,main='')
title('qq-norm',line=.5)
residus
}
if (par2 == 0) x <- log(x)
if (par2 != 0) x <- x^par2
(selection <- arimaSelect(x, order=c(par6,par3,par7), seasonal=list(order=c(par8,par4,par9), period=par5)))
bitmap(file='test1.png')
resid <- arimaSelectplot(selection)
dev.off()
resid
bitmap(file='test2.png')
acf(resid,length(resid)/2, main='Residual Autocorrelation Function')
dev.off()
bitmap(file='test3.png')
pacf(resid,length(resid)/2, main='Residual Partial Autocorrelation Function')
dev.off()
bitmap(file='test4.png')
cpgram(resid, main='Residual Cumulative Periodogram')
dev.off()
bitmap(file='test5.png')
hist(resid, main='Residual Histogram', xlab='values of Residuals')
dev.off()
bitmap(file='test6.png')
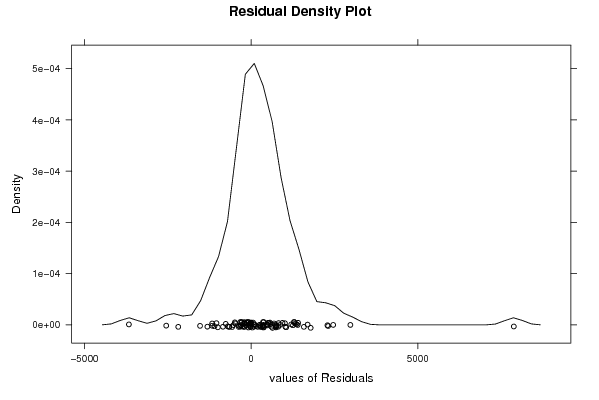
densityplot(~resid,col='black',main='Residual Density Plot', xlab='values of Residuals')
dev.off()
bitmap(file='test7.png')
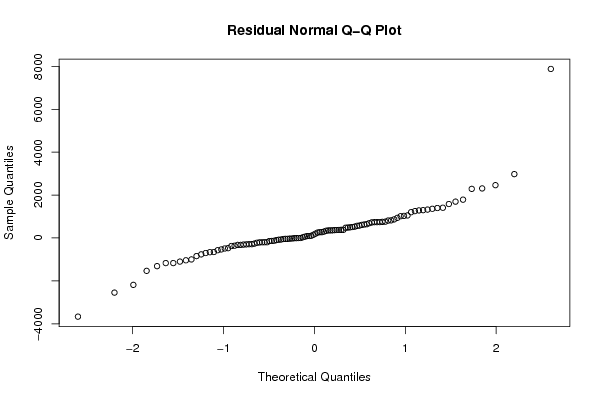
qqnorm(resid, main='Residual Normal Q-Q Plot')
dev.off()
ncols <- length(selection[[1]][1,])
nrows <- length(selection[[2]][,1])-1
load(file='createtable')
a<-table.start()
a<-table.row.start(a)
a<-table.element(a,'ARIMA Parameter Estimation and Backward Selection', ncols+1,TRUE)
a<-table.row.end(a)
a<-table.row.start(a)
a<-table.element(a,'Iteration', header=TRUE)
for (i in 1:ncols) {
a<-table.element(a,names(selection[[3]][[1]]$coef)[i],header=TRUE)
}
a<-table.row.end(a)
for (j in 1:nrows) {
a<-table.row.start(a)
mydum <- 'Estimates ('
mydum <- paste(mydum,j)
mydum <- paste(mydum,')')
a<-table.element(a,mydum, header=TRUE)
for (i in 1:ncols) {
a<-table.element(a,round(selection[[1]][j,i],4))
}
a<-table.row.end(a)
a<-table.row.start(a)
a<-table.element(a,'(p-val)', header=TRUE)
for (i in 1:ncols) {
mydum <- '('
mydum <- paste(mydum,round(selection[[2]][j,i],4),sep='')
mydum <- paste(mydum,')')
a<-table.element(a,mydum)
}
a<-table.row.end(a)
}
a<-table.end(a)
table.save(a,file='mytable.tab')
a<-table.start()
a<-table.row.start(a)
a<-table.element(a,'Estimated ARIMA Residuals', 1,TRUE)
a<-table.row.end(a)
a<-table.row.start(a)
a<-table.element(a,'Value', 1,TRUE)
a<-table.row.end(a)
for (i in (par4*par5+par3):length(resid)) {
a<-table.row.start(a)
a<-table.element(a,resid[i])
a<-table.row.end(a)
}
a<-table.end(a)
table.save(a,file='mytable1.tab')