Free Statistics

of Irreproducible Research!

Author's title

Author*Unverified author*
R Software Modulerwasp_autocorrelation.wasp
Title produced by software(Partial) Autocorrelation Function
Date of computationFri, 07 Dec 2007 04:33:27 -0700
Cite this page as followsStatistical Computations at FreeStatistics.org, Office for Research Development and Education, URL https://freestatistics.org/blog/index.php?v=date/2007/Dec/07/t1197026437icf39jpwmkkitj5.htm/, Retrieved Mon, 29 Apr 2024 06:42:50 +0000
Statistical Computations at FreeStatistics.org, Office for Research Development and Education, URL https://freestatistics.org/blog/index.php?pk=2756, Retrieved Mon, 29 Apr 2024 06:42:50 +0000
QR Codes:

Original text written by user:
IsPrivate?No (this computation is public)
User-defined keywords
Estimated Impact224
Family? (F = Feedback message, R = changed R code, M = changed R Module, P = changed Parameters, D = changed Data)
-       [(Partial) Autocorrelation Function] [paper olieprijzen...] [2007-12-07 11:33:27] [e24e91da8d334fb8882bf413603fde71] [Current]
Feedback Forum

Post a new message
Dataseries X:
87.0
96.3
107.1
115.2
106.1
89.5
91.3
97.6
100.7
104.6
94.7
101.8
102.5
105.3
110.3
109.8
117.3
118.8
131.3
125.9
133.1
147.0
145.8
164.4
149.8
137.7
151.7
156.8
180.0
180.4
170.4
191.6
199.5
218.2
217.5
205.0
194.0
199.3
219.3
211.1
215.2
240.2
242.2
240.7
255.4
253.0
218.2
203.7
205.6
215.6
188.5
202.9
214.0
230.3
230.0
241.0
259.6
247.8
270.3
289.7


Summary of compuational transaction
Raw Inputview raw input (R code)
Raw Outputview raw output of R engine
Computing time2 seconds
R Server'Gwilym Jenkins' @ 72.249.127.135

\begin{tabular}{lllllllll}
\hline
Summary of compuational transaction \tabularnewline
Raw Input & view raw input (R code)  \tabularnewline
Raw Output & view raw output of R engine  \tabularnewline
Computing time & 2 seconds \tabularnewline
R Server & 'Gwilym Jenkins' @ 72.249.127.135 \tabularnewline
\hline
\end{tabular}
%Source: https://freestatistics.org/blog/index.php?pk=2756&T=0

[TABLE]
[ROW][C]Summary of compuational transaction[/C][/ROW]
[ROW][C]Raw Input[/C][C]view raw input (R code) [/C][/ROW]
[ROW][C]Raw Output[/C][C]view raw output of R engine [/C][/ROW]
[ROW][C]Computing time[/C][C]2 seconds[/C][/ROW]
[ROW][C]R Server[/C][C]'Gwilym Jenkins' @ 72.249.127.135[/C][/ROW]
[/TABLE]
Source: https://freestatistics.org/blog/index.php?pk=2756&T=0

Globally Unique Identifier (entire table): ba.freestatistics.org/blog/index.php?pk=2756&T=0

As an alternative you can also use a QR Code:  

The GUIDs for individual cells are displayed in the table below:

Summary of compuational transaction
Raw Inputview raw input (R code)
Raw Outputview raw output of R engine
Computing time2 seconds
R Server'Gwilym Jenkins' @ 72.249.127.135


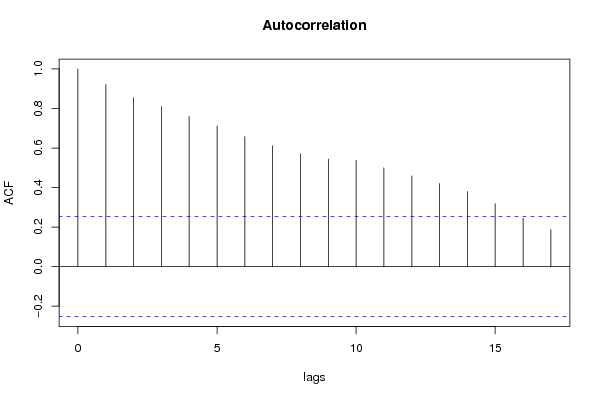
Autocorrelation Function
Time lag kACF(k)T-STATP-value
017.7460
10.9208427.13280
20.8539246.61450
30.8104976.27810
40.7589395.87870
50.7109425.50690
60.657695.09442e-06
70.6110074.73287e-06
80.570894.42212.1e-05
90.5444554.21734.2e-05
100.538264.16935e-05
110.499583.86970.000136
120.458933.55490.000372
130.4200113.25340.000937
140.3799492.94310.002308
150.3182452.46510.008288
160.2452841.90.031124

\begin{tabular}{lllllllll}
\hline
Autocorrelation Function \tabularnewline
Time lag k & ACF(k) & T-STAT & P-value \tabularnewline
0 & 1 & 7.746 & 0 \tabularnewline
1 & 0.920842 & 7.1328 & 0 \tabularnewline
2 & 0.853924 & 6.6145 & 0 \tabularnewline
3 & 0.810497 & 6.2781 & 0 \tabularnewline
4 & 0.758939 & 5.8787 & 0 \tabularnewline
5 & 0.710942 & 5.5069 & 0 \tabularnewline
6 & 0.65769 & 5.0944 & 2e-06 \tabularnewline
7 & 0.611007 & 4.7328 & 7e-06 \tabularnewline
8 & 0.57089 & 4.4221 & 2.1e-05 \tabularnewline
9 & 0.544455 & 4.2173 & 4.2e-05 \tabularnewline
10 & 0.53826 & 4.1693 & 5e-05 \tabularnewline
11 & 0.49958 & 3.8697 & 0.000136 \tabularnewline
12 & 0.45893 & 3.5549 & 0.000372 \tabularnewline
13 & 0.420011 & 3.2534 & 0.000937 \tabularnewline
14 & 0.379949 & 2.9431 & 0.002308 \tabularnewline
15 & 0.318245 & 2.4651 & 0.008288 \tabularnewline
16 & 0.245284 & 1.9 & 0.031124 \tabularnewline
\hline
\end{tabular}
%Source: https://freestatistics.org/blog/index.php?pk=2756&T=1

[TABLE]
[ROW][C]Autocorrelation Function[/C][/ROW]
[ROW][C]Time lag k[/C][C]ACF(k)[/C][C]T-STAT[/C][C]P-value[/C][/ROW]
[ROW][C]0[/C][C]1[/C][C]7.746[/C][C]0[/C][/ROW]
[ROW][C]1[/C][C]0.920842[/C][C]7.1328[/C][C]0[/C][/ROW]
[ROW][C]2[/C][C]0.853924[/C][C]6.6145[/C][C]0[/C][/ROW]
[ROW][C]3[/C][C]0.810497[/C][C]6.2781[/C][C]0[/C][/ROW]
[ROW][C]4[/C][C]0.758939[/C][C]5.8787[/C][C]0[/C][/ROW]
[ROW][C]5[/C][C]0.710942[/C][C]5.5069[/C][C]0[/C][/ROW]
[ROW][C]6[/C][C]0.65769[/C][C]5.0944[/C][C]2e-06[/C][/ROW]
[ROW][C]7[/C][C]0.611007[/C][C]4.7328[/C][C]7e-06[/C][/ROW]
[ROW][C]8[/C][C]0.57089[/C][C]4.4221[/C][C]2.1e-05[/C][/ROW]
[ROW][C]9[/C][C]0.544455[/C][C]4.2173[/C][C]4.2e-05[/C][/ROW]
[ROW][C]10[/C][C]0.53826[/C][C]4.1693[/C][C]5e-05[/C][/ROW]
[ROW][C]11[/C][C]0.49958[/C][C]3.8697[/C][C]0.000136[/C][/ROW]
[ROW][C]12[/C][C]0.45893[/C][C]3.5549[/C][C]0.000372[/C][/ROW]
[ROW][C]13[/C][C]0.420011[/C][C]3.2534[/C][C]0.000937[/C][/ROW]
[ROW][C]14[/C][C]0.379949[/C][C]2.9431[/C][C]0.002308[/C][/ROW]
[ROW][C]15[/C][C]0.318245[/C][C]2.4651[/C][C]0.008288[/C][/ROW]
[ROW][C]16[/C][C]0.245284[/C][C]1.9[/C][C]0.031124[/C][/ROW]
[/TABLE]
Source: https://freestatistics.org/blog/index.php?pk=2756&T=1

Globally Unique Identifier (entire table): ba.freestatistics.org/blog/index.php?pk=2756&T=1

As an alternative you can also use a QR Code:  

The GUIDs for individual cells are displayed in the table below:

Autocorrelation Function
Time lag kACF(k)T-STATP-value
017.7460
10.9208427.13280
20.8539246.61450
30.8104976.27810
40.7589395.87870
50.7109425.50690
60.657695.09442e-06
70.6110074.73287e-06
80.570894.42212.1e-05
90.5444554.21734.2e-05
100.538264.16935e-05
110.499583.86970.000136
120.458933.55490.000372
130.4200113.25340.000937
140.3799492.94310.002308
150.3182452.46510.008288
160.2452841.90.031124


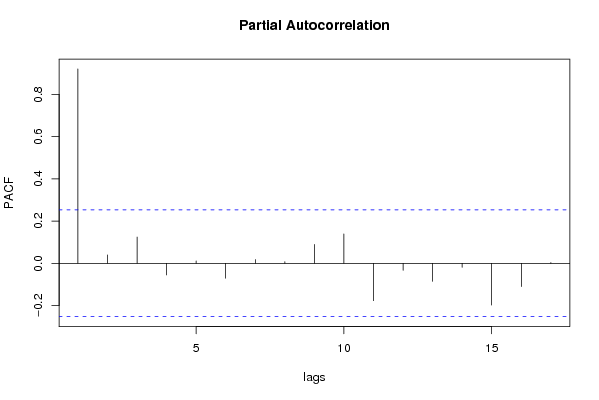
Partial Autocorrelation Function
Time lag kPACF(k)T-STATP-value
00.9208427.13280
10.0392970.30440.380939
20.1243760.96340.169604
3-0.05513-0.4270.664559
40.0112670.08730.465373
5-0.070721-0.54780.707069
60.0174840.13540.446362
70.0072640.05630.477658
80.089420.69260.245601
90.1389131.0760.143114
10-0.177517-1.3750.912884
11-0.033405-0.25880.601644
12-0.085487-0.66220.744805
13-0.019168-0.14850.558768
14-0.198329-1.53630.935133
15-0.110476-0.85570.802229
160.0031410.02430.490336

\begin{tabular}{lllllllll}
\hline
Partial Autocorrelation Function \tabularnewline
Time lag k & PACF(k) & T-STAT & P-value \tabularnewline
0 & 0.920842 & 7.1328 & 0 \tabularnewline
1 & 0.039297 & 0.3044 & 0.380939 \tabularnewline
2 & 0.124376 & 0.9634 & 0.169604 \tabularnewline
3 & -0.05513 & -0.427 & 0.664559 \tabularnewline
4 & 0.011267 & 0.0873 & 0.465373 \tabularnewline
5 & -0.070721 & -0.5478 & 0.707069 \tabularnewline
6 & 0.017484 & 0.1354 & 0.446362 \tabularnewline
7 & 0.007264 & 0.0563 & 0.477658 \tabularnewline
8 & 0.08942 & 0.6926 & 0.245601 \tabularnewline
9 & 0.138913 & 1.076 & 0.143114 \tabularnewline
10 & -0.177517 & -1.375 & 0.912884 \tabularnewline
11 & -0.033405 & -0.2588 & 0.601644 \tabularnewline
12 & -0.085487 & -0.6622 & 0.744805 \tabularnewline
13 & -0.019168 & -0.1485 & 0.558768 \tabularnewline
14 & -0.198329 & -1.5363 & 0.935133 \tabularnewline
15 & -0.110476 & -0.8557 & 0.802229 \tabularnewline
16 & 0.003141 & 0.0243 & 0.490336 \tabularnewline
\hline
\end{tabular}
%Source: https://freestatistics.org/blog/index.php?pk=2756&T=2

[TABLE]
[ROW][C]Partial Autocorrelation Function[/C][/ROW]
[ROW][C]Time lag k[/C][C]PACF(k)[/C][C]T-STAT[/C][C]P-value[/C][/ROW]
[ROW][C]0[/C][C]0.920842[/C][C]7.1328[/C][C]0[/C][/ROW]
[ROW][C]1[/C][C]0.039297[/C][C]0.3044[/C][C]0.380939[/C][/ROW]
[ROW][C]2[/C][C]0.124376[/C][C]0.9634[/C][C]0.169604[/C][/ROW]
[ROW][C]3[/C][C]-0.05513[/C][C]-0.427[/C][C]0.664559[/C][/ROW]
[ROW][C]4[/C][C]0.011267[/C][C]0.0873[/C][C]0.465373[/C][/ROW]
[ROW][C]5[/C][C]-0.070721[/C][C]-0.5478[/C][C]0.707069[/C][/ROW]
[ROW][C]6[/C][C]0.017484[/C][C]0.1354[/C][C]0.446362[/C][/ROW]
[ROW][C]7[/C][C]0.007264[/C][C]0.0563[/C][C]0.477658[/C][/ROW]
[ROW][C]8[/C][C]0.08942[/C][C]0.6926[/C][C]0.245601[/C][/ROW]
[ROW][C]9[/C][C]0.138913[/C][C]1.076[/C][C]0.143114[/C][/ROW]
[ROW][C]10[/C][C]-0.177517[/C][C]-1.375[/C][C]0.912884[/C][/ROW]
[ROW][C]11[/C][C]-0.033405[/C][C]-0.2588[/C][C]0.601644[/C][/ROW]
[ROW][C]12[/C][C]-0.085487[/C][C]-0.6622[/C][C]0.744805[/C][/ROW]
[ROW][C]13[/C][C]-0.019168[/C][C]-0.1485[/C][C]0.558768[/C][/ROW]
[ROW][C]14[/C][C]-0.198329[/C][C]-1.5363[/C][C]0.935133[/C][/ROW]
[ROW][C]15[/C][C]-0.110476[/C][C]-0.8557[/C][C]0.802229[/C][/ROW]
[ROW][C]16[/C][C]0.003141[/C][C]0.0243[/C][C]0.490336[/C][/ROW]
[/TABLE]
Source: https://freestatistics.org/blog/index.php?pk=2756&T=2

Globally Unique Identifier (entire table): ba.freestatistics.org/blog/index.php?pk=2756&T=2

As an alternative you can also use a QR Code:  

The GUIDs for individual cells are displayed in the table below:

Partial Autocorrelation Function
Time lag kPACF(k)T-STATP-value
00.9208427.13280
10.0392970.30440.380939
20.1243760.96340.169604
3-0.05513-0.4270.664559
40.0112670.08730.465373
5-0.070721-0.54780.707069
60.0174840.13540.446362
70.0072640.05630.477658
80.089420.69260.245601
90.1389131.0760.143114
10-0.177517-1.3750.912884
11-0.033405-0.25880.601644
12-0.085487-0.66220.744805
13-0.019168-0.14850.558768
14-0.198329-1.53630.935133
15-0.110476-0.85570.802229
160.0031410.02430.490336


Parameters (Session):
par1 = Default ; par2 = 1 ; par3 = 1 ; par4 = 0 ; par5 = 12 ;
Parameters (R input):
par1 = Default ; par2 = 1 ; par3 = 0 ; par4 = 0 ; par5 = 12 ;
R code (references can be found in the software module):
if (par1 == 'Default') {
par1 = 10*log10(length(x))
} else {
par1 <- as.numeric(par1)
}
par2 <- as.numeric(par2)
par3 <- as.numeric(par3)
par4 <- as.numeric(par4)
par5 <- as.numeric(par5)
if (par2 == 0) {
x <- log(x)
} else {
x <- (x ^ par2 - 1) / par2
}
if (par3 > 0) x <- diff(x,lag=1,difference=par3)
if (par4 > 0) x <- diff(x,lag=par5,difference=par4)
bitmap(file='pic1.png')
racf <- acf(x,par1,main='Autocorrelation',xlab='lags',ylab='ACF')
dev.off()
bitmap(file='pic2.png')
rpacf <- pacf(x,par1,main='Partial Autocorrelation',xlab='lags',ylab='PACF')
dev.off()
(myacf <- c(racf$acf))
(mypacf <- c(rpacf$acf))
lengthx <- length(x)
sqrtn <- sqrt(lengthx)
load(file='createtable')
a<-table.start()
a<-table.row.start(a)
a<-table.element(a,'Autocorrelation Function',4,TRUE)
a<-table.row.end(a)
a<-table.row.start(a)
a<-table.element(a,'Time lag k',header=TRUE)
a<-table.element(a,hyperlink('basics.htm','ACF(k)','click here for more information about the Autocorrelation Function'),header=TRUE)
a<-table.element(a,'T-STAT',header=TRUE)
a<-table.element(a,'P-value',header=TRUE)
a<-table.row.end(a)
for (i in 1:par1) {
a<-table.row.start(a)
a<-table.element(a,i-1,header=TRUE)
a<-table.element(a,round(myacf[i],6))
mytstat <- myacf[i]*sqrtn
a<-table.element(a,round(mytstat,4))
a<-table.element(a,round(1-pt(mytstat,lengthx),6))
a<-table.row.end(a)
}
a<-table.end(a)
table.save(a,file='mytable.tab')
a<-table.start()
a<-table.row.start(a)
a<-table.element(a,'Partial Autocorrelation Function',4,TRUE)
a<-table.row.end(a)
a<-table.row.start(a)
a<-table.element(a,'Time lag k',header=TRUE)
a<-table.element(a,hyperlink('basics.htm','PACF(k)','click here for more information about the Partial Autocorrelation Function'),header=TRUE)
a<-table.element(a,'T-STAT',header=TRUE)
a<-table.element(a,'P-value',header=TRUE)
a<-table.row.end(a)
for (i in 1:par1) {
a<-table.row.start(a)
a<-table.element(a,i-1,header=TRUE)
a<-table.element(a,round(mypacf[i],6))
mytstat <- mypacf[i]*sqrtn
a<-table.element(a,round(mytstat,4))
a<-table.element(a,round(1-pt(mytstat,lengthx),6))
a<-table.row.end(a)
}
a<-table.end(a)
table.save(a,file='mytable1.tab')