Free Statistics

of Irreproducible Research!

Author's title

Author*Unverified author*
R Software Modulerwasp_tukeylambda.wasp
Title produced by softwareTukey lambda PPCC Plot
Date of computationFri, 07 Dec 2007 04:05:04 -0700
Cite this page as followsStatistical Computations at FreeStatistics.org, Office for Research Development and Education, URL https://freestatistics.org/blog/index.php?v=date/2007/Dec/07/t1197024744sl79aj0itw7g4ly.htm/, Retrieved Sun, 28 Apr 2024 23:08:20 +0000
Statistical Computations at FreeStatistics.org, Office for Research Development and Education, URL https://freestatistics.org/blog/index.php?pk=2744, Retrieved Sun, 28 Apr 2024 23:08:20 +0000
QR Codes:

Original text written by user:
IsPrivate?No (this computation is public)
User-defined keywordsplot - vertrouwen
Estimated Impact207
Family? (F = Feedback message, R = changed R code, M = changed R Module, P = changed Parameters, D = changed Data)
-       [Tukey lambda PPCC Plot] [investigating dis...] [2007-12-07 11:05:04] [ac6f409873aab27747ac7f3d36ded223] [Current]
Feedback Forum

Post a new message
Dataseries X:
96
86
82
92
99
101
102
100
101
100
99
97
97
97
96
92
91
87
82
89
91
90
87
89
95
85
94
94
97
99
97
96
94
100
96
98
98
94
93
94
94
97
98
95
89
89
89
90
86
92
91
95
99
98
95
96
94
98
98
98
98
102
101
92
99
101
99
102
102
101
99
98
98


Summary of compuational transaction
Raw Inputview raw input (R code)
Raw Outputview raw output of R engine
Computing time1 seconds
R Server'Gwilym Jenkins' @ 72.249.127.135

\begin{tabular}{lllllllll}
\hline
Summary of compuational transaction \tabularnewline
Raw Input & view raw input (R code)  \tabularnewline
Raw Output & view raw output of R engine  \tabularnewline
Computing time & 1 seconds \tabularnewline
R Server & 'Gwilym Jenkins' @ 72.249.127.135 \tabularnewline
\hline
\end{tabular}
%Source: https://freestatistics.org/blog/index.php?pk=2744&T=0

[TABLE]
[ROW][C]Summary of compuational transaction[/C][/ROW]
[ROW][C]Raw Input[/C][C]view raw input (R code) [/C][/ROW]
[ROW][C]Raw Output[/C][C]view raw output of R engine [/C][/ROW]
[ROW][C]Computing time[/C][C]1 seconds[/C][/ROW]
[ROW][C]R Server[/C][C]'Gwilym Jenkins' @ 72.249.127.135[/C][/ROW]
[/TABLE]
Source: https://freestatistics.org/blog/index.php?pk=2744&T=0

Globally Unique Identifier (entire table): ba.freestatistics.org/blog/index.php?pk=2744&T=0

As an alternative you can also use a QR Code:  

The GUIDs for individual cells are displayed in the table below:

Summary of compuational transaction
Raw Inputview raw input (R code)
Raw Outputview raw output of R engine
Computing time1 seconds
R Server'Gwilym Jenkins' @ 72.249.127.135


Tukey Lambda - Key Values
Distribution (lambda)Correlation
Approx. Cauchy (lambda=-1)0.624724199911769
Exact Logistic (lambda=0)0.96345749898816
Approx. Normal (lambda=0.14)0.970507247887155
U-shaped (lambda=0.5)0.970328206299332
Exactly Uniform (lambda=1)0.962624895446433

\begin{tabular}{lllllllll}
\hline
Tukey Lambda - Key Values \tabularnewline
Distribution (lambda) & Correlation \tabularnewline
Approx. Cauchy (lambda=-1) & 0.624724199911769 \tabularnewline
Exact Logistic (lambda=0) & 0.96345749898816 \tabularnewline
Approx. Normal (lambda=0.14) & 0.970507247887155 \tabularnewline
U-shaped (lambda=0.5) & 0.970328206299332 \tabularnewline
Exactly Uniform (lambda=1) & 0.962624895446433 \tabularnewline
\hline
\end{tabular}
%Source: https://freestatistics.org/blog/index.php?pk=2744&T=1

[TABLE]
[ROW][C]Tukey Lambda - Key Values[/C][/ROW]
[ROW][C]Distribution (lambda)[/C][C]Correlation[/C][/ROW]
[ROW][C]Approx. Cauchy (lambda=-1)[/C][C]0.624724199911769[/C][/ROW]
[ROW][C]Exact Logistic (lambda=0)[/C][C]0.96345749898816[/C][/ROW]
[ROW][C]Approx. Normal (lambda=0.14)[/C][C]0.970507247887155[/C][/ROW]
[ROW][C]U-shaped (lambda=0.5)[/C][C]0.970328206299332[/C][/ROW]
[ROW][C]Exactly Uniform (lambda=1)[/C][C]0.962624895446433[/C][/ROW]
[/TABLE]
Source: https://freestatistics.org/blog/index.php?pk=2744&T=1

Globally Unique Identifier (entire table): ba.freestatistics.org/blog/index.php?pk=2744&T=1

As an alternative you can also use a QR Code:  

The GUIDs for individual cells are displayed in the table below:

Tukey Lambda - Key Values
Distribution (lambda)Correlation
Approx. Cauchy (lambda=-1)0.624724199911769
Exact Logistic (lambda=0)0.96345749898816
Approx. Normal (lambda=0.14)0.970507247887155
U-shaped (lambda=0.5)0.970328206299332
Exactly Uniform (lambda=1)0.962624895446433


Parameters (Session):
Parameters (R input):
R code (references can be found in the software module):
gp <- function(lambda, p)
{
(p^lambda-(1-p)^lambda)/lambda
}
sortx <- sort(x)
c <- array(NA,dim=c(201))
for (i in 1:201)
{
if (i != 101) c[i] <- cor(gp(ppoints(x), lambda=(i-101)/100),sortx)
}
bitmap(file='test1.png')
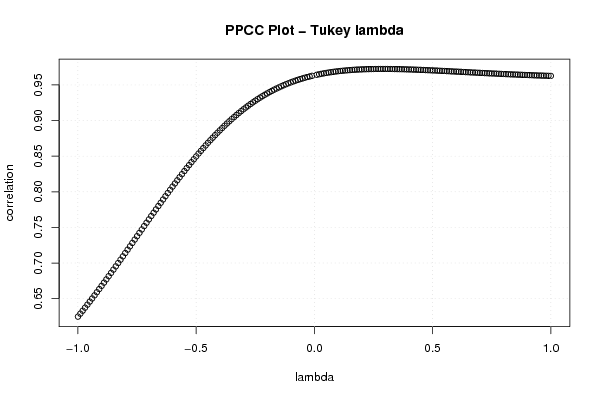
plot((-100:100)/100,c[1:201],xlab='lambda',ylab='correlation',main='PPCC Plot - Tukey lambda')
grid()
dev.off()
load(file='createtable')
a<-table.start()
a<-table.row.start(a)
a<-table.element(a,'Tukey Lambda - Key Values',2,TRUE)
a<-table.row.end(a)
a<-table.row.start(a)
a<-table.element(a,'Distribution (lambda)',1,TRUE)
a<-table.element(a,'Correlation',1,TRUE)
a<-table.row.end(a)
a<-table.row.start(a)
a<-table.element(a,'Approx. Cauchy (lambda=-1)',header=TRUE)
a<-table.element(a,c[1])
a<-table.row.end(a)
a<-table.row.start(a)
a<-table.element(a,'Exact Logistic (lambda=0)',header=TRUE)
a<-table.element(a,(c[100]+c[102])/2)
a<-table.row.end(a)
a<-table.row.start(a)
a<-table.element(a,'Approx. Normal (lambda=0.14)',header=TRUE)
a<-table.element(a,c[115])
a<-table.row.end(a)
a<-table.row.start(a)
a<-table.element(a,'U-shaped (lambda=0.5)',header=TRUE)
a<-table.element(a,c[151])
a<-table.row.end(a)
a<-table.row.start(a)
a<-table.element(a,'Exactly Uniform (lambda=1)',header=TRUE)
a<-table.element(a,c[201])
a<-table.row.end(a)
a<-table.end(a)
table.save(a,file='mytable.tab')