Free Statistics

of Irreproducible Research!

Author's title

Author*Unverified author*
R Software Modulerwasp_multipleregression.wasp
Title produced by softwareMultiple Regression
Date of computationFri, 07 Dec 2007 04:03:33 -0700
Cite this page as followsStatistical Computations at FreeStatistics.org, Office for Research Development and Education, URL https://freestatistics.org/blog/index.php?v=date/2007/Dec/07/t1197024689216oxf1tv50llon.htm/, Retrieved Sun, 28 Apr 2024 19:06:18 +0000
Statistical Computations at FreeStatistics.org, Office for Research Development and Education, URL https://freestatistics.org/blog/index.php?pk=2743, Retrieved Sun, 28 Apr 2024 19:06:18 +0000
QR Codes:

Original text written by user:
IsPrivate?No (this computation is public)
User-defined keywordsolieprijs vs war
Estimated Impact228
Family? (F = Feedback message, R = changed R code, M = changed R Module, P = changed Parameters, D = changed Data)
-       [Multiple Regression] [paper] [2007-12-07 11:03:33] [e24e91da8d334fb8882bf413603fde71] [Current]
Feedback Forum

Post a new message
Dataseries X:
87,0	0
96,3	0
107,1	0
115,2	0
106,1	1
89,5	1
91,3	1
97,6	1
100,7	1
104,6	1
94,7	1
101,8	1
102,5	1
105,3	1
110,3	1
109,8	1
117,3	1
118,8	1
131,3	1
125,9	1
133,1	1
147,0	1
145,8	1
164,4	1
149,8	1
137,7	1
151,7	1
156,8	1
180,0	1
180,4	1
170,4	1
191,6	1
199,5	1
218,2	1
217,5	1
205,0	1
194,0	1
199,3	1
219,3	1
211,1	1
215,2	1
240,2	1
242,2	1
240,7	1
255,4	1
253,0	1
218,2	1
203,7	1
205,6	1
215,6	1
188,5	1
202,9	1
214,0	1
230,3	1
230,0	1
241,0	1
259,6	1
247,8	1
270,3	1
289,7	1


Summary of compuational transaction
Raw Inputview raw input (R code)
Raw Outputview raw output of R engine
Computing time3 seconds
R Server'Gwilym Jenkins' @ 72.249.127.135

\begin{tabular}{lllllllll}
\hline
Summary of compuational transaction \tabularnewline
Raw Input & view raw input (R code)  \tabularnewline
Raw Output & view raw output of R engine  \tabularnewline
Computing time & 3 seconds \tabularnewline
R Server & 'Gwilym Jenkins' @ 72.249.127.135 \tabularnewline
\hline
\end{tabular}
%Source: https://freestatistics.org/blog/index.php?pk=2743&T=0

[TABLE]
[ROW][C]Summary of compuational transaction[/C][/ROW]
[ROW][C]Raw Input[/C][C]view raw input (R code) [/C][/ROW]
[ROW][C]Raw Output[/C][C]view raw output of R engine [/C][/ROW]
[ROW][C]Computing time[/C][C]3 seconds[/C][/ROW]
[ROW][C]R Server[/C][C]'Gwilym Jenkins' @ 72.249.127.135[/C][/ROW]
[/TABLE]
Source: https://freestatistics.org/blog/index.php?pk=2743&T=0

Globally Unique Identifier (entire table): ba.freestatistics.org/blog/index.php?pk=2743&T=0

As an alternative you can also use a QR Code:  

The GUIDs for individual cells are displayed in the table below:

Summary of compuational transaction
Raw Inputview raw input (R code)
Raw Outputview raw output of R engine
Computing time3 seconds
R Server'Gwilym Jenkins' @ 72.249.127.135


Multiple Linear Regression - Estimated Regression Equation
prijs/olie[t] = + 128.0575 + 64.8625`war? `[t] -32.1675000000001M1[t] -29.1075000000001M2[t] -24.5675000000001M3[t] -20.7875000000000M4[t] -26.4000000000001M5[t] -21.0800000000000M6[t] -19.8800000000000M7[t] -13.5600000000000M8[t] -3.26000000000002M9[t] + 1.19999999999995M10[t] -3.62000000000005M11[t] + e[t]

\begin{tabular}{lllllllll}
\hline
Multiple Linear Regression - Estimated Regression Equation \tabularnewline
prijs/olie[t] =  +  128.0575 +  64.8625`war?
`[t] -32.1675000000001M1[t] -29.1075000000001M2[t] -24.5675000000001M3[t] -20.7875000000000M4[t] -26.4000000000001M5[t] -21.0800000000000M6[t] -19.8800000000000M7[t] -13.5600000000000M8[t] -3.26000000000002M9[t] +  1.19999999999995M10[t] -3.62000000000005M11[t]  + e[t] \tabularnewline
\hline
\end{tabular}
%Source: https://freestatistics.org/blog/index.php?pk=2743&T=1

[TABLE]
[ROW][C]Multiple Linear Regression - Estimated Regression Equation[/C][/ROW]
[ROW][C]prijs/olie[t] =  +  128.0575 +  64.8625`war?
`[t] -32.1675000000001M1[t] -29.1075000000001M2[t] -24.5675000000001M3[t] -20.7875000000000M4[t] -26.4000000000001M5[t] -21.0800000000000M6[t] -19.8800000000000M7[t] -13.5600000000000M8[t] -3.26000000000002M9[t] +  1.19999999999995M10[t] -3.62000000000005M11[t]  + e[t][/C][/ROW]
[/TABLE]
Source: https://freestatistics.org/blog/index.php?pk=2743&T=1

Globally Unique Identifier (entire table): ba.freestatistics.org/blog/index.php?pk=2743&T=1

As an alternative you can also use a QR Code:  

The GUIDs for individual cells are displayed in the table below:

Multiple Linear Regression - Estimated Regression Equation
prijs/olie[t] = + 128.0575 + 64.8625`war? `[t] -32.1675000000001M1[t] -29.1075000000001M2[t] -24.5675000000001M3[t] -20.7875000000000M4[t] -26.4000000000001M5[t] -21.0800000000000M6[t] -19.8800000000000M7[t] -13.5600000000000M8[t] -3.26000000000002M9[t] + 1.19999999999995M10[t] -3.62000000000005M11[t] + e[t]


Multiple Linear Regression - Ordinary Least Squares
VariableParameterS.D.T-STATH0: parameter = 02-tail p-value1-tail p-value
(Intercept)128.057542.5178113.01190.0041710.002085
`war? `64.862533.2008331.95360.056710.028355
M1-32.167500000000138.144853-0.84330.4033330.201666
M2-29.107500000000138.144853-0.76310.449230.224615
M3-24.567500000000138.144853-0.64410.5226690.261334
M4-20.787500000000038.144853-0.5450.5883560.294178
M5-26.400000000000137.562454-0.70280.4856290.242814
M6-21.080000000000037.562454-0.56120.5773280.288664
M7-19.880000000000037.562454-0.52930.5991220.299561
M8-13.560000000000037.562454-0.3610.7197180.359859
M9-3.2600000000000237.562454-0.08680.9312080.465604
M101.1999999999999537.5624540.03190.974650.487325
M11-3.6200000000000537.562454-0.09640.9236340.461817

\begin{tabular}{lllllllll}
\hline
Multiple Linear Regression - Ordinary Least Squares \tabularnewline
Variable & Parameter & S.D. & T-STATH0: parameter = 0 & 2-tail p-value & 1-tail p-value \tabularnewline
(Intercept) & 128.0575 & 42.517811 & 3.0119 & 0.004171 & 0.002085 \tabularnewline
`war?
` & 64.8625 & 33.200833 & 1.9536 & 0.05671 & 0.028355 \tabularnewline
M1 & -32.1675000000001 & 38.144853 & -0.8433 & 0.403333 & 0.201666 \tabularnewline
M2 & -29.1075000000001 & 38.144853 & -0.7631 & 0.44923 & 0.224615 \tabularnewline
M3 & -24.5675000000001 & 38.144853 & -0.6441 & 0.522669 & 0.261334 \tabularnewline
M4 & -20.7875000000000 & 38.144853 & -0.545 & 0.588356 & 0.294178 \tabularnewline
M5 & -26.4000000000001 & 37.562454 & -0.7028 & 0.485629 & 0.242814 \tabularnewline
M6 & -21.0800000000000 & 37.562454 & -0.5612 & 0.577328 & 0.288664 \tabularnewline
M7 & -19.8800000000000 & 37.562454 & -0.5293 & 0.599122 & 0.299561 \tabularnewline
M8 & -13.5600000000000 & 37.562454 & -0.361 & 0.719718 & 0.359859 \tabularnewline
M9 & -3.26000000000002 & 37.562454 & -0.0868 & 0.931208 & 0.465604 \tabularnewline
M10 & 1.19999999999995 & 37.562454 & 0.0319 & 0.97465 & 0.487325 \tabularnewline
M11 & -3.62000000000005 & 37.562454 & -0.0964 & 0.923634 & 0.461817 \tabularnewline
\hline
\end{tabular}
%Source: https://freestatistics.org/blog/index.php?pk=2743&T=2

[TABLE]
[ROW][C]Multiple Linear Regression - Ordinary Least Squares[/C][/ROW]
[ROW][C]Variable[/C][C]Parameter[/C][C]S.D.[/C][C]T-STATH0: parameter = 0[/C][C]2-tail p-value[/C][C]1-tail p-value[/C][/ROW]
[ROW][C](Intercept)[/C][C]128.0575[/C][C]42.517811[/C][C]3.0119[/C][C]0.004171[/C][C]0.002085[/C][/ROW]
[ROW][C]`war?
`[/C][C]64.8625[/C][C]33.200833[/C][C]1.9536[/C][C]0.05671[/C][C]0.028355[/C][/ROW]
[ROW][C]M1[/C][C]-32.1675000000001[/C][C]38.144853[/C][C]-0.8433[/C][C]0.403333[/C][C]0.201666[/C][/ROW]
[ROW][C]M2[/C][C]-29.1075000000001[/C][C]38.144853[/C][C]-0.7631[/C][C]0.44923[/C][C]0.224615[/C][/ROW]
[ROW][C]M3[/C][C]-24.5675000000001[/C][C]38.144853[/C][C]-0.6441[/C][C]0.522669[/C][C]0.261334[/C][/ROW]
[ROW][C]M4[/C][C]-20.7875000000000[/C][C]38.144853[/C][C]-0.545[/C][C]0.588356[/C][C]0.294178[/C][/ROW]
[ROW][C]M5[/C][C]-26.4000000000001[/C][C]37.562454[/C][C]-0.7028[/C][C]0.485629[/C][C]0.242814[/C][/ROW]
[ROW][C]M6[/C][C]-21.0800000000000[/C][C]37.562454[/C][C]-0.5612[/C][C]0.577328[/C][C]0.288664[/C][/ROW]
[ROW][C]M7[/C][C]-19.8800000000000[/C][C]37.562454[/C][C]-0.5293[/C][C]0.599122[/C][C]0.299561[/C][/ROW]
[ROW][C]M8[/C][C]-13.5600000000000[/C][C]37.562454[/C][C]-0.361[/C][C]0.719718[/C][C]0.359859[/C][/ROW]
[ROW][C]M9[/C][C]-3.26000000000002[/C][C]37.562454[/C][C]-0.0868[/C][C]0.931208[/C][C]0.465604[/C][/ROW]
[ROW][C]M10[/C][C]1.19999999999995[/C][C]37.562454[/C][C]0.0319[/C][C]0.97465[/C][C]0.487325[/C][/ROW]
[ROW][C]M11[/C][C]-3.62000000000005[/C][C]37.562454[/C][C]-0.0964[/C][C]0.923634[/C][C]0.461817[/C][/ROW]
[/TABLE]
Source: https://freestatistics.org/blog/index.php?pk=2743&T=2

Globally Unique Identifier (entire table): ba.freestatistics.org/blog/index.php?pk=2743&T=2

As an alternative you can also use a QR Code:  

The GUIDs for individual cells are displayed in the table below:

Multiple Linear Regression - Ordinary Least Squares
VariableParameterS.D.T-STATH0: parameter = 02-tail p-value1-tail p-value
(Intercept)128.057542.5178113.01190.0041710.002085
`war? `64.862533.2008331.95360.056710.028355
M1-32.167500000000138.144853-0.84330.4033330.201666
M2-29.107500000000138.144853-0.76310.449230.224615
M3-24.567500000000138.144853-0.64410.5226690.261334
M4-20.787500000000038.144853-0.5450.5883560.294178
M5-26.400000000000137.562454-0.70280.4856290.242814
M6-21.080000000000037.562454-0.56120.5773280.288664
M7-19.880000000000037.562454-0.52930.5991220.299561
M8-13.560000000000037.562454-0.3610.7197180.359859
M9-3.2600000000000237.562454-0.08680.9312080.465604
M101.1999999999999537.5624540.03190.974650.487325
M11-3.6200000000000537.562454-0.09640.9236340.461817


Multiple Linear Regression - Regression Statistics
Multiple R0.385526675943825
R-squared0.148630817864295
Adjusted R-squared-0.068740037149076
F-TEST (value)0.683766081957732
F-TEST (DF numerator)12
F-TEST (DF denominator)47
p-value0.75815768298169
Multiple Linear Regression - Residual Statistics
Residual Standard Deviation59.3914549874973
Sum Squared Residuals165785.2115

\begin{tabular}{lllllllll}
\hline
Multiple Linear Regression - Regression Statistics \tabularnewline
Multiple R & 0.385526675943825 \tabularnewline
R-squared & 0.148630817864295 \tabularnewline
Adjusted R-squared & -0.068740037149076 \tabularnewline
F-TEST (value) & 0.683766081957732 \tabularnewline
F-TEST (DF numerator) & 12 \tabularnewline
F-TEST (DF denominator) & 47 \tabularnewline
p-value & 0.75815768298169 \tabularnewline
Multiple Linear Regression - Residual Statistics \tabularnewline
Residual Standard Deviation & 59.3914549874973 \tabularnewline
Sum Squared Residuals & 165785.2115 \tabularnewline
\hline
\end{tabular}
%Source: https://freestatistics.org/blog/index.php?pk=2743&T=3

[TABLE]
[ROW][C]Multiple Linear Regression - Regression Statistics[/C][/ROW]
[ROW][C]Multiple R[/C][C]0.385526675943825[/C][/ROW]
[ROW][C]R-squared[/C][C]0.148630817864295[/C][/ROW]
[ROW][C]Adjusted R-squared[/C][C]-0.068740037149076[/C][/ROW]
[ROW][C]F-TEST (value)[/C][C]0.683766081957732[/C][/ROW]
[ROW][C]F-TEST (DF numerator)[/C][C]12[/C][/ROW]
[ROW][C]F-TEST (DF denominator)[/C][C]47[/C][/ROW]
[ROW][C]p-value[/C][C]0.75815768298169[/C][/ROW]
[ROW][C]Multiple Linear Regression - Residual Statistics[/C][/ROW]
[ROW][C]Residual Standard Deviation[/C][C]59.3914549874973[/C][/ROW]
[ROW][C]Sum Squared Residuals[/C][C]165785.2115[/C][/ROW]
[/TABLE]
Source: https://freestatistics.org/blog/index.php?pk=2743&T=3

Globally Unique Identifier (entire table): ba.freestatistics.org/blog/index.php?pk=2743&T=3

As an alternative you can also use a QR Code:  

The GUIDs for individual cells are displayed in the table below:

Multiple Linear Regression - Regression Statistics
Multiple R0.385526675943825
R-squared0.148630817864295
Adjusted R-squared-0.068740037149076
F-TEST (value)0.683766081957732
F-TEST (DF numerator)12
F-TEST (DF denominator)47
p-value0.75815768298169
Multiple Linear Regression - Residual Statistics
Residual Standard Deviation59.3914549874973
Sum Squared Residuals165785.2115


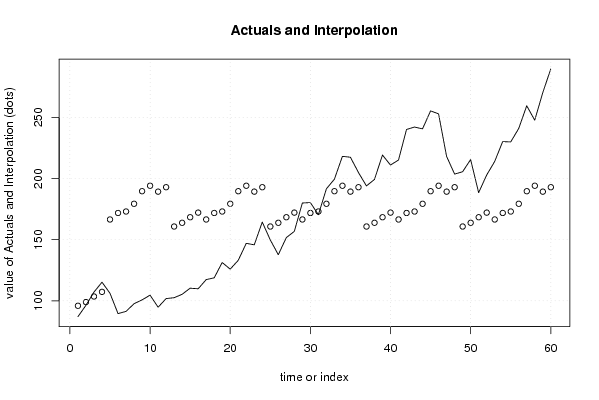
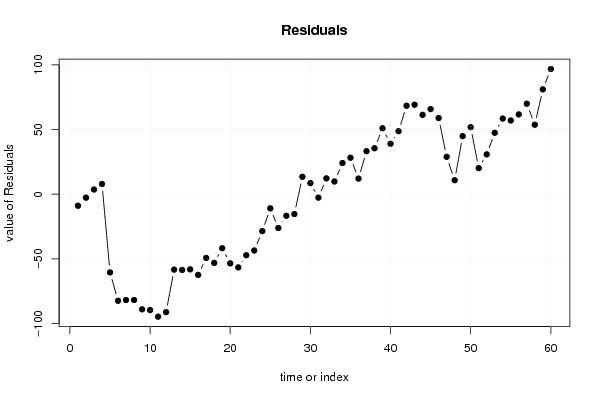
Multiple Linear Regression - Actuals, Interpolation, and Residuals
Time or IndexActualsInterpolationForecastResidualsPrediction Error
18795.8900000000002-8.8900000000002
296.398.95-2.64999999999993
3107.1103.493.60999999999998
4115.2107.2700000000007.93000000000012
5106.1166.52-60.42
689.5171.84-82.34
791.3173.04-81.74
897.6179.36-81.76
9100.7189.66-88.96
10104.6194.12-89.52
1194.7189.3-94.6
12101.8192.92-91.12
13102.5160.7525-58.2525
14105.3163.8125-58.5125
15110.3168.3525-58.0525
16109.8172.1325-62.3325
17117.3166.52-49.22
18118.8171.84-53.04
19131.3173.04-41.74
20125.9179.36-53.46
21133.1189.66-56.56
22147194.12-47.12
23145.8189.3-43.5
24164.4192.92-28.52
25149.8160.7525-10.9524999999999
26137.7163.8125-26.1125
27151.7168.3525-16.6525000000000
28156.8172.1325-15.3325
29180166.5213.4800000000000
30180.4171.848.56
31170.4173.04-2.63999999999998
32191.6179.3612.24
33199.5189.669.84
34218.2194.1224.08
35217.5189.328.2000000000000
36205192.9212.0800000000000
37194160.752533.2475000000001
38199.3163.812535.4875
39219.3168.352550.9475
40211.1172.132538.9675
41215.2166.5248.68
42240.2171.8468.36
43242.2173.0469.16
44240.7179.3661.34
45255.4189.6665.74
46253194.1258.88
47218.2189.328.9
48203.7192.9210.7799999999999
49205.6160.752544.8475000000001
50215.6163.812551.7875
51188.5168.352520.1475000000000
52202.9172.132530.7675
53214166.5247.48
54230.3171.8458.46
55230173.0456.96
56241179.3661.64
57259.6189.6669.94
58247.8194.1253.68
59270.3189.381
60289.7192.9296.78

\begin{tabular}{lllllllll}
\hline
Multiple Linear Regression - Actuals, Interpolation, and Residuals \tabularnewline
Time or Index & Actuals & InterpolationForecast & ResidualsPrediction Error \tabularnewline
1 & 87 & 95.8900000000002 & -8.8900000000002 \tabularnewline
2 & 96.3 & 98.95 & -2.64999999999993 \tabularnewline
3 & 107.1 & 103.49 & 3.60999999999998 \tabularnewline
4 & 115.2 & 107.270000000000 & 7.93000000000012 \tabularnewline
5 & 106.1 & 166.52 & -60.42 \tabularnewline
6 & 89.5 & 171.84 & -82.34 \tabularnewline
7 & 91.3 & 173.04 & -81.74 \tabularnewline
8 & 97.6 & 179.36 & -81.76 \tabularnewline
9 & 100.7 & 189.66 & -88.96 \tabularnewline
10 & 104.6 & 194.12 & -89.52 \tabularnewline
11 & 94.7 & 189.3 & -94.6 \tabularnewline
12 & 101.8 & 192.92 & -91.12 \tabularnewline
13 & 102.5 & 160.7525 & -58.2525 \tabularnewline
14 & 105.3 & 163.8125 & -58.5125 \tabularnewline
15 & 110.3 & 168.3525 & -58.0525 \tabularnewline
16 & 109.8 & 172.1325 & -62.3325 \tabularnewline
17 & 117.3 & 166.52 & -49.22 \tabularnewline
18 & 118.8 & 171.84 & -53.04 \tabularnewline
19 & 131.3 & 173.04 & -41.74 \tabularnewline
20 & 125.9 & 179.36 & -53.46 \tabularnewline
21 & 133.1 & 189.66 & -56.56 \tabularnewline
22 & 147 & 194.12 & -47.12 \tabularnewline
23 & 145.8 & 189.3 & -43.5 \tabularnewline
24 & 164.4 & 192.92 & -28.52 \tabularnewline
25 & 149.8 & 160.7525 & -10.9524999999999 \tabularnewline
26 & 137.7 & 163.8125 & -26.1125 \tabularnewline
27 & 151.7 & 168.3525 & -16.6525000000000 \tabularnewline
28 & 156.8 & 172.1325 & -15.3325 \tabularnewline
29 & 180 & 166.52 & 13.4800000000000 \tabularnewline
30 & 180.4 & 171.84 & 8.56 \tabularnewline
31 & 170.4 & 173.04 & -2.63999999999998 \tabularnewline
32 & 191.6 & 179.36 & 12.24 \tabularnewline
33 & 199.5 & 189.66 & 9.84 \tabularnewline
34 & 218.2 & 194.12 & 24.08 \tabularnewline
35 & 217.5 & 189.3 & 28.2000000000000 \tabularnewline
36 & 205 & 192.92 & 12.0800000000000 \tabularnewline
37 & 194 & 160.7525 & 33.2475000000001 \tabularnewline
38 & 199.3 & 163.8125 & 35.4875 \tabularnewline
39 & 219.3 & 168.3525 & 50.9475 \tabularnewline
40 & 211.1 & 172.1325 & 38.9675 \tabularnewline
41 & 215.2 & 166.52 & 48.68 \tabularnewline
42 & 240.2 & 171.84 & 68.36 \tabularnewline
43 & 242.2 & 173.04 & 69.16 \tabularnewline
44 & 240.7 & 179.36 & 61.34 \tabularnewline
45 & 255.4 & 189.66 & 65.74 \tabularnewline
46 & 253 & 194.12 & 58.88 \tabularnewline
47 & 218.2 & 189.3 & 28.9 \tabularnewline
48 & 203.7 & 192.92 & 10.7799999999999 \tabularnewline
49 & 205.6 & 160.7525 & 44.8475000000001 \tabularnewline
50 & 215.6 & 163.8125 & 51.7875 \tabularnewline
51 & 188.5 & 168.3525 & 20.1475000000000 \tabularnewline
52 & 202.9 & 172.1325 & 30.7675 \tabularnewline
53 & 214 & 166.52 & 47.48 \tabularnewline
54 & 230.3 & 171.84 & 58.46 \tabularnewline
55 & 230 & 173.04 & 56.96 \tabularnewline
56 & 241 & 179.36 & 61.64 \tabularnewline
57 & 259.6 & 189.66 & 69.94 \tabularnewline
58 & 247.8 & 194.12 & 53.68 \tabularnewline
59 & 270.3 & 189.3 & 81 \tabularnewline
60 & 289.7 & 192.92 & 96.78 \tabularnewline
\hline
\end{tabular}
%Source: https://freestatistics.org/blog/index.php?pk=2743&T=4

[TABLE]
[ROW][C]Multiple Linear Regression - Actuals, Interpolation, and Residuals[/C][/ROW]
[ROW][C]Time or Index[/C][C]Actuals[/C][C]InterpolationForecast[/C][C]ResidualsPrediction Error[/C][/ROW]
[ROW][C]1[/C][C]87[/C][C]95.8900000000002[/C][C]-8.8900000000002[/C][/ROW]
[ROW][C]2[/C][C]96.3[/C][C]98.95[/C][C]-2.64999999999993[/C][/ROW]
[ROW][C]3[/C][C]107.1[/C][C]103.49[/C][C]3.60999999999998[/C][/ROW]
[ROW][C]4[/C][C]115.2[/C][C]107.270000000000[/C][C]7.93000000000012[/C][/ROW]
[ROW][C]5[/C][C]106.1[/C][C]166.52[/C][C]-60.42[/C][/ROW]
[ROW][C]6[/C][C]89.5[/C][C]171.84[/C][C]-82.34[/C][/ROW]
[ROW][C]7[/C][C]91.3[/C][C]173.04[/C][C]-81.74[/C][/ROW]
[ROW][C]8[/C][C]97.6[/C][C]179.36[/C][C]-81.76[/C][/ROW]
[ROW][C]9[/C][C]100.7[/C][C]189.66[/C][C]-88.96[/C][/ROW]
[ROW][C]10[/C][C]104.6[/C][C]194.12[/C][C]-89.52[/C][/ROW]
[ROW][C]11[/C][C]94.7[/C][C]189.3[/C][C]-94.6[/C][/ROW]
[ROW][C]12[/C][C]101.8[/C][C]192.92[/C][C]-91.12[/C][/ROW]
[ROW][C]13[/C][C]102.5[/C][C]160.7525[/C][C]-58.2525[/C][/ROW]
[ROW][C]14[/C][C]105.3[/C][C]163.8125[/C][C]-58.5125[/C][/ROW]
[ROW][C]15[/C][C]110.3[/C][C]168.3525[/C][C]-58.0525[/C][/ROW]
[ROW][C]16[/C][C]109.8[/C][C]172.1325[/C][C]-62.3325[/C][/ROW]
[ROW][C]17[/C][C]117.3[/C][C]166.52[/C][C]-49.22[/C][/ROW]
[ROW][C]18[/C][C]118.8[/C][C]171.84[/C][C]-53.04[/C][/ROW]
[ROW][C]19[/C][C]131.3[/C][C]173.04[/C][C]-41.74[/C][/ROW]
[ROW][C]20[/C][C]125.9[/C][C]179.36[/C][C]-53.46[/C][/ROW]
[ROW][C]21[/C][C]133.1[/C][C]189.66[/C][C]-56.56[/C][/ROW]
[ROW][C]22[/C][C]147[/C][C]194.12[/C][C]-47.12[/C][/ROW]
[ROW][C]23[/C][C]145.8[/C][C]189.3[/C][C]-43.5[/C][/ROW]
[ROW][C]24[/C][C]164.4[/C][C]192.92[/C][C]-28.52[/C][/ROW]
[ROW][C]25[/C][C]149.8[/C][C]160.7525[/C][C]-10.9524999999999[/C][/ROW]
[ROW][C]26[/C][C]137.7[/C][C]163.8125[/C][C]-26.1125[/C][/ROW]
[ROW][C]27[/C][C]151.7[/C][C]168.3525[/C][C]-16.6525000000000[/C][/ROW]
[ROW][C]28[/C][C]156.8[/C][C]172.1325[/C][C]-15.3325[/C][/ROW]
[ROW][C]29[/C][C]180[/C][C]166.52[/C][C]13.4800000000000[/C][/ROW]
[ROW][C]30[/C][C]180.4[/C][C]171.84[/C][C]8.56[/C][/ROW]
[ROW][C]31[/C][C]170.4[/C][C]173.04[/C][C]-2.63999999999998[/C][/ROW]
[ROW][C]32[/C][C]191.6[/C][C]179.36[/C][C]12.24[/C][/ROW]
[ROW][C]33[/C][C]199.5[/C][C]189.66[/C][C]9.84[/C][/ROW]
[ROW][C]34[/C][C]218.2[/C][C]194.12[/C][C]24.08[/C][/ROW]
[ROW][C]35[/C][C]217.5[/C][C]189.3[/C][C]28.2000000000000[/C][/ROW]
[ROW][C]36[/C][C]205[/C][C]192.92[/C][C]12.0800000000000[/C][/ROW]
[ROW][C]37[/C][C]194[/C][C]160.7525[/C][C]33.2475000000001[/C][/ROW]
[ROW][C]38[/C][C]199.3[/C][C]163.8125[/C][C]35.4875[/C][/ROW]
[ROW][C]39[/C][C]219.3[/C][C]168.3525[/C][C]50.9475[/C][/ROW]
[ROW][C]40[/C][C]211.1[/C][C]172.1325[/C][C]38.9675[/C][/ROW]
[ROW][C]41[/C][C]215.2[/C][C]166.52[/C][C]48.68[/C][/ROW]
[ROW][C]42[/C][C]240.2[/C][C]171.84[/C][C]68.36[/C][/ROW]
[ROW][C]43[/C][C]242.2[/C][C]173.04[/C][C]69.16[/C][/ROW]
[ROW][C]44[/C][C]240.7[/C][C]179.36[/C][C]61.34[/C][/ROW]
[ROW][C]45[/C][C]255.4[/C][C]189.66[/C][C]65.74[/C][/ROW]
[ROW][C]46[/C][C]253[/C][C]194.12[/C][C]58.88[/C][/ROW]
[ROW][C]47[/C][C]218.2[/C][C]189.3[/C][C]28.9[/C][/ROW]
[ROW][C]48[/C][C]203.7[/C][C]192.92[/C][C]10.7799999999999[/C][/ROW]
[ROW][C]49[/C][C]205.6[/C][C]160.7525[/C][C]44.8475000000001[/C][/ROW]
[ROW][C]50[/C][C]215.6[/C][C]163.8125[/C][C]51.7875[/C][/ROW]
[ROW][C]51[/C][C]188.5[/C][C]168.3525[/C][C]20.1475000000000[/C][/ROW]
[ROW][C]52[/C][C]202.9[/C][C]172.1325[/C][C]30.7675[/C][/ROW]
[ROW][C]53[/C][C]214[/C][C]166.52[/C][C]47.48[/C][/ROW]
[ROW][C]54[/C][C]230.3[/C][C]171.84[/C][C]58.46[/C][/ROW]
[ROW][C]55[/C][C]230[/C][C]173.04[/C][C]56.96[/C][/ROW]
[ROW][C]56[/C][C]241[/C][C]179.36[/C][C]61.64[/C][/ROW]
[ROW][C]57[/C][C]259.6[/C][C]189.66[/C][C]69.94[/C][/ROW]
[ROW][C]58[/C][C]247.8[/C][C]194.12[/C][C]53.68[/C][/ROW]
[ROW][C]59[/C][C]270.3[/C][C]189.3[/C][C]81[/C][/ROW]
[ROW][C]60[/C][C]289.7[/C][C]192.92[/C][C]96.78[/C][/ROW]
[/TABLE]
Source: https://freestatistics.org/blog/index.php?pk=2743&T=4

Globally Unique Identifier (entire table): ba.freestatistics.org/blog/index.php?pk=2743&T=4

As an alternative you can also use a QR Code:  

The GUIDs for individual cells are displayed in the table below:

Multiple Linear Regression - Actuals, Interpolation, and Residuals
Time or IndexActualsInterpolationForecastResidualsPrediction Error
18795.8900000000002-8.8900000000002
296.398.95-2.64999999999993
3107.1103.493.60999999999998
4115.2107.2700000000007.93000000000012
5106.1166.52-60.42
689.5171.84-82.34
791.3173.04-81.74
897.6179.36-81.76
9100.7189.66-88.96
10104.6194.12-89.52
1194.7189.3-94.6
12101.8192.92-91.12
13102.5160.7525-58.2525
14105.3163.8125-58.5125
15110.3168.3525-58.0525
16109.8172.1325-62.3325
17117.3166.52-49.22
18118.8171.84-53.04
19131.3173.04-41.74
20125.9179.36-53.46
21133.1189.66-56.56
22147194.12-47.12
23145.8189.3-43.5
24164.4192.92-28.52
25149.8160.7525-10.9524999999999
26137.7163.8125-26.1125
27151.7168.3525-16.6525000000000
28156.8172.1325-15.3325
29180166.5213.4800000000000
30180.4171.848.56
31170.4173.04-2.63999999999998
32191.6179.3612.24
33199.5189.669.84
34218.2194.1224.08
35217.5189.328.2000000000000
36205192.9212.0800000000000
37194160.752533.2475000000001
38199.3163.812535.4875
39219.3168.352550.9475
40211.1172.132538.9675
41215.2166.5248.68
42240.2171.8468.36
43242.2173.0469.16
44240.7179.3661.34
45255.4189.6665.74
46253194.1258.88
47218.2189.328.9
48203.7192.9210.7799999999999
49205.6160.752544.8475000000001
50215.6163.812551.7875
51188.5168.352520.1475000000000
52202.9172.132530.7675
53214166.5247.48
54230.3171.8458.46
55230173.0456.96
56241179.3661.64
57259.6189.6669.94
58247.8194.1253.68
59270.3189.381
60289.7192.9296.78


Parameters (Session):
par1 = 1 ; par2 = Include Monthly Dummies ; par3 = No Linear Trend ;
Parameters (R input):
par1 = 1 ; par2 = Include Monthly Dummies ; par3 = No Linear Trend ;
R code (references can be found in the software module):
library(lattice)
par1 <- as.numeric(par1)
x <- t(y)
k <- length(x[1,])
n <- length(x[,1])
x1 <- cbind(x[,par1], x[,1:k!=par1])
mycolnames <- c(colnames(x)[par1], colnames(x)[1:k!=par1])
colnames(x1) <- mycolnames #colnames(x)[par1]
x <- x1
if (par3 == 'First Differences'){
x2 <- array(0, dim=c(n-1,k), dimnames=list(1:(n-1), paste('(1-B)',colnames(x),sep='')))
for (i in 1:n-1) {
for (j in 1:k) {
x2[i,j] <- x[i+1,j] - x[i,j]
}
}
x <- x2
}
if (par2 == 'Include Monthly Dummies'){
x2 <- array(0, dim=c(n,11), dimnames=list(1:n, paste('M', seq(1:11), sep ='')))
for (i in 1:11){
x2[seq(i,n,12),i] <- 1
}
x <- cbind(x, x2)
}
if (par2 == 'Include Quarterly Dummies'){
x2 <- array(0, dim=c(n,3), dimnames=list(1:n, paste('Q', seq(1:3), sep ='')))
for (i in 1:3){
x2[seq(i,n,4),i] <- 1
}
x <- cbind(x, x2)
}
k <- length(x[1,])
if (par3 == 'Linear Trend'){
x <- cbind(x, c(1:n))
colnames(x)[k+1] <- 't'
}
x
k <- length(x[1,])
df <- as.data.frame(x)
(mylm <- lm(df))
(mysum <- summary(mylm))
bitmap(file='test0.png')
plot(x[,1], type='l', main='Actuals and Interpolation', ylab='value of Actuals and Interpolation (dots)', xlab='time or index')
points(x[,1]-mysum$resid)
grid()
dev.off()
bitmap(file='test1.png')
plot(mysum$resid, type='b', pch=19, main='Residuals', ylab='value of Residuals', xlab='time or index')
grid()
dev.off()
bitmap(file='test2.png')
hist(mysum$resid, main='Residual Histogram', xlab='values of Residuals')
grid()
dev.off()
bitmap(file='test3.png')
densityplot(~mysum$resid,col='black',main='Residual Density Plot', xlab='values of Residuals')
dev.off()
bitmap(file='test4.png')
qqnorm(mysum$resid, main='Residual Normal Q-Q Plot')
grid()
dev.off()
(myerror <- as.ts(mysum$resid))
bitmap(file='test5.png')
dum <- cbind(lag(myerror,k=1),myerror)
dum
dum1 <- dum[2:length(myerror),]
dum1
z <- as.data.frame(dum1)
z
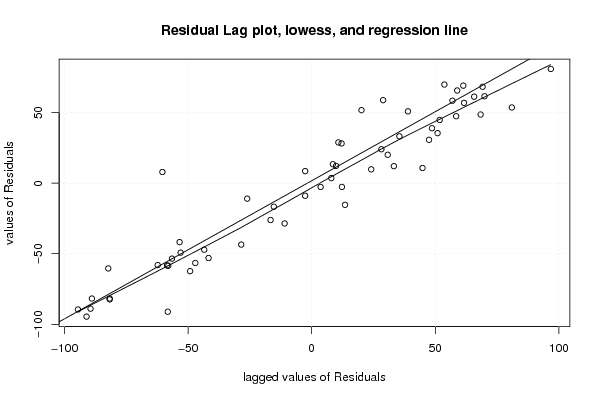
plot(z,main=paste('Residual Lag plot, lowess, and regression line'), ylab='values of Residuals', xlab='lagged values of Residuals')
lines(lowess(z))
abline(lm(z))
grid()
dev.off()
bitmap(file='test6.png')
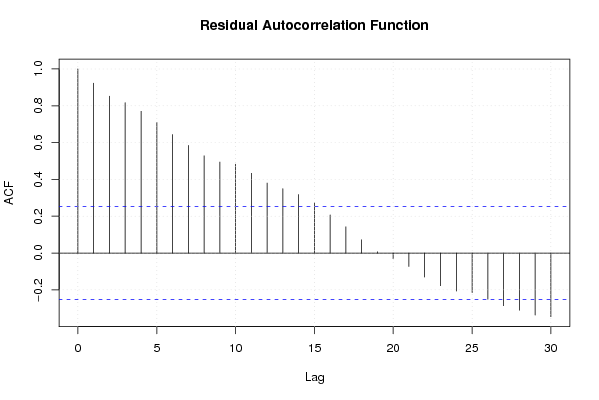
acf(mysum$resid, lag.max=length(mysum$resid)/2, main='Residual Autocorrelation Function')
grid()
dev.off()
bitmap(file='test7.png')
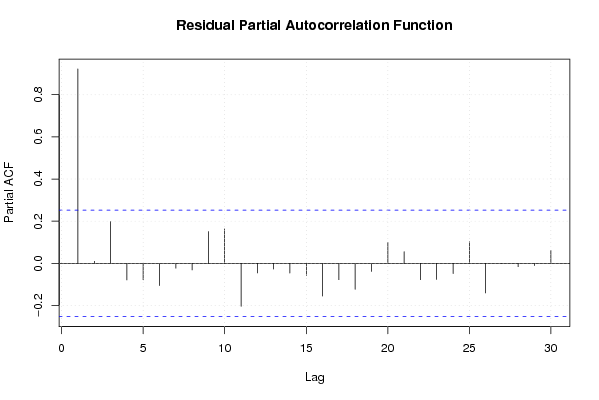
pacf(mysum$resid, lag.max=length(mysum$resid)/2, main='Residual Partial Autocorrelation Function')
grid()
dev.off()
bitmap(file='test8.png')
opar <- par(mfrow = c(2,2), oma = c(0, 0, 1.1, 0))
plot(mylm, las = 1, sub='Residual Diagnostics')
par(opar)
dev.off()
load(file='createtable')
a<-table.start()
a<-table.row.start(a)
a<-table.element(a, 'Multiple Linear Regression - Estimated Regression Equation', 1, TRUE)
a<-table.row.end(a)
myeq <- colnames(x)[1]
myeq <- paste(myeq, '[t] = ', sep='')
for (i in 1:k){
if (mysum$coefficients[i,1] > 0) myeq <- paste(myeq, '+', '')
myeq <- paste(myeq, mysum$coefficients[i,1], sep=' ')
if (rownames(mysum$coefficients)[i] != '(Intercept)') {
myeq <- paste(myeq, rownames(mysum$coefficients)[i], sep='')
if (rownames(mysum$coefficients)[i] != 't') myeq <- paste(myeq, '[t]', sep='')
}
}
myeq <- paste(myeq, ' + e[t]')
a<-table.row.start(a)
a<-table.element(a, myeq)
a<-table.row.end(a)
a<-table.end(a)
table.save(a,file='mytable1.tab')
a<-table.start()
a<-table.row.start(a)
a<-table.element(a,hyperlink('ols1.htm','Multiple Linear Regression - Ordinary Least Squares',''), 6, TRUE)
a<-table.row.end(a)
a<-table.row.start(a)
a<-table.element(a,'Variable',header=TRUE)
a<-table.element(a,'Parameter',header=TRUE)
a<-table.element(a,'S.D.',header=TRUE)
a<-table.element(a,'T-STAT
H0: parameter = 0',header=TRUE)
a<-table.element(a,'2-tail p-value',header=TRUE)
a<-table.element(a,'1-tail p-value',header=TRUE)
a<-table.row.end(a)
for (i in 1:k){
a<-table.row.start(a)
a<-table.element(a,rownames(mysum$coefficients)[i],header=TRUE)
a<-table.element(a,mysum$coefficients[i,1])
a<-table.element(a, round(mysum$coefficients[i,2],6))
a<-table.element(a, round(mysum$coefficients[i,3],4))
a<-table.element(a, round(mysum$coefficients[i,4],6))
a<-table.element(a, round(mysum$coefficients[i,4]/2,6))
a<-table.row.end(a)
}
a<-table.end(a)
table.save(a,file='mytable2.tab')
a<-table.start()
a<-table.row.start(a)
a<-table.element(a, 'Multiple Linear Regression - Regression Statistics', 2, TRUE)
a<-table.row.end(a)
a<-table.row.start(a)
a<-table.element(a, 'Multiple R',1,TRUE)
a<-table.element(a, sqrt(mysum$r.squared))
a<-table.row.end(a)
a<-table.row.start(a)
a<-table.element(a, 'R-squared',1,TRUE)
a<-table.element(a, mysum$r.squared)
a<-table.row.end(a)
a<-table.row.start(a)
a<-table.element(a, 'Adjusted R-squared',1,TRUE)
a<-table.element(a, mysum$adj.r.squared)
a<-table.row.end(a)
a<-table.row.start(a)
a<-table.element(a, 'F-TEST (value)',1,TRUE)
a<-table.element(a, mysum$fstatistic[1])
a<-table.row.end(a)
a<-table.row.start(a)
a<-table.element(a, 'F-TEST (DF numerator)',1,TRUE)
a<-table.element(a, mysum$fstatistic[2])
a<-table.row.end(a)
a<-table.row.start(a)
a<-table.element(a, 'F-TEST (DF denominator)',1,TRUE)
a<-table.element(a, mysum$fstatistic[3])
a<-table.row.end(a)
a<-table.row.start(a)
a<-table.element(a, 'p-value',1,TRUE)
a<-table.element(a, 1-pf(mysum$fstatistic[1],mysum$fstatistic[2],mysum$fstatistic[3]))
a<-table.row.end(a)
a<-table.row.start(a)
a<-table.element(a, 'Multiple Linear Regression - Residual Statistics', 2, TRUE)
a<-table.row.end(a)
a<-table.row.start(a)
a<-table.element(a, 'Residual Standard Deviation',1,TRUE)
a<-table.element(a, mysum$sigma)
a<-table.row.end(a)
a<-table.row.start(a)
a<-table.element(a, 'Sum Squared Residuals',1,TRUE)
a<-table.element(a, sum(myerror*myerror))
a<-table.row.end(a)
a<-table.end(a)
table.save(a,file='mytable3.tab')
a<-table.start()
a<-table.row.start(a)
a<-table.element(a, 'Multiple Linear Regression - Actuals, Interpolation, and Residuals', 4, TRUE)
a<-table.row.end(a)
a<-table.row.start(a)
a<-table.element(a, 'Time or Index', 1, TRUE)
a<-table.element(a, 'Actuals', 1, TRUE)
a<-table.element(a, 'Interpolation
Forecast', 1, TRUE)
a<-table.element(a, 'Residuals
Prediction Error', 1, TRUE)
a<-table.row.end(a)
for (i in 1:n) {
a<-table.row.start(a)
a<-table.element(a,i, 1, TRUE)
a<-table.element(a,x[i])
a<-table.element(a,x[i]-mysum$resid[i])
a<-table.element(a,mysum$resid[i])
a<-table.row.end(a)
}
a<-table.end(a)
table.save(a,file='mytable4.tab')