Free Statistics

of Irreproducible Research!

Author's title

Author*Unverified author*
R Software Modulerwasp_autocorrelation.wasp
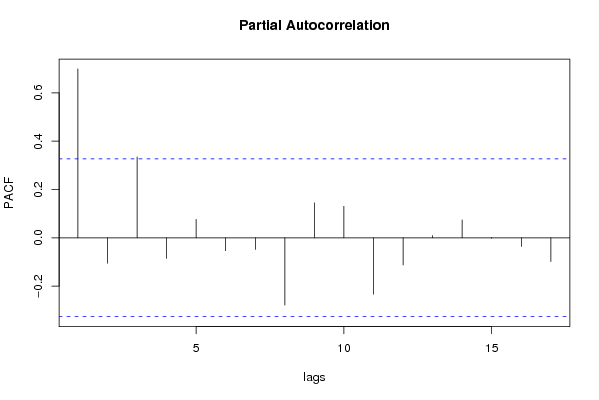
Title produced by software(Partial) Autocorrelation Function
Date of computationThu, 06 Dec 2007 14:25:10 -0700
Cite this page as followsStatistical Computations at FreeStatistics.org, Office for Research Development and Education, URL https://freestatistics.org/blog/index.php?v=date/2007/Dec/06/t1196975808y1l1miofd16o0bq.htm/, Retrieved Fri, 03 May 2024 12:24:10 +0000
Statistical Computations at FreeStatistics.org, Office for Research Development and Education, URL https://freestatistics.org/blog/index.php?pk=2716, Retrieved Fri, 03 May 2024 12:24:10 +0000
QR Codes:

Original text written by user:
IsPrivate?No (this computation is public)
User-defined keywordsautocorrelatie aardolie
Estimated Impact209
Family? (F = Feedback message, R = changed R code, M = changed R Module, P = changed Parameters, D = changed Data)
-       [(Partial) Autocorrelation Function] [] [2007-12-06 21:25:10] [e24e91da8d334fb8882bf413603fde71] [Current]
Feedback Forum

Post a new message
Dataseries X:
87.0
96.3
107.1
115.2
106.1
89.5
91.3
97.6
100.7
104.6
94.7
101.8
102.5
105.3
110.3
109.8
117.3
118.8
131.3
125.9
133.1
147.0
145.8
164.4
149.8
137.7
151.7
156.8
180.0
180.4
170.4
191.6
199.5
218.2
217.5
205.0
194.0
199.3
219.3
211.1
215.2
240.2
242.2
240.7
255.4
253.0
218.2
203.7
205.6
215.6
188.5
202.9
214.0
230.3
230.0
241.0
259.6
247.8
270.3
289.7


Summary of compuational transaction
Raw Inputview raw input (R code)
Raw Outputview raw output of R engine
Computing time1 seconds
R Server'Gwilym Jenkins' @ 72.249.127.135

\begin{tabular}{lllllllll}
\hline
Summary of compuational transaction \tabularnewline
Raw Input & view raw input (R code)  \tabularnewline
Raw Output & view raw output of R engine  \tabularnewline
Computing time & 1 seconds \tabularnewline
R Server & 'Gwilym Jenkins' @ 72.249.127.135 \tabularnewline
\hline
\end{tabular}
%Source: https://freestatistics.org/blog/index.php?pk=2716&T=0

[TABLE]
[ROW][C]Summary of compuational transaction[/C][/ROW]
[ROW][C]Raw Input[/C][C]view raw input (R code) [/C][/ROW]
[ROW][C]Raw Output[/C][C]view raw output of R engine [/C][/ROW]
[ROW][C]Computing time[/C][C]1 seconds[/C][/ROW]
[ROW][C]R Server[/C][C]'Gwilym Jenkins' @ 72.249.127.135[/C][/ROW]
[/TABLE]
Source: https://freestatistics.org/blog/index.php?pk=2716&T=0

Globally Unique Identifier (entire table): ba.freestatistics.org/blog/index.php?pk=2716&T=0

As an alternative you can also use a QR Code:  

The GUIDs for individual cells are displayed in the table below:

Summary of compuational transaction
Raw Inputview raw input (R code)
Raw Outputview raw output of R engine
Computing time1 seconds
R Server'Gwilym Jenkins' @ 72.249.127.135


Autocorrelation Function
Time lag kACF(k)T-STATP-value
0160
10.6990974.19468.5e-05
20.4348462.60910.00657
30.4316712.590.006883
40.3861152.31670.013162
50.3021931.81320.039076
60.2423751.45420.07727
70.1705571.02330.156488
8-0.000733-0.00440.501742
9-0.041143-0.24690.59679
100.0808870.48530.315195
11-0.008818-0.05290.520951
12-0.1908-1.14480.870077
13-0.20071-1.20430.881826
14-0.135246-0.81150.788788
15-0.130645-0.78390.780878
16-0.14365-0.86190.802776

\begin{tabular}{lllllllll}
\hline
Autocorrelation Function \tabularnewline
Time lag k & ACF(k) & T-STAT & P-value \tabularnewline
0 & 1 & 6 & 0 \tabularnewline
1 & 0.699097 & 4.1946 & 8.5e-05 \tabularnewline
2 & 0.434846 & 2.6091 & 0.00657 \tabularnewline
3 & 0.431671 & 2.59 & 0.006883 \tabularnewline
4 & 0.386115 & 2.3167 & 0.013162 \tabularnewline
5 & 0.302193 & 1.8132 & 0.039076 \tabularnewline
6 & 0.242375 & 1.4542 & 0.07727 \tabularnewline
7 & 0.170557 & 1.0233 & 0.156488 \tabularnewline
8 & -0.000733 & -0.0044 & 0.501742 \tabularnewline
9 & -0.041143 & -0.2469 & 0.59679 \tabularnewline
10 & 0.080887 & 0.4853 & 0.315195 \tabularnewline
11 & -0.008818 & -0.0529 & 0.520951 \tabularnewline
12 & -0.1908 & -1.1448 & 0.870077 \tabularnewline
13 & -0.20071 & -1.2043 & 0.881826 \tabularnewline
14 & -0.135246 & -0.8115 & 0.788788 \tabularnewline
15 & -0.130645 & -0.7839 & 0.780878 \tabularnewline
16 & -0.14365 & -0.8619 & 0.802776 \tabularnewline
\hline
\end{tabular}
%Source: https://freestatistics.org/blog/index.php?pk=2716&T=1

[TABLE]
[ROW][C]Autocorrelation Function[/C][/ROW]
[ROW][C]Time lag k[/C][C]ACF(k)[/C][C]T-STAT[/C][C]P-value[/C][/ROW]
[ROW][C]0[/C][C]1[/C][C]6[/C][C]0[/C][/ROW]
[ROW][C]1[/C][C]0.699097[/C][C]4.1946[/C][C]8.5e-05[/C][/ROW]
[ROW][C]2[/C][C]0.434846[/C][C]2.6091[/C][C]0.00657[/C][/ROW]
[ROW][C]3[/C][C]0.431671[/C][C]2.59[/C][C]0.006883[/C][/ROW]
[ROW][C]4[/C][C]0.386115[/C][C]2.3167[/C][C]0.013162[/C][/ROW]
[ROW][C]5[/C][C]0.302193[/C][C]1.8132[/C][C]0.039076[/C][/ROW]
[ROW][C]6[/C][C]0.242375[/C][C]1.4542[/C][C]0.07727[/C][/ROW]
[ROW][C]7[/C][C]0.170557[/C][C]1.0233[/C][C]0.156488[/C][/ROW]
[ROW][C]8[/C][C]-0.000733[/C][C]-0.0044[/C][C]0.501742[/C][/ROW]
[ROW][C]9[/C][C]-0.041143[/C][C]-0.2469[/C][C]0.59679[/C][/ROW]
[ROW][C]10[/C][C]0.080887[/C][C]0.4853[/C][C]0.315195[/C][/ROW]
[ROW][C]11[/C][C]-0.008818[/C][C]-0.0529[/C][C]0.520951[/C][/ROW]
[ROW][C]12[/C][C]-0.1908[/C][C]-1.1448[/C][C]0.870077[/C][/ROW]
[ROW][C]13[/C][C]-0.20071[/C][C]-1.2043[/C][C]0.881826[/C][/ROW]
[ROW][C]14[/C][C]-0.135246[/C][C]-0.8115[/C][C]0.788788[/C][/ROW]
[ROW][C]15[/C][C]-0.130645[/C][C]-0.7839[/C][C]0.780878[/C][/ROW]
[ROW][C]16[/C][C]-0.14365[/C][C]-0.8619[/C][C]0.802776[/C][/ROW]
[/TABLE]
Source: https://freestatistics.org/blog/index.php?pk=2716&T=1

Globally Unique Identifier (entire table): ba.freestatistics.org/blog/index.php?pk=2716&T=1

As an alternative you can also use a QR Code:  

The GUIDs for individual cells are displayed in the table below:

Autocorrelation Function
Time lag kACF(k)T-STATP-value
0160
10.6990974.19468.5e-05
20.4348462.60910.00657
30.4316712.590.006883
40.3861152.31670.013162
50.3021931.81320.039076
60.2423751.45420.07727
70.1705571.02330.156488
8-0.000733-0.00440.501742
9-0.041143-0.24690.59679
100.0808870.48530.315195
11-0.008818-0.05290.520951
12-0.1908-1.14480.870077
13-0.20071-1.20430.881826
14-0.135246-0.81150.788788
15-0.130645-0.78390.780878
16-0.14365-0.86190.802776


Partial Autocorrelation Function
Time lag kPACF(k)T-STATP-value
00.6990974.19468.5e-05
1-0.105408-0.63240.734455
20.3348962.00940.02602
3-0.085686-0.51410.694843
40.0762020.45720.325133
5-0.053379-0.32030.624694
6-0.048231-0.28940.613026
7-0.278839-1.6730.948505
80.1448180.86890.195328
90.1302070.78120.219885
10-0.233864-1.40320.915436
11-0.112521-0.67510.748045
120.0091870.05510.478173
130.0740170.44410.329815
14-0.002719-0.01630.506463
15-0.035686-0.21410.584167
16-0.098429-0.59060.720753

\begin{tabular}{lllllllll}
\hline
Partial Autocorrelation Function \tabularnewline
Time lag k & PACF(k) & T-STAT & P-value \tabularnewline
0 & 0.699097 & 4.1946 & 8.5e-05 \tabularnewline
1 & -0.105408 & -0.6324 & 0.734455 \tabularnewline
2 & 0.334896 & 2.0094 & 0.02602 \tabularnewline
3 & -0.085686 & -0.5141 & 0.694843 \tabularnewline
4 & 0.076202 & 0.4572 & 0.325133 \tabularnewline
5 & -0.053379 & -0.3203 & 0.624694 \tabularnewline
6 & -0.048231 & -0.2894 & 0.613026 \tabularnewline
7 & -0.278839 & -1.673 & 0.948505 \tabularnewline
8 & 0.144818 & 0.8689 & 0.195328 \tabularnewline
9 & 0.130207 & 0.7812 & 0.219885 \tabularnewline
10 & -0.233864 & -1.4032 & 0.915436 \tabularnewline
11 & -0.112521 & -0.6751 & 0.748045 \tabularnewline
12 & 0.009187 & 0.0551 & 0.478173 \tabularnewline
13 & 0.074017 & 0.4441 & 0.329815 \tabularnewline
14 & -0.002719 & -0.0163 & 0.506463 \tabularnewline
15 & -0.035686 & -0.2141 & 0.584167 \tabularnewline
16 & -0.098429 & -0.5906 & 0.720753 \tabularnewline
\hline
\end{tabular}
%Source: https://freestatistics.org/blog/index.php?pk=2716&T=2

[TABLE]
[ROW][C]Partial Autocorrelation Function[/C][/ROW]
[ROW][C]Time lag k[/C][C]PACF(k)[/C][C]T-STAT[/C][C]P-value[/C][/ROW]
[ROW][C]0[/C][C]0.699097[/C][C]4.1946[/C][C]8.5e-05[/C][/ROW]
[ROW][C]1[/C][C]-0.105408[/C][C]-0.6324[/C][C]0.734455[/C][/ROW]
[ROW][C]2[/C][C]0.334896[/C][C]2.0094[/C][C]0.02602[/C][/ROW]
[ROW][C]3[/C][C]-0.085686[/C][C]-0.5141[/C][C]0.694843[/C][/ROW]
[ROW][C]4[/C][C]0.076202[/C][C]0.4572[/C][C]0.325133[/C][/ROW]
[ROW][C]5[/C][C]-0.053379[/C][C]-0.3203[/C][C]0.624694[/C][/ROW]
[ROW][C]6[/C][C]-0.048231[/C][C]-0.2894[/C][C]0.613026[/C][/ROW]
[ROW][C]7[/C][C]-0.278839[/C][C]-1.673[/C][C]0.948505[/C][/ROW]
[ROW][C]8[/C][C]0.144818[/C][C]0.8689[/C][C]0.195328[/C][/ROW]
[ROW][C]9[/C][C]0.130207[/C][C]0.7812[/C][C]0.219885[/C][/ROW]
[ROW][C]10[/C][C]-0.233864[/C][C]-1.4032[/C][C]0.915436[/C][/ROW]
[ROW][C]11[/C][C]-0.112521[/C][C]-0.6751[/C][C]0.748045[/C][/ROW]
[ROW][C]12[/C][C]0.009187[/C][C]0.0551[/C][C]0.478173[/C][/ROW]
[ROW][C]13[/C][C]0.074017[/C][C]0.4441[/C][C]0.329815[/C][/ROW]
[ROW][C]14[/C][C]-0.002719[/C][C]-0.0163[/C][C]0.506463[/C][/ROW]
[ROW][C]15[/C][C]-0.035686[/C][C]-0.2141[/C][C]0.584167[/C][/ROW]
[ROW][C]16[/C][C]-0.098429[/C][C]-0.5906[/C][C]0.720753[/C][/ROW]
[/TABLE]
Source: https://freestatistics.org/blog/index.php?pk=2716&T=2

Globally Unique Identifier (entire table): ba.freestatistics.org/blog/index.php?pk=2716&T=2

As an alternative you can also use a QR Code:  

The GUIDs for individual cells are displayed in the table below:

Partial Autocorrelation Function
Time lag kPACF(k)T-STATP-value
00.6990974.19468.5e-05
1-0.105408-0.63240.734455
20.3348962.00940.02602
3-0.085686-0.51410.694843
40.0762020.45720.325133
5-0.053379-0.32030.624694
6-0.048231-0.28940.613026
7-0.278839-1.6730.948505
80.1448180.86890.195328
90.1302070.78120.219885
10-0.233864-1.40320.915436
11-0.112521-0.67510.748045
120.0091870.05510.478173
130.0740170.44410.329815
14-0.002719-0.01630.506463
15-0.035686-0.21410.584167
16-0.098429-0.59060.720753


Parameters (Session):
par1 = Default ; par2 = 1 ; par3 = 0 ; par4 = 2 ; par5 = 12 ;
Parameters (R input):
par1 = Default ; par2 = 1 ; par3 = 0 ; par4 = 2 ; par5 = 12 ;
R code (references can be found in the software module):
if (par1 == 'Default') {
par1 = 10*log10(length(x))
} else {
par1 <- as.numeric(par1)
}
par2 <- as.numeric(par2)
par3 <- as.numeric(par3)
par4 <- as.numeric(par4)
par5 <- as.numeric(par5)
if (par2 == 0) {
x <- log(x)
} else {
x <- (x ^ par2 - 1) / par2
}
if (par3 > 0) x <- diff(x,lag=1,difference=par3)
if (par4 > 0) x <- diff(x,lag=par5,difference=par4)
bitmap(file='pic1.png')
racf <- acf(x,par1,main='Autocorrelation',xlab='lags',ylab='ACF')
dev.off()
bitmap(file='pic2.png')
rpacf <- pacf(x,par1,main='Partial Autocorrelation',xlab='lags',ylab='PACF')
dev.off()
(myacf <- c(racf$acf))
(mypacf <- c(rpacf$acf))
lengthx <- length(x)
sqrtn <- sqrt(lengthx)
load(file='createtable')
a<-table.start()
a<-table.row.start(a)
a<-table.element(a,'Autocorrelation Function',4,TRUE)
a<-table.row.end(a)
a<-table.row.start(a)
a<-table.element(a,'Time lag k',header=TRUE)
a<-table.element(a,hyperlink('basics.htm','ACF(k)','click here for more information about the Autocorrelation Function'),header=TRUE)
a<-table.element(a,'T-STAT',header=TRUE)
a<-table.element(a,'P-value',header=TRUE)
a<-table.row.end(a)
for (i in 1:par1) {
a<-table.row.start(a)
a<-table.element(a,i-1,header=TRUE)
a<-table.element(a,round(myacf[i],6))
mytstat <- myacf[i]*sqrtn
a<-table.element(a,round(mytstat,4))
a<-table.element(a,round(1-pt(mytstat,lengthx),6))
a<-table.row.end(a)
}
a<-table.end(a)
table.save(a,file='mytable.tab')
a<-table.start()
a<-table.row.start(a)
a<-table.element(a,'Partial Autocorrelation Function',4,TRUE)
a<-table.row.end(a)
a<-table.row.start(a)
a<-table.element(a,'Time lag k',header=TRUE)
a<-table.element(a,hyperlink('basics.htm','PACF(k)','click here for more information about the Partial Autocorrelation Function'),header=TRUE)
a<-table.element(a,'T-STAT',header=TRUE)
a<-table.element(a,'P-value',header=TRUE)
a<-table.row.end(a)
for (i in 1:par1) {
a<-table.row.start(a)
a<-table.element(a,i-1,header=TRUE)
a<-table.element(a,round(mypacf[i],6))
mytstat <- mypacf[i]*sqrtn
a<-table.element(a,round(mytstat,4))
a<-table.element(a,round(1-pt(mytstat,lengthx),6))
a<-table.row.end(a)
}
a<-table.end(a)
table.save(a,file='mytable1.tab')