Free Statistics

of Irreproducible Research!

Author's title

Author*Unverified author*
R Software Modulerwasp_arimabackwardselection.wasp
Title produced by softwareARIMA Backward Selection
Date of computationThu, 06 Dec 2007 05:49:51 -0700
Cite this page as followsStatistical Computations at FreeStatistics.org, Office for Research Development and Education, URL https://freestatistics.org/blog/index.php?v=date/2007/Dec/06/t1196944731lbco9keblfv4him.htm/, Retrieved Fri, 03 May 2024 14:32:27 +0000
Statistical Computations at FreeStatistics.org, Office for Research Development and Education, URL https://freestatistics.org/blog/index.php?pk=2582, Retrieved Fri, 03 May 2024 14:32:27 +0000
QR Codes:

Original text written by user:
IsPrivate?No (this computation is public)
User-defined keywordsSar=0 Sma=0 -->door een outlier
Estimated Impact236
Family? (F = Feedback message, R = changed R code, M = changed R Module, P = changed Parameters, D = changed Data)
-       [ARIMA Backward Selection] [Exogeen:totale ui...] [2007-12-06 12:49:51] [89d26cd0a44959d9c8b169f34617598a] [Current]
Feedback Forum

Post a new message
Dataseries X:
15023.6
12083
15761.3
16943
15070.3
13659.6
14768.9
14725.1
15998.1
15370.6
14956.9
15469.7
15101.8
11703.7
16283.6
16726.5
14968.9
14861
14583.3
15305.8
17903.9
16379.4
15420.3
17870.5
15912.8
13866.5
17823.2
17872
17420.4
16704.4
15991.2
16583.6
19123.5
17838.7
17209.4
18586.5
16258.1
15141.6
19202.1
17746.5
19090.1
18040.3
17515.5
17751.8
21072.4
17170
19439.5
19795.4
17574.9
16165.4
19464.6
19932.1
19961.2
17343.4
18924.2
18574.1
21350.6
18840.1
20304.8
21132.4
19753.9


Summary of compuational transaction
Raw Inputview raw input (R code)
Raw Outputview raw output of R engine
Computing time2 seconds
R Server'Gwilym Jenkins' @ 72.249.127.135

\begin{tabular}{lllllllll}
\hline
Summary of compuational transaction \tabularnewline
Raw Input & view raw input (R code)  \tabularnewline
Raw Output & view raw output of R engine  \tabularnewline
Computing time & 2 seconds \tabularnewline
R Server & 'Gwilym Jenkins' @ 72.249.127.135 \tabularnewline
\hline
\end{tabular}
%Source: https://freestatistics.org/blog/index.php?pk=2582&T=0

[TABLE]
[ROW][C]Summary of compuational transaction[/C][/ROW]
[ROW][C]Raw Input[/C][C]view raw input (R code) [/C][/ROW]
[ROW][C]Raw Output[/C][C]view raw output of R engine [/C][/ROW]
[ROW][C]Computing time[/C][C]2 seconds[/C][/ROW]
[ROW][C]R Server[/C][C]'Gwilym Jenkins' @ 72.249.127.135[/C][/ROW]
[/TABLE]
Source: https://freestatistics.org/blog/index.php?pk=2582&T=0

Globally Unique Identifier (entire table): ba.freestatistics.org/blog/index.php?pk=2582&T=0

As an alternative you can also use a QR Code:  

The GUIDs for individual cells are displayed in the table below:

Summary of compuational transaction
Raw Inputview raw input (R code)
Raw Outputview raw output of R engine
Computing time2 seconds
R Server'Gwilym Jenkins' @ 72.249.127.135


ARIMA Parameter Estimation and Backward Selection
Iterationar1ar2ar3ma1
Estimates ( 1 )-0.8566-0.5894-0.0622-0.2075
(p-val)(0.0768 )(0.2091 )(0.8456 )(0.655 )
Estimates ( 2 )-0.7717-0.50460-0.285
(p-val)(1e-04 )(0.0014 )(NA )(0.1463 )
Estimates ( 3 )-0.9413-0.600800
(p-val)(0 )(0 )(NA )(NA )

\begin{tabular}{lllllllll}
\hline
ARIMA Parameter Estimation and Backward Selection \tabularnewline
Iteration & ar1 & ar2 & ar3 & ma1 \tabularnewline
Estimates ( 1 ) & -0.8566 & -0.5894 & -0.0622 & -0.2075 \tabularnewline
(p-val) & (0.0768 ) & (0.2091 ) & (0.8456 ) & (0.655 ) \tabularnewline
Estimates ( 2 ) & -0.7717 & -0.5046 & 0 & -0.285 \tabularnewline
(p-val) & (1e-04 ) & (0.0014 ) & (NA ) & (0.1463 ) \tabularnewline
Estimates ( 3 ) & -0.9413 & -0.6008 & 0 & 0 \tabularnewline
(p-val) & (0 ) & (0 ) & (NA ) & (NA ) \tabularnewline
\hline
\end{tabular}
%Source: https://freestatistics.org/blog/index.php?pk=2582&T=1

[TABLE]
[ROW][C]ARIMA Parameter Estimation and Backward Selection[/C][/ROW]
[ROW][C]Iteration[/C][C]ar1[/C][C]ar2[/C][C]ar3[/C][C]ma1[/C][/ROW]
[ROW][C]Estimates ( 1 )[/C][C]-0.8566[/C][C]-0.5894[/C][C]-0.0622[/C][C]-0.2075[/C][/ROW]
[ROW][C](p-val)[/C][C](0.0768 )[/C][C](0.2091 )[/C][C](0.8456 )[/C][C](0.655 )[/C][/ROW]
[ROW][C]Estimates ( 2 )[/C][C]-0.7717[/C][C]-0.5046[/C][C]0[/C][C]-0.285[/C][/ROW]
[ROW][C](p-val)[/C][C](1e-04 )[/C][C](0.0014 )[/C][C](NA )[/C][C](0.1463 )[/C][/ROW]
[ROW][C]Estimates ( 3 )[/C][C]-0.9413[/C][C]-0.6008[/C][C]0[/C][C]0[/C][/ROW]
[ROW][C](p-val)[/C][C](0 )[/C][C](0 )[/C][C](NA )[/C][C](NA )[/C][/ROW]
[/TABLE]
Source: https://freestatistics.org/blog/index.php?pk=2582&T=1

Globally Unique Identifier (entire table): ba.freestatistics.org/blog/index.php?pk=2582&T=1

As an alternative you can also use a QR Code:  

The GUIDs for individual cells are displayed in the table below:

ARIMA Parameter Estimation and Backward Selection
Iterationar1ar2ar3ma1
Estimates ( 1 )-0.8566-0.5894-0.0622-0.2075
(p-val)(0.0768 )(0.2091 )(0.8456 )(0.655 )
Estimates ( 2 )-0.7717-0.50460-0.285
(p-val)(1e-04 )(0.0014 )(NA )(0.1463 )
Estimates ( 3 )-0.9413-0.600800
(p-val)(0 )(0 )(NA )(NA )


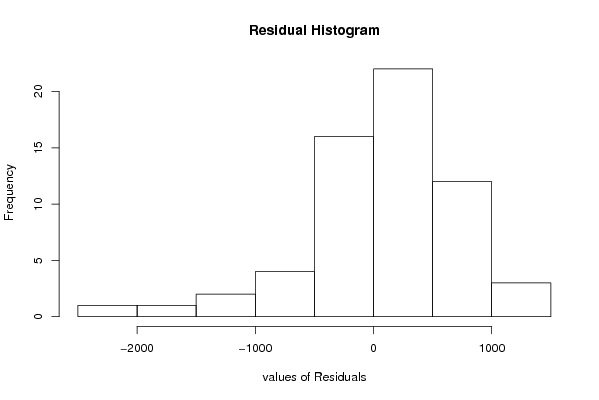
Estimated ARIMA Residuals
Value
-52.3790054485179
-289.481355589424
494.54194663302
-161.125204916602
-45.2267527881661
1005.83628177171
-36.925832079854
342.83495958438
1314.25091544284
886.810954721906
-316.233471096358
973.745937230418
-92.417005828337
1076.25126575013
-75.5456237596632
-214.411641621588
626.287476189197
379.357831457496
-137.635148298157
-812.262311443738
-609.835033108426
-44.651415815144
472.685585828795
-562.929480961792
-1192.81827342019
-237.703233795914
566.534266798622
-793.652665734495
460.448716456503
423.638176953718
957.424373075894
-106.311946635185
570.668466212301
-2032.19598908302
693.606967808613
92.597484465634
809.012710462503
-494.504523392054
-1073.88309892307
881.714920620533
36.6734655900618
-1601.5256027092
-224.158321349372
183.388509822322
118.159975774703
709.77497795103
197.046298972702
609.162452013902
973.491760730554

\begin{tabular}{lllllllll}
\hline
Estimated ARIMA Residuals \tabularnewline
Value \tabularnewline
-52.3790054485179 \tabularnewline
-289.481355589424 \tabularnewline
494.54194663302 \tabularnewline
-161.125204916602 \tabularnewline
-45.2267527881661 \tabularnewline
1005.83628177171 \tabularnewline
-36.925832079854 \tabularnewline
342.83495958438 \tabularnewline
1314.25091544284 \tabularnewline
886.810954721906 \tabularnewline
-316.233471096358 \tabularnewline
973.745937230418 \tabularnewline
-92.417005828337 \tabularnewline
1076.25126575013 \tabularnewline
-75.5456237596632 \tabularnewline
-214.411641621588 \tabularnewline
626.287476189197 \tabularnewline
379.357831457496 \tabularnewline
-137.635148298157 \tabularnewline
-812.262311443738 \tabularnewline
-609.835033108426 \tabularnewline
-44.651415815144 \tabularnewline
472.685585828795 \tabularnewline
-562.929480961792 \tabularnewline
-1192.81827342019 \tabularnewline
-237.703233795914 \tabularnewline
566.534266798622 \tabularnewline
-793.652665734495 \tabularnewline
460.448716456503 \tabularnewline
423.638176953718 \tabularnewline
957.424373075894 \tabularnewline
-106.311946635185 \tabularnewline
570.668466212301 \tabularnewline
-2032.19598908302 \tabularnewline
693.606967808613 \tabularnewline
92.597484465634 \tabularnewline
809.012710462503 \tabularnewline
-494.504523392054 \tabularnewline
-1073.88309892307 \tabularnewline
881.714920620533 \tabularnewline
36.6734655900618 \tabularnewline
-1601.5256027092 \tabularnewline
-224.158321349372 \tabularnewline
183.388509822322 \tabularnewline
118.159975774703 \tabularnewline
709.77497795103 \tabularnewline
197.046298972702 \tabularnewline
609.162452013902 \tabularnewline
973.491760730554 \tabularnewline
\hline
\end{tabular}
%Source: https://freestatistics.org/blog/index.php?pk=2582&T=2

[TABLE]
[ROW][C]Estimated ARIMA Residuals[/C][/ROW]
[ROW][C]Value[/C][/ROW]
[ROW][C]-52.3790054485179[/C][/ROW]
[ROW][C]-289.481355589424[/C][/ROW]
[ROW][C]494.54194663302[/C][/ROW]
[ROW][C]-161.125204916602[/C][/ROW]
[ROW][C]-45.2267527881661[/C][/ROW]
[ROW][C]1005.83628177171[/C][/ROW]
[ROW][C]-36.925832079854[/C][/ROW]
[ROW][C]342.83495958438[/C][/ROW]
[ROW][C]1314.25091544284[/C][/ROW]
[ROW][C]886.810954721906[/C][/ROW]
[ROW][C]-316.233471096358[/C][/ROW]
[ROW][C]973.745937230418[/C][/ROW]
[ROW][C]-92.417005828337[/C][/ROW]
[ROW][C]1076.25126575013[/C][/ROW]
[ROW][C]-75.5456237596632[/C][/ROW]
[ROW][C]-214.411641621588[/C][/ROW]
[ROW][C]626.287476189197[/C][/ROW]
[ROW][C]379.357831457496[/C][/ROW]
[ROW][C]-137.635148298157[/C][/ROW]
[ROW][C]-812.262311443738[/C][/ROW]
[ROW][C]-609.835033108426[/C][/ROW]
[ROW][C]-44.651415815144[/C][/ROW]
[ROW][C]472.685585828795[/C][/ROW]
[ROW][C]-562.929480961792[/C][/ROW]
[ROW][C]-1192.81827342019[/C][/ROW]
[ROW][C]-237.703233795914[/C][/ROW]
[ROW][C]566.534266798622[/C][/ROW]
[ROW][C]-793.652665734495[/C][/ROW]
[ROW][C]460.448716456503[/C][/ROW]
[ROW][C]423.638176953718[/C][/ROW]
[ROW][C]957.424373075894[/C][/ROW]
[ROW][C]-106.311946635185[/C][/ROW]
[ROW][C]570.668466212301[/C][/ROW]
[ROW][C]-2032.19598908302[/C][/ROW]
[ROW][C]693.606967808613[/C][/ROW]
[ROW][C]92.597484465634[/C][/ROW]
[ROW][C]809.012710462503[/C][/ROW]
[ROW][C]-494.504523392054[/C][/ROW]
[ROW][C]-1073.88309892307[/C][/ROW]
[ROW][C]881.714920620533[/C][/ROW]
[ROW][C]36.6734655900618[/C][/ROW]
[ROW][C]-1601.5256027092[/C][/ROW]
[ROW][C]-224.158321349372[/C][/ROW]
[ROW][C]183.388509822322[/C][/ROW]
[ROW][C]118.159975774703[/C][/ROW]
[ROW][C]709.77497795103[/C][/ROW]
[ROW][C]197.046298972702[/C][/ROW]
[ROW][C]609.162452013902[/C][/ROW]
[ROW][C]973.491760730554[/C][/ROW]
[/TABLE]
Source: https://freestatistics.org/blog/index.php?pk=2582&T=2

Globally Unique Identifier (entire table): ba.freestatistics.org/blog/index.php?pk=2582&T=2

As an alternative you can also use a QR Code:  

The GUIDs for individual cells are displayed in the table below:

Estimated ARIMA Residuals
Value
-52.3790054485179
-289.481355589424
494.54194663302
-161.125204916602
-45.2267527881661
1005.83628177171
-36.925832079854
342.83495958438
1314.25091544284
886.810954721906
-316.233471096358
973.745937230418
-92.417005828337
1076.25126575013
-75.5456237596632
-214.411641621588
626.287476189197
379.357831457496
-137.635148298157
-812.262311443738
-609.835033108426
-44.651415815144
472.685585828795
-562.929480961792
-1192.81827342019
-237.703233795914
566.534266798622
-793.652665734495
460.448716456503
423.638176953718
957.424373075894
-106.311946635185
570.668466212301
-2032.19598908302
693.606967808613
92.597484465634
809.012710462503
-494.504523392054
-1073.88309892307
881.714920620533
36.6734655900618
-1601.5256027092
-224.158321349372
183.388509822322
118.159975774703
709.77497795103
197.046298972702
609.162452013902
973.491760730554


Parameters (Session):
par1 = FALSE ; par2 = 1 ; par3 = 1 ; par4 = 1 ; par5 = 12 ; par6 = 3 ; par7 = 1 ; par8 = 0 ; par9 = 0 ;
Parameters (R input):
par1 = FALSE ; par2 = 1 ; par3 = 1 ; par4 = 1 ; par5 = 12 ; par6 = 3 ; par7 = 1 ; par8 = 0 ; par9 = 0 ;
R code (references can be found in the software module):
library(lattice)
if (par1 == 'TRUE') par1 <- TRUE
if (par1 == 'FALSE') par1 <- FALSE
par2 <- as.numeric(par2) #Box-Cox lambda transformation parameter
par3 <- as.numeric(par3) #degree of non-seasonal differencing
par4 <- as.numeric(par4) #degree of seasonal differencing
par5 <- as.numeric(par5) #seasonal period
par6 <- as.numeric(par6) #degree (p) of the non-seasonal AR(p) polynomial
par7 <- as.numeric(par7) #degree (q) of the non-seasonal MA(q) polynomial
par8 <- as.numeric(par8) #degree (P) of the seasonal AR(P) polynomial
par9 <- as.numeric(par9) #degree (Q) of the seasonal MA(Q) polynomial
armaGR <- function(arima.out, names, n){
try1 <- arima.out$coef
try2 <- sqrt(diag(arima.out$var.coef))
try.data.frame <- data.frame(matrix(NA,ncol=4,nrow=length(names)))
dimnames(try.data.frame) <- list(names,c('coef','std','tstat','pv'))
try.data.frame[,1] <- try1
for(i in 1:length(try2)) try.data.frame[which(rownames(try.data.frame)==names(try2)[i]),2] <- try2[i]
try.data.frame[,3] <- try.data.frame[,1] / try.data.frame[,2]
try.data.frame[,4] <- round((1-pt(abs(try.data.frame[,3]),df=n-(length(try2)+1)))*2,5)
vector <- rep(NA,length(names))
vector[is.na(try.data.frame[,4])] <- 0
maxi <- which.max(try.data.frame[,4])
continue <- max(try.data.frame[,4],na.rm=TRUE) > .05
vector[maxi] <- 0
list(summary=try.data.frame,next.vector=vector,continue=continue)
}
arimaSelect <- function(series, order=c(13,0,0), seasonal=list(order=c(2,0,0),period=12), include.mean=F){
nrc <- order[1]+order[3]+seasonal$order[1]+seasonal$order[3]
coeff <- matrix(NA, nrow=nrc, ncol=nrc)
pval <- matrix(NA, nrow=nrc, ncol=nrc)
mylist <- rep(list(NULL), nrc)
names <- NULL
if(order[1] > 0) names <- paste('ar',1:order[1],sep='')
if(order[3] > 0) names <- c( names , paste('ma',1:order[3],sep='') )
if(seasonal$order[1] > 0) names <- c(names, paste('sar',1:seasonal$order[1],sep=''))
if(seasonal$order[3] > 0) names <- c(names, paste('sma',1:seasonal$order[3],sep=''))
arima.out <- arima(series, order=order, seasonal=seasonal, include.mean=include.mean, method='ML')
mylist[[1]] <- arima.out
last.arma <- armaGR(arima.out, names, length(series))
mystop <- FALSE
i <- 1
coeff[i,] <- last.arma[[1]][,1]
pval [i,] <- last.arma[[1]][,4]
i <- 2
aic <- arima.out$aic
while(!mystop){
mylist[[i]] <- arima.out
arima.out <- arima(series, order=order, seasonal=seasonal, include.mean=include.mean, method='ML', fixed=last.arma$next.vector)
aic <- c(aic, arima.out$aic)
last.arma <- armaGR(arima.out, names, length(series))
mystop <- !last.arma$continue
coeff[i,] <- last.arma[[1]][,1]
pval [i,] <- last.arma[[1]][,4]
i <- i+1
}
list(coeff, pval, mylist, aic=aic)
}
arimaSelectplot <- function(arimaSelect.out,noms,choix){
noms <- names(arimaSelect.out[[3]][[1]]$coef)
coeff <- arimaSelect.out[[1]]
k <- min(which(is.na(coeff[,1])))-1
coeff <- coeff[1:k,]
pval <- arimaSelect.out[[2]][1:k,]
aic <- arimaSelect.out$aic[1:k]
coeff[coeff==0] <- NA
n <- ncol(coeff)
if(missing(choix)) choix <- k
layout(matrix(c(1,1,1,2,
3,3,3,2,
3,3,3,4,
5,6,7,7),nr=4),
widths=c(10,35,45,15),
heights=c(30,30,15,15))
couleurs <- rainbow(75)[1:50]#(50)
ticks <- pretty(coeff)
par(mar=c(1,1,3,1))
plot(aic,k:1-.5,type='o',pch=21,bg='blue',cex=2,axes=F,lty=2,xpd=NA)
points(aic[choix],k-choix+.5,pch=21,cex=4,bg=2,xpd=NA)
title('aic',line=2)
par(mar=c(3,0,0,0))
plot(0,axes=F,xlab='',ylab='',xlim=range(ticks),ylim=c(.1,1))
rect(xleft = min(ticks) + (0:49)/50*(max(ticks)-min(ticks)),
xright = min(ticks) + (1:50)/50*(max(ticks)-min(ticks)),
ytop = rep(1,50),
ybottom= rep(0,50),col=couleurs,border=NA)
axis(1,ticks)
rect(xleft=min(ticks),xright=max(ticks),ytop=1,ybottom=0)
text(mean(coeff,na.rm=T),.5,'coefficients',cex=2,font=2)
par(mar=c(1,1,3,1))
image(1:n,1:k,t(coeff[k:1,]),axes=F,col=couleurs,zlim=range(ticks))
for(i in 1:n) for(j in 1:k) if(!is.na(coeff[j,i])) {
if(pval[j,i]<.01) symb = 'green'
else if( (pval[j,i]<.05) & (pval[j,i]>=.01)) symb = 'orange'
else if( (pval[j,i]<.1) & (pval[j,i]>=.05)) symb = 'red'
else symb = 'black'
polygon(c(i+.5 ,i+.2 ,i+.5 ,i+.5),
c(k-j+0.5,k-j+0.5,k-j+0.8,k-j+0.5),
col=symb)
if(j==choix) {
rect(xleft=i-.5,
xright=i+.5,
ybottom=k-j+1.5,
ytop=k-j+.5,
lwd=4)
text(i,
k-j+1,
round(coeff[j,i],2),
cex=1.2,
font=2)
}
else{
rect(xleft=i-.5,xright=i+.5,ybottom=k-j+1.5,ytop=k-j+.5)
text(i,k-j+1,round(coeff[j,i],2),cex=1.2,font=1)
}
}
axis(3,1:n,noms)
par(mar=c(0.5,0,0,0.5))
plot(0,axes=F,xlab='',ylab='',type='n',xlim=c(0,8),ylim=c(-.2,.8))
cols <- c('green','orange','red','black')
niv <- c('0','0.01','0.05','0.1')
for(i in 0:3){
polygon(c(1+2*i ,1+2*i ,1+2*i-.5 ,1+2*i),
c(.4 ,.7 , .4 , .4),
col=cols[i+1])
text(2*i,0.5,niv[i+1],cex=1.5)
}
text(8,.5,1,cex=1.5)
text(4,0,'p-value',cex=2)
box()
residus <- arimaSelect.out[[3]][[choix]]$res
par(mar=c(1,2,4,1))
acf(residus,main='')
title('acf',line=.5)
par(mar=c(1,2,4,1))
pacf(residus,main='')
title('pacf',line=.5)
par(mar=c(2,2,4,1))
qqnorm(residus,main='')
title('qq-norm',line=.5)
residus
}
if (par2 == 0) x <- log(x)
if (par2 != 0) x <- x^par2
(selection <- arimaSelect(x, order=c(par6,par3,par7), seasonal=list(order=c(par8,par4,par9), period=par5)))
bitmap(file='test1.png')
resid <- arimaSelectplot(selection)
dev.off()
resid
bitmap(file='test2.png')
acf(resid,length(resid)/2, main='Residual Autocorrelation Function')
dev.off()
bitmap(file='test3.png')
pacf(resid,length(resid)/2, main='Residual Partial Autocorrelation Function')
dev.off()
bitmap(file='test4.png')
cpgram(resid, main='Residual Cumulative Periodogram')
dev.off()
bitmap(file='test5.png')
hist(resid, main='Residual Histogram', xlab='values of Residuals')
dev.off()
bitmap(file='test6.png')
densityplot(~resid,col='black',main='Residual Density Plot', xlab='values of Residuals')
dev.off()
bitmap(file='test7.png')
qqnorm(resid, main='Residual Normal Q-Q Plot')
dev.off()
ncols <- length(selection[[1]][1,])
nrows <- length(selection[[2]][,1])-1
load(file='createtable')
a<-table.start()
a<-table.row.start(a)
a<-table.element(a,'ARIMA Parameter Estimation and Backward Selection', ncols+1,TRUE)
a<-table.row.end(a)
a<-table.row.start(a)
a<-table.element(a,'Iteration', header=TRUE)
for (i in 1:ncols) {
a<-table.element(a,names(selection[[3]][[1]]$coef)[i],header=TRUE)
}
a<-table.row.end(a)
for (j in 1:nrows) {
a<-table.row.start(a)
mydum <- 'Estimates ('
mydum <- paste(mydum,j)
mydum <- paste(mydum,')')
a<-table.element(a,mydum, header=TRUE)
for (i in 1:ncols) {
a<-table.element(a,round(selection[[1]][j,i],4))
}
a<-table.row.end(a)
a<-table.row.start(a)
a<-table.element(a,'(p-val)', header=TRUE)
for (i in 1:ncols) {
mydum <- '('
mydum <- paste(mydum,round(selection[[2]][j,i],4),sep='')
mydum <- paste(mydum,')')
a<-table.element(a,mydum)
}
a<-table.row.end(a)
}
a<-table.end(a)
table.save(a,file='mytable.tab')
a<-table.start()
a<-table.row.start(a)
a<-table.element(a,'Estimated ARIMA Residuals', 1,TRUE)
a<-table.row.end(a)
a<-table.row.start(a)
a<-table.element(a,'Value', 1,TRUE)
a<-table.row.end(a)
for (i in (par4*par5+par3):length(resid)) {
a<-table.row.start(a)
a<-table.element(a,resid[i])
a<-table.row.end(a)
}
a<-table.end(a)
table.save(a,file='mytable1.tab')