Free Statistics

of Irreproducible Research!

Author's title

Author*Unverified author*
R Software Modulerwasp_autocorrelation.wasp
Title produced by software(Partial) Autocorrelation Function
Date of computationTue, 04 Dec 2007 14:01:21 -0700
Cite this page as followsStatistical Computations at FreeStatistics.org, Office for Research Development and Education, URL https://freestatistics.org/blog/index.php?v=date/2007/Dec/04/t119680142478bmjsb1wnwpf62.htm/, Retrieved Thu, 02 May 2024 03:55:15 +0000
Statistical Computations at FreeStatistics.org, Office for Research Development and Education, URL https://freestatistics.org/blog/index.php?pk=2447, Retrieved Thu, 02 May 2024 03:55:15 +0000
QR Codes:

Original text written by user:
IsPrivate?No (this computation is public)
User-defined keywords
Estimated Impact174
Family? (F = Feedback message, R = changed R code, M = changed R Module, P = changed Parameters, D = changed Data)
-       [(Partial) Autocorrelation Function] [Totaal invoer] [2007-12-04 21:01:21] [6bdd947de0ee04552c8f0fc807f31807] [Current]
Feedback Forum

Post a new message
Dataseries X:
9884.9
10174.5
11395.4
10760.2
10570.1
10536
9902.6
8889
10837.3
11624.1
10509
10984.9
10649.1
10855.7
11677.4
10760.2
10046.2
10772.8
9987.7
8638.7
11063.7
11855.7
10684.5
11337.4
10478
11123.9
12909.3
11339.9
10462.2
12733.5
10519.2
10414.9
12476.8
12384.6
12266.7
12919.9
11497.3
12142
13919.4
12656.8
12034.1
13199.7
10881.3
11301.2
13643.9
12517
13981.1
14275.7
13435
13565.7
16216.3
12970
14079.9
14235
12213.4
12581
14130.4
14210.8
14378.5
13142.8
13714.7
13621.9
15379.8
14441.8
15354.8
15537.8
14552.7


Summary of compuational transaction
Raw Inputview raw input (R code)
Raw Outputview raw output of R engine
Computing time4 seconds
R Server'Herman Ole Andreas Wold' @ 193.190.124.10:1001

\begin{tabular}{lllllllll}
\hline
Summary of compuational transaction \tabularnewline
Raw Input & view raw input (R code)  \tabularnewline
Raw Output & view raw output of R engine  \tabularnewline
Computing time & 4 seconds \tabularnewline
R Server & 'Herman Ole Andreas Wold' @ 193.190.124.10:1001 \tabularnewline
\hline
\end{tabular}
%Source: https://freestatistics.org/blog/index.php?pk=2447&T=0

[TABLE]
[ROW][C]Summary of compuational transaction[/C][/ROW]
[ROW][C]Raw Input[/C][C]view raw input (R code) [/C][/ROW]
[ROW][C]Raw Output[/C][C]view raw output of R engine [/C][/ROW]
[ROW][C]Computing time[/C][C]4 seconds[/C][/ROW]
[ROW][C]R Server[/C][C]'Herman Ole Andreas Wold' @ 193.190.124.10:1001[/C][/ROW]
[/TABLE]
Source: https://freestatistics.org/blog/index.php?pk=2447&T=0

Globally Unique Identifier (entire table): ba.freestatistics.org/blog/index.php?pk=2447&T=0

As an alternative you can also use a QR Code:  

The GUIDs for individual cells are displayed in the table below:

Summary of compuational transaction
Raw Inputview raw input (R code)
Raw Outputview raw output of R engine
Computing time4 seconds
R Server'Herman Ole Andreas Wold' @ 193.190.124.10:1001


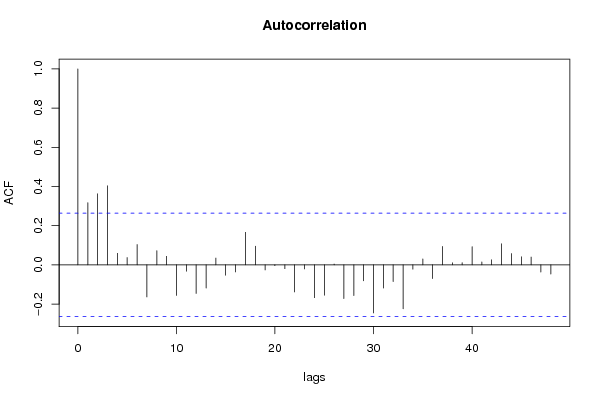
Autocorrelation Function
Time lag kACF(k)T-STATP-value
017.41620
10.3174272.35410.011083
20.3626622.68960.004726
30.4035452.99280.002067
40.0592310.43930.331093
50.0376520.27920.390555
60.1037250.76920.222519
7-0.16338-1.21170.884588
80.0721150.53480.297466
90.0439330.32580.372899
10-0.156215-1.15850.874172
11-0.0321-0.23810.59364
12-0.145959-1.08250.858115
13-0.118224-0.87680.807788
140.0345880.25650.399258
15-0.052749-0.39120.651419
16-0.03615-0.26810.605186
170.1662831.23320.111375
180.0953640.70720.241203
19-0.025815-0.19150.575561
20-0.004206-0.03120.512385
21-0.019764-0.14660.557999
22-0.13844-1.02670.845471
23-0.020648-0.15310.560573
24-0.167246-1.24030.889941
25-0.154838-1.14830.872095
260.0039380.02920.488403
27-0.172026-1.27580.896303
28-0.156391-1.15980.874435
29-0.081667-0.60570.726383
30-0.245501-1.82070.962952
31-0.118293-0.87730.807925
32-0.085363-0.63310.735343
33-0.224549-1.66530.94923
34-0.021975-0.1630.564431
350.030090.22320.412122
36-0.0698-0.51770.696611
370.0943210.69950.243594
380.0102930.07630.469715
390.0114360.08480.466359
400.092970.68950.24671
410.0149980.11120.455919
420.0261290.19380.423533
430.1072580.79540.214887
440.0575470.42680.335603
450.0411230.3050.380768
460.0397170.29450.384724
47-0.036554-0.27110.606333

\begin{tabular}{lllllllll}
\hline
Autocorrelation Function \tabularnewline
Time lag k & ACF(k) & T-STAT & P-value \tabularnewline
0 & 1 & 7.4162 & 0 \tabularnewline
1 & 0.317427 & 2.3541 & 0.011083 \tabularnewline
2 & 0.362662 & 2.6896 & 0.004726 \tabularnewline
3 & 0.403545 & 2.9928 & 0.002067 \tabularnewline
4 & 0.059231 & 0.4393 & 0.331093 \tabularnewline
5 & 0.037652 & 0.2792 & 0.390555 \tabularnewline
6 & 0.103725 & 0.7692 & 0.222519 \tabularnewline
7 & -0.16338 & -1.2117 & 0.884588 \tabularnewline
8 & 0.072115 & 0.5348 & 0.297466 \tabularnewline
9 & 0.043933 & 0.3258 & 0.372899 \tabularnewline
10 & -0.156215 & -1.1585 & 0.874172 \tabularnewline
11 & -0.0321 & -0.2381 & 0.59364 \tabularnewline
12 & -0.145959 & -1.0825 & 0.858115 \tabularnewline
13 & -0.118224 & -0.8768 & 0.807788 \tabularnewline
14 & 0.034588 & 0.2565 & 0.399258 \tabularnewline
15 & -0.052749 & -0.3912 & 0.651419 \tabularnewline
16 & -0.03615 & -0.2681 & 0.605186 \tabularnewline
17 & 0.166283 & 1.2332 & 0.111375 \tabularnewline
18 & 0.095364 & 0.7072 & 0.241203 \tabularnewline
19 & -0.025815 & -0.1915 & 0.575561 \tabularnewline
20 & -0.004206 & -0.0312 & 0.512385 \tabularnewline
21 & -0.019764 & -0.1466 & 0.557999 \tabularnewline
22 & -0.13844 & -1.0267 & 0.845471 \tabularnewline
23 & -0.020648 & -0.1531 & 0.560573 \tabularnewline
24 & -0.167246 & -1.2403 & 0.889941 \tabularnewline
25 & -0.154838 & -1.1483 & 0.872095 \tabularnewline
26 & 0.003938 & 0.0292 & 0.488403 \tabularnewline
27 & -0.172026 & -1.2758 & 0.896303 \tabularnewline
28 & -0.156391 & -1.1598 & 0.874435 \tabularnewline
29 & -0.081667 & -0.6057 & 0.726383 \tabularnewline
30 & -0.245501 & -1.8207 & 0.962952 \tabularnewline
31 & -0.118293 & -0.8773 & 0.807925 \tabularnewline
32 & -0.085363 & -0.6331 & 0.735343 \tabularnewline
33 & -0.224549 & -1.6653 & 0.94923 \tabularnewline
34 & -0.021975 & -0.163 & 0.564431 \tabularnewline
35 & 0.03009 & 0.2232 & 0.412122 \tabularnewline
36 & -0.0698 & -0.5177 & 0.696611 \tabularnewline
37 & 0.094321 & 0.6995 & 0.243594 \tabularnewline
38 & 0.010293 & 0.0763 & 0.469715 \tabularnewline
39 & 0.011436 & 0.0848 & 0.466359 \tabularnewline
40 & 0.09297 & 0.6895 & 0.24671 \tabularnewline
41 & 0.014998 & 0.1112 & 0.455919 \tabularnewline
42 & 0.026129 & 0.1938 & 0.423533 \tabularnewline
43 & 0.107258 & 0.7954 & 0.214887 \tabularnewline
44 & 0.057547 & 0.4268 & 0.335603 \tabularnewline
45 & 0.041123 & 0.305 & 0.380768 \tabularnewline
46 & 0.039717 & 0.2945 & 0.384724 \tabularnewline
47 & -0.036554 & -0.2711 & 0.606333 \tabularnewline
\hline
\end{tabular}
%Source: https://freestatistics.org/blog/index.php?pk=2447&T=1

[TABLE]
[ROW][C]Autocorrelation Function[/C][/ROW]
[ROW][C]Time lag k[/C][C]ACF(k)[/C][C]T-STAT[/C][C]P-value[/C][/ROW]
[ROW][C]0[/C][C]1[/C][C]7.4162[/C][C]0[/C][/ROW]
[ROW][C]1[/C][C]0.317427[/C][C]2.3541[/C][C]0.011083[/C][/ROW]
[ROW][C]2[/C][C]0.362662[/C][C]2.6896[/C][C]0.004726[/C][/ROW]
[ROW][C]3[/C][C]0.403545[/C][C]2.9928[/C][C]0.002067[/C][/ROW]
[ROW][C]4[/C][C]0.059231[/C][C]0.4393[/C][C]0.331093[/C][/ROW]
[ROW][C]5[/C][C]0.037652[/C][C]0.2792[/C][C]0.390555[/C][/ROW]
[ROW][C]6[/C][C]0.103725[/C][C]0.7692[/C][C]0.222519[/C][/ROW]
[ROW][C]7[/C][C]-0.16338[/C][C]-1.2117[/C][C]0.884588[/C][/ROW]
[ROW][C]8[/C][C]0.072115[/C][C]0.5348[/C][C]0.297466[/C][/ROW]
[ROW][C]9[/C][C]0.043933[/C][C]0.3258[/C][C]0.372899[/C][/ROW]
[ROW][C]10[/C][C]-0.156215[/C][C]-1.1585[/C][C]0.874172[/C][/ROW]
[ROW][C]11[/C][C]-0.0321[/C][C]-0.2381[/C][C]0.59364[/C][/ROW]
[ROW][C]12[/C][C]-0.145959[/C][C]-1.0825[/C][C]0.858115[/C][/ROW]
[ROW][C]13[/C][C]-0.118224[/C][C]-0.8768[/C][C]0.807788[/C][/ROW]
[ROW][C]14[/C][C]0.034588[/C][C]0.2565[/C][C]0.399258[/C][/ROW]
[ROW][C]15[/C][C]-0.052749[/C][C]-0.3912[/C][C]0.651419[/C][/ROW]
[ROW][C]16[/C][C]-0.03615[/C][C]-0.2681[/C][C]0.605186[/C][/ROW]
[ROW][C]17[/C][C]0.166283[/C][C]1.2332[/C][C]0.111375[/C][/ROW]
[ROW][C]18[/C][C]0.095364[/C][C]0.7072[/C][C]0.241203[/C][/ROW]
[ROW][C]19[/C][C]-0.025815[/C][C]-0.1915[/C][C]0.575561[/C][/ROW]
[ROW][C]20[/C][C]-0.004206[/C][C]-0.0312[/C][C]0.512385[/C][/ROW]
[ROW][C]21[/C][C]-0.019764[/C][C]-0.1466[/C][C]0.557999[/C][/ROW]
[ROW][C]22[/C][C]-0.13844[/C][C]-1.0267[/C][C]0.845471[/C][/ROW]
[ROW][C]23[/C][C]-0.020648[/C][C]-0.1531[/C][C]0.560573[/C][/ROW]
[ROW][C]24[/C][C]-0.167246[/C][C]-1.2403[/C][C]0.889941[/C][/ROW]
[ROW][C]25[/C][C]-0.154838[/C][C]-1.1483[/C][C]0.872095[/C][/ROW]
[ROW][C]26[/C][C]0.003938[/C][C]0.0292[/C][C]0.488403[/C][/ROW]
[ROW][C]27[/C][C]-0.172026[/C][C]-1.2758[/C][C]0.896303[/C][/ROW]
[ROW][C]28[/C][C]-0.156391[/C][C]-1.1598[/C][C]0.874435[/C][/ROW]
[ROW][C]29[/C][C]-0.081667[/C][C]-0.6057[/C][C]0.726383[/C][/ROW]
[ROW][C]30[/C][C]-0.245501[/C][C]-1.8207[/C][C]0.962952[/C][/ROW]
[ROW][C]31[/C][C]-0.118293[/C][C]-0.8773[/C][C]0.807925[/C][/ROW]
[ROW][C]32[/C][C]-0.085363[/C][C]-0.6331[/C][C]0.735343[/C][/ROW]
[ROW][C]33[/C][C]-0.224549[/C][C]-1.6653[/C][C]0.94923[/C][/ROW]
[ROW][C]34[/C][C]-0.021975[/C][C]-0.163[/C][C]0.564431[/C][/ROW]
[ROW][C]35[/C][C]0.03009[/C][C]0.2232[/C][C]0.412122[/C][/ROW]
[ROW][C]36[/C][C]-0.0698[/C][C]-0.5177[/C][C]0.696611[/C][/ROW]
[ROW][C]37[/C][C]0.094321[/C][C]0.6995[/C][C]0.243594[/C][/ROW]
[ROW][C]38[/C][C]0.010293[/C][C]0.0763[/C][C]0.469715[/C][/ROW]
[ROW][C]39[/C][C]0.011436[/C][C]0.0848[/C][C]0.466359[/C][/ROW]
[ROW][C]40[/C][C]0.09297[/C][C]0.6895[/C][C]0.24671[/C][/ROW]
[ROW][C]41[/C][C]0.014998[/C][C]0.1112[/C][C]0.455919[/C][/ROW]
[ROW][C]42[/C][C]0.026129[/C][C]0.1938[/C][C]0.423533[/C][/ROW]
[ROW][C]43[/C][C]0.107258[/C][C]0.7954[/C][C]0.214887[/C][/ROW]
[ROW][C]44[/C][C]0.057547[/C][C]0.4268[/C][C]0.335603[/C][/ROW]
[ROW][C]45[/C][C]0.041123[/C][C]0.305[/C][C]0.380768[/C][/ROW]
[ROW][C]46[/C][C]0.039717[/C][C]0.2945[/C][C]0.384724[/C][/ROW]
[ROW][C]47[/C][C]-0.036554[/C][C]-0.2711[/C][C]0.606333[/C][/ROW]
[/TABLE]
Source: https://freestatistics.org/blog/index.php?pk=2447&T=1

Globally Unique Identifier (entire table): ba.freestatistics.org/blog/index.php?pk=2447&T=1

As an alternative you can also use a QR Code:  

The GUIDs for individual cells are displayed in the table below:

Autocorrelation Function
Time lag kACF(k)T-STATP-value
017.41620
10.3174272.35410.011083
20.3626622.68960.004726
30.4035452.99280.002067
40.0592310.43930.331093
50.0376520.27920.390555
60.1037250.76920.222519
7-0.16338-1.21170.884588
80.0721150.53480.297466
90.0439330.32580.372899
10-0.156215-1.15850.874172
11-0.0321-0.23810.59364
12-0.145959-1.08250.858115
13-0.118224-0.87680.807788
140.0345880.25650.399258
15-0.052749-0.39120.651419
16-0.03615-0.26810.605186
170.1662831.23320.111375
180.0953640.70720.241203
19-0.025815-0.19150.575561
20-0.004206-0.03120.512385
21-0.019764-0.14660.557999
22-0.13844-1.02670.845471
23-0.020648-0.15310.560573
24-0.167246-1.24030.889941
25-0.154838-1.14830.872095
260.0039380.02920.488403
27-0.172026-1.27580.896303
28-0.156391-1.15980.874435
29-0.081667-0.60570.726383
30-0.245501-1.82070.962952
31-0.118293-0.87730.807925
32-0.085363-0.63310.735343
33-0.224549-1.66530.94923
34-0.021975-0.1630.564431
350.030090.22320.412122
36-0.0698-0.51770.696611
370.0943210.69950.243594
380.0102930.07630.469715
390.0114360.08480.466359
400.092970.68950.24671
410.0149980.11120.455919
420.0261290.19380.423533
430.1072580.79540.214887
440.0575470.42680.335603
450.0411230.3050.380768
460.0397170.29450.384724
47-0.036554-0.27110.606333


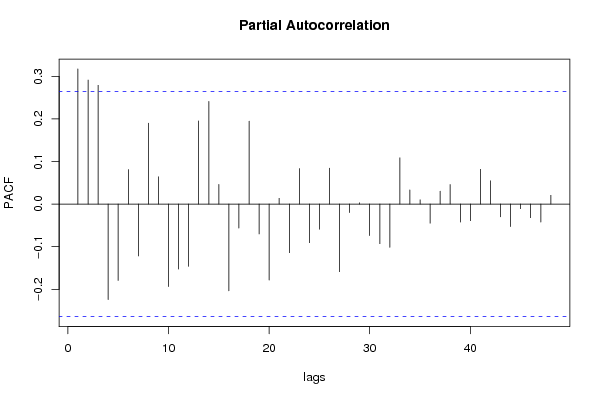
Partial Autocorrelation Function
Time lag kPACF(k)T-STATP-value
00.3174272.35410.011083
10.2912482.160.017576
20.2788762.06820.021668
3-0.22422-1.66290.948985
4-0.179119-1.32840.905231
50.0811350.60170.274919
6-0.121676-0.90240.814603
70.1901361.41010.082072
80.0640410.47490.318356
9-0.193542-1.43530.921575
10-0.152535-1.13120.868566
11-0.146048-1.08310.858259
120.1953991.44910.076492
130.2410721.78780.039656
140.0462780.34320.366376
15-0.20374-1.5110.931741
16-0.056136-0.41630.6606
170.194811.44480.077101
18-0.070181-0.52050.697591
19-0.178278-1.32210.904204
200.0135440.10040.460179
21-0.114065-0.84590.799371
220.0834130.61860.269365
23-0.090667-0.67240.747929
24-0.05881-0.43610.667781
250.0844090.6260.266955
26-0.15857-1.1760.877667
27-0.019981-0.14820.558629
280.0031550.02340.490709
29-0.073919-0.54820.707113
30-0.092916-0.68910.753165
31-0.101484-0.75260.772559
320.1088080.80690.211589
330.0333330.24720.402836
340.010050.07450.470427
35-0.044811-0.33230.629547
360.0302290.22420.411723
370.0458190.33980.367651
38-0.042233-0.31320.622346
39-0.039018-0.28940.613305
400.0817350.60620.273451
410.054780.40630.343066
42-0.029884-0.22160.587287
43-0.052589-0.390.650982
44-0.010874-0.08060.531992
45-0.031755-0.23550.592652
46-0.042199-0.3130.622252
470.0205450.15240.439727

\begin{tabular}{lllllllll}
\hline
Partial Autocorrelation Function \tabularnewline
Time lag k & PACF(k) & T-STAT & P-value \tabularnewline
0 & 0.317427 & 2.3541 & 0.011083 \tabularnewline
1 & 0.291248 & 2.16 & 0.017576 \tabularnewline
2 & 0.278876 & 2.0682 & 0.021668 \tabularnewline
3 & -0.22422 & -1.6629 & 0.948985 \tabularnewline
4 & -0.179119 & -1.3284 & 0.905231 \tabularnewline
5 & 0.081135 & 0.6017 & 0.274919 \tabularnewline
6 & -0.121676 & -0.9024 & 0.814603 \tabularnewline
7 & 0.190136 & 1.4101 & 0.082072 \tabularnewline
8 & 0.064041 & 0.4749 & 0.318356 \tabularnewline
9 & -0.193542 & -1.4353 & 0.921575 \tabularnewline
10 & -0.152535 & -1.1312 & 0.868566 \tabularnewline
11 & -0.146048 & -1.0831 & 0.858259 \tabularnewline
12 & 0.195399 & 1.4491 & 0.076492 \tabularnewline
13 & 0.241072 & 1.7878 & 0.039656 \tabularnewline
14 & 0.046278 & 0.3432 & 0.366376 \tabularnewline
15 & -0.20374 & -1.511 & 0.931741 \tabularnewline
16 & -0.056136 & -0.4163 & 0.6606 \tabularnewline
17 & 0.19481 & 1.4448 & 0.077101 \tabularnewline
18 & -0.070181 & -0.5205 & 0.697591 \tabularnewline
19 & -0.178278 & -1.3221 & 0.904204 \tabularnewline
20 & 0.013544 & 0.1004 & 0.460179 \tabularnewline
21 & -0.114065 & -0.8459 & 0.799371 \tabularnewline
22 & 0.083413 & 0.6186 & 0.269365 \tabularnewline
23 & -0.090667 & -0.6724 & 0.747929 \tabularnewline
24 & -0.05881 & -0.4361 & 0.667781 \tabularnewline
25 & 0.084409 & 0.626 & 0.266955 \tabularnewline
26 & -0.15857 & -1.176 & 0.877667 \tabularnewline
27 & -0.019981 & -0.1482 & 0.558629 \tabularnewline
28 & 0.003155 & 0.0234 & 0.490709 \tabularnewline
29 & -0.073919 & -0.5482 & 0.707113 \tabularnewline
30 & -0.092916 & -0.6891 & 0.753165 \tabularnewline
31 & -0.101484 & -0.7526 & 0.772559 \tabularnewline
32 & 0.108808 & 0.8069 & 0.211589 \tabularnewline
33 & 0.033333 & 0.2472 & 0.402836 \tabularnewline
34 & 0.01005 & 0.0745 & 0.470427 \tabularnewline
35 & -0.044811 & -0.3323 & 0.629547 \tabularnewline
36 & 0.030229 & 0.2242 & 0.411723 \tabularnewline
37 & 0.045819 & 0.3398 & 0.367651 \tabularnewline
38 & -0.042233 & -0.3132 & 0.622346 \tabularnewline
39 & -0.039018 & -0.2894 & 0.613305 \tabularnewline
40 & 0.081735 & 0.6062 & 0.273451 \tabularnewline
41 & 0.05478 & 0.4063 & 0.343066 \tabularnewline
42 & -0.029884 & -0.2216 & 0.587287 \tabularnewline
43 & -0.052589 & -0.39 & 0.650982 \tabularnewline
44 & -0.010874 & -0.0806 & 0.531992 \tabularnewline
45 & -0.031755 & -0.2355 & 0.592652 \tabularnewline
46 & -0.042199 & -0.313 & 0.622252 \tabularnewline
47 & 0.020545 & 0.1524 & 0.439727 \tabularnewline
\hline
\end{tabular}
%Source: https://freestatistics.org/blog/index.php?pk=2447&T=2

[TABLE]
[ROW][C]Partial Autocorrelation Function[/C][/ROW]
[ROW][C]Time lag k[/C][C]PACF(k)[/C][C]T-STAT[/C][C]P-value[/C][/ROW]
[ROW][C]0[/C][C]0.317427[/C][C]2.3541[/C][C]0.011083[/C][/ROW]
[ROW][C]1[/C][C]0.291248[/C][C]2.16[/C][C]0.017576[/C][/ROW]
[ROW][C]2[/C][C]0.278876[/C][C]2.0682[/C][C]0.021668[/C][/ROW]
[ROW][C]3[/C][C]-0.22422[/C][C]-1.6629[/C][C]0.948985[/C][/ROW]
[ROW][C]4[/C][C]-0.179119[/C][C]-1.3284[/C][C]0.905231[/C][/ROW]
[ROW][C]5[/C][C]0.081135[/C][C]0.6017[/C][C]0.274919[/C][/ROW]
[ROW][C]6[/C][C]-0.121676[/C][C]-0.9024[/C][C]0.814603[/C][/ROW]
[ROW][C]7[/C][C]0.190136[/C][C]1.4101[/C][C]0.082072[/C][/ROW]
[ROW][C]8[/C][C]0.064041[/C][C]0.4749[/C][C]0.318356[/C][/ROW]
[ROW][C]9[/C][C]-0.193542[/C][C]-1.4353[/C][C]0.921575[/C][/ROW]
[ROW][C]10[/C][C]-0.152535[/C][C]-1.1312[/C][C]0.868566[/C][/ROW]
[ROW][C]11[/C][C]-0.146048[/C][C]-1.0831[/C][C]0.858259[/C][/ROW]
[ROW][C]12[/C][C]0.195399[/C][C]1.4491[/C][C]0.076492[/C][/ROW]
[ROW][C]13[/C][C]0.241072[/C][C]1.7878[/C][C]0.039656[/C][/ROW]
[ROW][C]14[/C][C]0.046278[/C][C]0.3432[/C][C]0.366376[/C][/ROW]
[ROW][C]15[/C][C]-0.20374[/C][C]-1.511[/C][C]0.931741[/C][/ROW]
[ROW][C]16[/C][C]-0.056136[/C][C]-0.4163[/C][C]0.6606[/C][/ROW]
[ROW][C]17[/C][C]0.19481[/C][C]1.4448[/C][C]0.077101[/C][/ROW]
[ROW][C]18[/C][C]-0.070181[/C][C]-0.5205[/C][C]0.697591[/C][/ROW]
[ROW][C]19[/C][C]-0.178278[/C][C]-1.3221[/C][C]0.904204[/C][/ROW]
[ROW][C]20[/C][C]0.013544[/C][C]0.1004[/C][C]0.460179[/C][/ROW]
[ROW][C]21[/C][C]-0.114065[/C][C]-0.8459[/C][C]0.799371[/C][/ROW]
[ROW][C]22[/C][C]0.083413[/C][C]0.6186[/C][C]0.269365[/C][/ROW]
[ROW][C]23[/C][C]-0.090667[/C][C]-0.6724[/C][C]0.747929[/C][/ROW]
[ROW][C]24[/C][C]-0.05881[/C][C]-0.4361[/C][C]0.667781[/C][/ROW]
[ROW][C]25[/C][C]0.084409[/C][C]0.626[/C][C]0.266955[/C][/ROW]
[ROW][C]26[/C][C]-0.15857[/C][C]-1.176[/C][C]0.877667[/C][/ROW]
[ROW][C]27[/C][C]-0.019981[/C][C]-0.1482[/C][C]0.558629[/C][/ROW]
[ROW][C]28[/C][C]0.003155[/C][C]0.0234[/C][C]0.490709[/C][/ROW]
[ROW][C]29[/C][C]-0.073919[/C][C]-0.5482[/C][C]0.707113[/C][/ROW]
[ROW][C]30[/C][C]-0.092916[/C][C]-0.6891[/C][C]0.753165[/C][/ROW]
[ROW][C]31[/C][C]-0.101484[/C][C]-0.7526[/C][C]0.772559[/C][/ROW]
[ROW][C]32[/C][C]0.108808[/C][C]0.8069[/C][C]0.211589[/C][/ROW]
[ROW][C]33[/C][C]0.033333[/C][C]0.2472[/C][C]0.402836[/C][/ROW]
[ROW][C]34[/C][C]0.01005[/C][C]0.0745[/C][C]0.470427[/C][/ROW]
[ROW][C]35[/C][C]-0.044811[/C][C]-0.3323[/C][C]0.629547[/C][/ROW]
[ROW][C]36[/C][C]0.030229[/C][C]0.2242[/C][C]0.411723[/C][/ROW]
[ROW][C]37[/C][C]0.045819[/C][C]0.3398[/C][C]0.367651[/C][/ROW]
[ROW][C]38[/C][C]-0.042233[/C][C]-0.3132[/C][C]0.622346[/C][/ROW]
[ROW][C]39[/C][C]-0.039018[/C][C]-0.2894[/C][C]0.613305[/C][/ROW]
[ROW][C]40[/C][C]0.081735[/C][C]0.6062[/C][C]0.273451[/C][/ROW]
[ROW][C]41[/C][C]0.05478[/C][C]0.4063[/C][C]0.343066[/C][/ROW]
[ROW][C]42[/C][C]-0.029884[/C][C]-0.2216[/C][C]0.587287[/C][/ROW]
[ROW][C]43[/C][C]-0.052589[/C][C]-0.39[/C][C]0.650982[/C][/ROW]
[ROW][C]44[/C][C]-0.010874[/C][C]-0.0806[/C][C]0.531992[/C][/ROW]
[ROW][C]45[/C][C]-0.031755[/C][C]-0.2355[/C][C]0.592652[/C][/ROW]
[ROW][C]46[/C][C]-0.042199[/C][C]-0.313[/C][C]0.622252[/C][/ROW]
[ROW][C]47[/C][C]0.020545[/C][C]0.1524[/C][C]0.439727[/C][/ROW]
[/TABLE]
Source: https://freestatistics.org/blog/index.php?pk=2447&T=2

Globally Unique Identifier (entire table): ba.freestatistics.org/blog/index.php?pk=2447&T=2

As an alternative you can also use a QR Code:  

The GUIDs for individual cells are displayed in the table below:

Partial Autocorrelation Function
Time lag kPACF(k)T-STATP-value
00.3174272.35410.011083
10.2912482.160.017576
20.2788762.06820.021668
3-0.22422-1.66290.948985
4-0.179119-1.32840.905231
50.0811350.60170.274919
6-0.121676-0.90240.814603
70.1901361.41010.082072
80.0640410.47490.318356
9-0.193542-1.43530.921575
10-0.152535-1.13120.868566
11-0.146048-1.08310.858259
120.1953991.44910.076492
130.2410721.78780.039656
140.0462780.34320.366376
15-0.20374-1.5110.931741
16-0.056136-0.41630.6606
170.194811.44480.077101
18-0.070181-0.52050.697591
19-0.178278-1.32210.904204
200.0135440.10040.460179
21-0.114065-0.84590.799371
220.0834130.61860.269365
23-0.090667-0.67240.747929
24-0.05881-0.43610.667781
250.0844090.6260.266955
26-0.15857-1.1760.877667
27-0.019981-0.14820.558629
280.0031550.02340.490709
29-0.073919-0.54820.707113
30-0.092916-0.68910.753165
31-0.101484-0.75260.772559
320.1088080.80690.211589
330.0333330.24720.402836
340.010050.07450.470427
35-0.044811-0.33230.629547
360.0302290.22420.411723
370.0458190.33980.367651
38-0.042233-0.31320.622346
39-0.039018-0.28940.613305
400.0817350.60620.273451
410.054780.40630.343066
42-0.029884-0.22160.587287
43-0.052589-0.390.650982
44-0.010874-0.08060.531992
45-0.031755-0.23550.592652
46-0.042199-0.3130.622252
470.0205450.15240.439727


Parameters (Session):
par1 = 48 ; par2 = 1 ; par3 = 0 ; par4 = 1 ; par5 = 12 ;
Parameters (R input):
par1 = 48 ; par2 = 1 ; par3 = 0 ; par4 = 1 ; par5 = 12 ;
R code (references can be found in the software module):
if (par1 == 'Default') {
par1 = 10*log10(length(x))
} else {
par1 <- as.numeric(par1)
}
par2 <- as.numeric(par2)
par3 <- as.numeric(par3)
par4 <- as.numeric(par4)
par5 <- as.numeric(par5)
if (par2 == 0) {
x <- log(x)
} else {
x <- (x ^ par2 - 1) / par2
}
if (par3 > 0) x <- diff(x,lag=1,difference=par3)
if (par4 > 0) x <- diff(x,lag=par5,difference=par4)
bitmap(file='pic1.png')
racf <- acf(x,par1,main='Autocorrelation',xlab='lags',ylab='ACF')
dev.off()
bitmap(file='pic2.png')
rpacf <- pacf(x,par1,main='Partial Autocorrelation',xlab='lags',ylab='PACF')
dev.off()
(myacf <- c(racf$acf))
(mypacf <- c(rpacf$acf))
lengthx <- length(x)
sqrtn <- sqrt(lengthx)
load(file='createtable')
a<-table.start()
a<-table.row.start(a)
a<-table.element(a,'Autocorrelation Function',4,TRUE)
a<-table.row.end(a)
a<-table.row.start(a)
a<-table.element(a,'Time lag k',header=TRUE)
a<-table.element(a,hyperlink('basics.htm','ACF(k)','click here for more information about the Autocorrelation Function'),header=TRUE)
a<-table.element(a,'T-STAT',header=TRUE)
a<-table.element(a,'P-value',header=TRUE)
a<-table.row.end(a)
for (i in 1:par1) {
a<-table.row.start(a)
a<-table.element(a,i-1,header=TRUE)
a<-table.element(a,round(myacf[i],6))
mytstat <- myacf[i]*sqrtn
a<-table.element(a,round(mytstat,4))
a<-table.element(a,round(1-pt(mytstat,lengthx),6))
a<-table.row.end(a)
}
a<-table.end(a)
table.save(a,file='mytable.tab')
a<-table.start()
a<-table.row.start(a)
a<-table.element(a,'Partial Autocorrelation Function',4,TRUE)
a<-table.row.end(a)
a<-table.row.start(a)
a<-table.element(a,'Time lag k',header=TRUE)
a<-table.element(a,hyperlink('basics.htm','PACF(k)','click here for more information about the Partial Autocorrelation Function'),header=TRUE)
a<-table.element(a,'T-STAT',header=TRUE)
a<-table.element(a,'P-value',header=TRUE)
a<-table.row.end(a)
for (i in 1:par1) {
a<-table.row.start(a)
a<-table.element(a,i-1,header=TRUE)
a<-table.element(a,round(mypacf[i],6))
mytstat <- mypacf[i]*sqrtn
a<-table.element(a,round(mytstat,4))
a<-table.element(a,round(1-pt(mytstat,lengthx),6))
a<-table.row.end(a)
}
a<-table.end(a)
table.save(a,file='mytable1.tab')