Free Statistics

of Irreproducible Research!

Author's title

Author*Unverified author*
R Software Modulerwasp_autocorrelation.wasp
Title produced by software(Partial) Autocorrelation Function
Date of computationTue, 04 Dec 2007 13:44:40 -0700
Cite this page as followsStatistical Computations at FreeStatistics.org, Office for Research Development and Education, URL https://freestatistics.org/blog/index.php?v=date/2007/Dec/04/t1196800358sn9w48zot17f12e.htm/, Retrieved Thu, 02 May 2024 01:16:55 +0000
Statistical Computations at FreeStatistics.org, Office for Research Development and Education, URL https://freestatistics.org/blog/index.php?pk=2446, Retrieved Thu, 02 May 2024 01:16:55 +0000
QR Codes:

Original text written by user:
IsPrivate?No (this computation is public)
User-defined keywordsWS8 Q4 autocorrelatie assumptie1
Estimated Impact194
Family? (F = Feedback message, R = changed R code, M = changed R Module, P = changed Parameters, D = changed Data)
-       [(Partial) Autocorrelation Function] [WS8 Q4 autocorrel...] [2007-12-04 20:44:40] [87b6915e48e03972eaa4a0940182012f] [Current]
Feedback Forum

Post a new message
Dataseries X:
-0.0159638532829408
-0.0225657069357223
-0.0174019273222234
0.0651553640551745
-0.145012972519764
-0.0469470125313633
-0.017577658172166
-0.00134992523967736
-0.000693026199286743
0.0528650772267529
-0.0128507550989017
0.00646484520007953
-0.0276259064355966
-0.0560587158816416
0.0139547837747227
0.0113676788492657
0.0415935342962231
-0.0340084341728658
-0.0432752093601953
-0.0132114076253396
0.0387784451459677
-0.0560867999852223
-0.112474671215459
-0.0426875387879434
0.0116849141279084
-0.0115717109243244
-0.0137800171844665
-0.0582933957483247
-0.0553381698991441
0.0315007154596505
0.0970611371275192
-0.0375935632730557
0.0334069237621878
0.0260853848426699
0.0293478548985809
0.0168936402624370
-0.0278742427512918
0.0286830159744677
0.0348003616774325
0.0179561406551503
0.0166588290662933
-0.0413987445590323
-0.0581838737435594
-0.00405842288134989
-0.00444256405402793
-0.0242487565127637
-0.00175402902524562
-0.020768309727409


Summary of compuational transaction
Raw Inputview raw input (R code)
Raw Outputview raw output of R engine
Computing time3 seconds
R Server'Herman Ole Andreas Wold' @ 193.190.124.10:1001

\begin{tabular}{lllllllll}
\hline
Summary of compuational transaction \tabularnewline
Raw Input & view raw input (R code)  \tabularnewline
Raw Output & view raw output of R engine  \tabularnewline
Computing time & 3 seconds \tabularnewline
R Server & 'Herman Ole Andreas Wold' @ 193.190.124.10:1001 \tabularnewline
\hline
\end{tabular}
%Source: https://freestatistics.org/blog/index.php?pk=2446&T=0

[TABLE]
[ROW][C]Summary of compuational transaction[/C][/ROW]
[ROW][C]Raw Input[/C][C]view raw input (R code) [/C][/ROW]
[ROW][C]Raw Output[/C][C]view raw output of R engine [/C][/ROW]
[ROW][C]Computing time[/C][C]3 seconds[/C][/ROW]
[ROW][C]R Server[/C][C]'Herman Ole Andreas Wold' @ 193.190.124.10:1001[/C][/ROW]
[/TABLE]
Source: https://freestatistics.org/blog/index.php?pk=2446&T=0

Globally Unique Identifier (entire table): ba.freestatistics.org/blog/index.php?pk=2446&T=0

As an alternative you can also use a QR Code:  

The GUIDs for individual cells are displayed in the table below:

Summary of compuational transaction
Raw Inputview raw input (R code)
Raw Outputview raw output of R engine
Computing time3 seconds
R Server'Herman Ole Andreas Wold' @ 193.190.124.10:1001


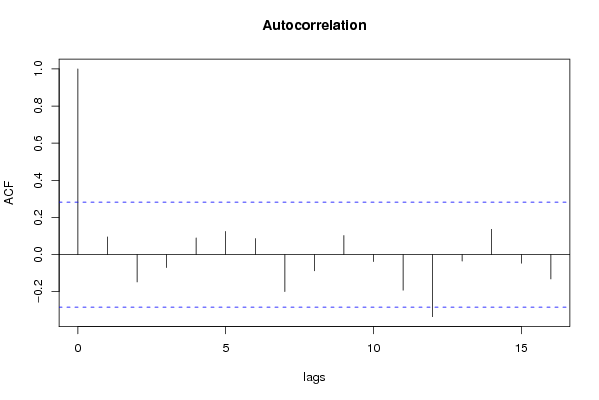
Autocorrelation Function
Time lag kACF(k)T-STATP-value
016.92820
10.0944250.65420.258054
2-0.147887-1.02460.844654
3-0.070475-0.48830.686207
40.0896890.62140.268644
50.124510.86260.196316
60.0860170.59590.277006
7-0.199588-1.38280.913435
8-0.088125-0.61060.727811
90.1022520.70840.241054
10-0.038285-0.26520.604022
11-0.192181-1.33150.905338
12-0.3349-2.32030.987688
13-0.035444-0.24560.596466
140.1356440.93980.176021
15-0.047066-0.32610.627111

\begin{tabular}{lllllllll}
\hline
Autocorrelation Function \tabularnewline
Time lag k & ACF(k) & T-STAT & P-value \tabularnewline
0 & 1 & 6.9282 & 0 \tabularnewline
1 & 0.094425 & 0.6542 & 0.258054 \tabularnewline
2 & -0.147887 & -1.0246 & 0.844654 \tabularnewline
3 & -0.070475 & -0.4883 & 0.686207 \tabularnewline
4 & 0.089689 & 0.6214 & 0.268644 \tabularnewline
5 & 0.12451 & 0.8626 & 0.196316 \tabularnewline
6 & 0.086017 & 0.5959 & 0.277006 \tabularnewline
7 & -0.199588 & -1.3828 & 0.913435 \tabularnewline
8 & -0.088125 & -0.6106 & 0.727811 \tabularnewline
9 & 0.102252 & 0.7084 & 0.241054 \tabularnewline
10 & -0.038285 & -0.2652 & 0.604022 \tabularnewline
11 & -0.192181 & -1.3315 & 0.905338 \tabularnewline
12 & -0.3349 & -2.3203 & 0.987688 \tabularnewline
13 & -0.035444 & -0.2456 & 0.596466 \tabularnewline
14 & 0.135644 & 0.9398 & 0.176021 \tabularnewline
15 & -0.047066 & -0.3261 & 0.627111 \tabularnewline
\hline
\end{tabular}
%Source: https://freestatistics.org/blog/index.php?pk=2446&T=1

[TABLE]
[ROW][C]Autocorrelation Function[/C][/ROW]
[ROW][C]Time lag k[/C][C]ACF(k)[/C][C]T-STAT[/C][C]P-value[/C][/ROW]
[ROW][C]0[/C][C]1[/C][C]6.9282[/C][C]0[/C][/ROW]
[ROW][C]1[/C][C]0.094425[/C][C]0.6542[/C][C]0.258054[/C][/ROW]
[ROW][C]2[/C][C]-0.147887[/C][C]-1.0246[/C][C]0.844654[/C][/ROW]
[ROW][C]3[/C][C]-0.070475[/C][C]-0.4883[/C][C]0.686207[/C][/ROW]
[ROW][C]4[/C][C]0.089689[/C][C]0.6214[/C][C]0.268644[/C][/ROW]
[ROW][C]5[/C][C]0.12451[/C][C]0.8626[/C][C]0.196316[/C][/ROW]
[ROW][C]6[/C][C]0.086017[/C][C]0.5959[/C][C]0.277006[/C][/ROW]
[ROW][C]7[/C][C]-0.199588[/C][C]-1.3828[/C][C]0.913435[/C][/ROW]
[ROW][C]8[/C][C]-0.088125[/C][C]-0.6106[/C][C]0.727811[/C][/ROW]
[ROW][C]9[/C][C]0.102252[/C][C]0.7084[/C][C]0.241054[/C][/ROW]
[ROW][C]10[/C][C]-0.038285[/C][C]-0.2652[/C][C]0.604022[/C][/ROW]
[ROW][C]11[/C][C]-0.192181[/C][C]-1.3315[/C][C]0.905338[/C][/ROW]
[ROW][C]12[/C][C]-0.3349[/C][C]-2.3203[/C][C]0.987688[/C][/ROW]
[ROW][C]13[/C][C]-0.035444[/C][C]-0.2456[/C][C]0.596466[/C][/ROW]
[ROW][C]14[/C][C]0.135644[/C][C]0.9398[/C][C]0.176021[/C][/ROW]
[ROW][C]15[/C][C]-0.047066[/C][C]-0.3261[/C][C]0.627111[/C][/ROW]
[/TABLE]
Source: https://freestatistics.org/blog/index.php?pk=2446&T=1

Globally Unique Identifier (entire table): ba.freestatistics.org/blog/index.php?pk=2446&T=1

As an alternative you can also use a QR Code:  

The GUIDs for individual cells are displayed in the table below:

Autocorrelation Function
Time lag kACF(k)T-STATP-value
016.92820
10.0944250.65420.258054
2-0.147887-1.02460.844654
3-0.070475-0.48830.686207
40.0896890.62140.268644
50.124510.86260.196316
60.0860170.59590.277006
7-0.199588-1.38280.913435
8-0.088125-0.61060.727811
90.1022520.70840.241054
10-0.038285-0.26520.604022
11-0.192181-1.33150.905338
12-0.3349-2.32030.987688
13-0.035444-0.24560.596466
140.1356440.93980.176021
15-0.047066-0.32610.627111


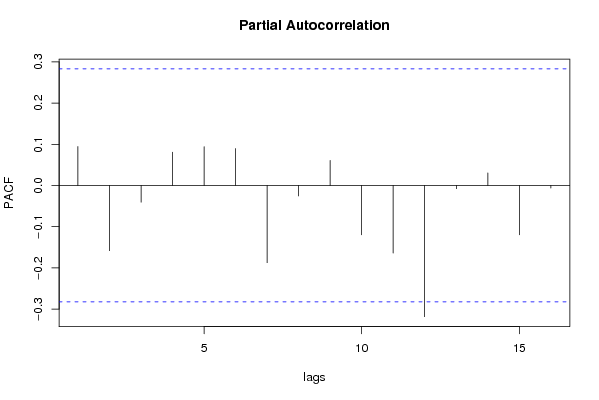
Partial Autocorrelation Function
Time lag kPACF(k)T-STATP-value
00.0944250.65420.258054
1-0.158214-1.09610.860756
2-0.040736-0.28220.610509
30.0809080.56050.288857
40.0940450.65160.258896
50.0895770.62060.268897
6-0.18743-1.29860.899849
7-0.025386-0.17590.569437
80.0606310.42010.338157
9-0.119918-0.83080.794904
10-0.164028-1.13640.869288
11-0.318501-2.20660.983922
12-0.007974-0.05520.521913
130.0305160.21140.416727
14-0.119916-0.83080.794901
15-0.006447-0.04470.51772

\begin{tabular}{lllllllll}
\hline
Partial Autocorrelation Function \tabularnewline
Time lag k & PACF(k) & T-STAT & P-value \tabularnewline
0 & 0.094425 & 0.6542 & 0.258054 \tabularnewline
1 & -0.158214 & -1.0961 & 0.860756 \tabularnewline
2 & -0.040736 & -0.2822 & 0.610509 \tabularnewline
3 & 0.080908 & 0.5605 & 0.288857 \tabularnewline
4 & 0.094045 & 0.6516 & 0.258896 \tabularnewline
5 & 0.089577 & 0.6206 & 0.268897 \tabularnewline
6 & -0.18743 & -1.2986 & 0.899849 \tabularnewline
7 & -0.025386 & -0.1759 & 0.569437 \tabularnewline
8 & 0.060631 & 0.4201 & 0.338157 \tabularnewline
9 & -0.119918 & -0.8308 & 0.794904 \tabularnewline
10 & -0.164028 & -1.1364 & 0.869288 \tabularnewline
11 & -0.318501 & -2.2066 & 0.983922 \tabularnewline
12 & -0.007974 & -0.0552 & 0.521913 \tabularnewline
13 & 0.030516 & 0.2114 & 0.416727 \tabularnewline
14 & -0.119916 & -0.8308 & 0.794901 \tabularnewline
15 & -0.006447 & -0.0447 & 0.51772 \tabularnewline
\hline
\end{tabular}
%Source: https://freestatistics.org/blog/index.php?pk=2446&T=2

[TABLE]
[ROW][C]Partial Autocorrelation Function[/C][/ROW]
[ROW][C]Time lag k[/C][C]PACF(k)[/C][C]T-STAT[/C][C]P-value[/C][/ROW]
[ROW][C]0[/C][C]0.094425[/C][C]0.6542[/C][C]0.258054[/C][/ROW]
[ROW][C]1[/C][C]-0.158214[/C][C]-1.0961[/C][C]0.860756[/C][/ROW]
[ROW][C]2[/C][C]-0.040736[/C][C]-0.2822[/C][C]0.610509[/C][/ROW]
[ROW][C]3[/C][C]0.080908[/C][C]0.5605[/C][C]0.288857[/C][/ROW]
[ROW][C]4[/C][C]0.094045[/C][C]0.6516[/C][C]0.258896[/C][/ROW]
[ROW][C]5[/C][C]0.089577[/C][C]0.6206[/C][C]0.268897[/C][/ROW]
[ROW][C]6[/C][C]-0.18743[/C][C]-1.2986[/C][C]0.899849[/C][/ROW]
[ROW][C]7[/C][C]-0.025386[/C][C]-0.1759[/C][C]0.569437[/C][/ROW]
[ROW][C]8[/C][C]0.060631[/C][C]0.4201[/C][C]0.338157[/C][/ROW]
[ROW][C]9[/C][C]-0.119918[/C][C]-0.8308[/C][C]0.794904[/C][/ROW]
[ROW][C]10[/C][C]-0.164028[/C][C]-1.1364[/C][C]0.869288[/C][/ROW]
[ROW][C]11[/C][C]-0.318501[/C][C]-2.2066[/C][C]0.983922[/C][/ROW]
[ROW][C]12[/C][C]-0.007974[/C][C]-0.0552[/C][C]0.521913[/C][/ROW]
[ROW][C]13[/C][C]0.030516[/C][C]0.2114[/C][C]0.416727[/C][/ROW]
[ROW][C]14[/C][C]-0.119916[/C][C]-0.8308[/C][C]0.794901[/C][/ROW]
[ROW][C]15[/C][C]-0.006447[/C][C]-0.0447[/C][C]0.51772[/C][/ROW]
[/TABLE]
Source: https://freestatistics.org/blog/index.php?pk=2446&T=2

Globally Unique Identifier (entire table): ba.freestatistics.org/blog/index.php?pk=2446&T=2

As an alternative you can also use a QR Code:  

The GUIDs for individual cells are displayed in the table below:

Partial Autocorrelation Function
Time lag kPACF(k)T-STATP-value
00.0944250.65420.258054
1-0.158214-1.09610.860756
2-0.040736-0.28220.610509
30.0809080.56050.288857
40.0940450.65160.258896
50.0895770.62060.268897
6-0.18743-1.29860.899849
7-0.025386-0.17590.569437
80.0606310.42010.338157
9-0.119918-0.83080.794904
10-0.164028-1.13640.869288
11-0.318501-2.20660.983922
12-0.007974-0.05520.521913
130.0305160.21140.416727
14-0.119916-0.83080.794901
15-0.006447-0.04470.51772


Parameters (Session):
par1 = Default ; par2 = 1 ; par3 = 0 ; par4 = 0 ; par5 = 12 ;
Parameters (R input):
par1 = Default ; par2 = 1 ; par3 = 0 ; par4 = 0 ; par5 = 12 ;
R code (references can be found in the software module):
if (par1 == 'Default') {
par1 = 10*log10(length(x))
} else {
par1 <- as.numeric(par1)
}
par2 <- as.numeric(par2)
par3 <- as.numeric(par3)
par4 <- as.numeric(par4)
par5 <- as.numeric(par5)
if (par2 == 0) {
x <- log(x)
} else {
x <- (x ^ par2 - 1) / par2
}
if (par3 > 0) x <- diff(x,lag=1,difference=par3)
if (par4 > 0) x <- diff(x,lag=par5,difference=par4)
bitmap(file='pic1.png')
racf <- acf(x,par1,main='Autocorrelation',xlab='lags',ylab='ACF')
dev.off()
bitmap(file='pic2.png')
rpacf <- pacf(x,par1,main='Partial Autocorrelation',xlab='lags',ylab='PACF')
dev.off()
(myacf <- c(racf$acf))
(mypacf <- c(rpacf$acf))
lengthx <- length(x)
sqrtn <- sqrt(lengthx)
load(file='createtable')
a<-table.start()
a<-table.row.start(a)
a<-table.element(a,'Autocorrelation Function',4,TRUE)
a<-table.row.end(a)
a<-table.row.start(a)
a<-table.element(a,'Time lag k',header=TRUE)
a<-table.element(a,hyperlink('basics.htm','ACF(k)','click here for more information about the Autocorrelation Function'),header=TRUE)
a<-table.element(a,'T-STAT',header=TRUE)
a<-table.element(a,'P-value',header=TRUE)
a<-table.row.end(a)
for (i in 1:par1) {
a<-table.row.start(a)
a<-table.element(a,i-1,header=TRUE)
a<-table.element(a,round(myacf[i],6))
mytstat <- myacf[i]*sqrtn
a<-table.element(a,round(mytstat,4))
a<-table.element(a,round(1-pt(mytstat,lengthx),6))
a<-table.row.end(a)
}
a<-table.end(a)
table.save(a,file='mytable.tab')
a<-table.start()
a<-table.row.start(a)
a<-table.element(a,'Partial Autocorrelation Function',4,TRUE)
a<-table.row.end(a)
a<-table.row.start(a)
a<-table.element(a,'Time lag k',header=TRUE)
a<-table.element(a,hyperlink('basics.htm','PACF(k)','click here for more information about the Partial Autocorrelation Function'),header=TRUE)
a<-table.element(a,'T-STAT',header=TRUE)
a<-table.element(a,'P-value',header=TRUE)
a<-table.row.end(a)
for (i in 1:par1) {
a<-table.row.start(a)
a<-table.element(a,i-1,header=TRUE)
a<-table.element(a,round(mypacf[i],6))
mytstat <- mypacf[i]*sqrtn
a<-table.element(a,round(mytstat,4))
a<-table.element(a,round(1-pt(mytstat,lengthx),6))
a<-table.row.end(a)
}
a<-table.end(a)
table.save(a,file='mytable1.tab')