Free Statistics

of Irreproducible Research!

Author's title

Author*Unverified author*
R Software Modulerwasp_autocorrelation.wasp
Title produced by software(Partial) Autocorrelation Function
Date of computationTue, 04 Dec 2007 12:37:09 -0700
Cite this page as followsStatistical Computations at FreeStatistics.org, Office for Research Development and Education, URL https://freestatistics.org/blog/index.php?v=date/2007/Dec/04/t11967979882ptyzo79pzp91jl.htm/, Retrieved Thu, 02 May 2024 00:34:51 +0000
Statistical Computations at FreeStatistics.org, Office for Research Development and Education, URL https://freestatistics.org/blog/index.php?pk=2441, Retrieved Thu, 02 May 2024 00:34:51 +0000
QR Codes:

Original text written by user:
IsPrivate?No (this computation is public)
User-defined keywordsTijdreeks 1: industriele productie in sector Tinne Van der Eycken
Estimated Impact180
Family? (F = Feedback message, R = changed R code, M = changed R Module, P = changed Parameters, D = changed Data)
-       [(Partial) Autocorrelation Function] [Workshop 4] [2007-12-04 19:37:09] [c8635c97647ba59406cb570a9fab7b02] [Current]
Feedback Forum

Post a new message
Dataseries X:
86.5
104.1
110.9
114.5
112.2
96.4
92
102
99.7
102
98.9
87.4
94.4
109.3
116.4
101
105.5
97.8
95.5
113.7
103.7
100.8
113.8
84.6
95.3
110
107.5
107.6
116
96.9
97
108.1
101.9
107.2
110.2
78.7
96.5
115.2
104.7
109.1
108.4
95.5
97.8
115.1
96.2
112
111.8
82.5
100.8
116
116.3
116.6
112.9
100.9
104.1
117.4
103.3
111.6
115
92.6
105.2


Summary of compuational transaction
Raw Inputview raw input (R code)
Raw Outputview raw output of R engine
Computing time2 seconds
R Server'Gwilym Jenkins' @ 72.249.127.135

\begin{tabular}{lllllllll}
\hline
Summary of compuational transaction \tabularnewline
Raw Input & view raw input (R code)  \tabularnewline
Raw Output & view raw output of R engine  \tabularnewline
Computing time & 2 seconds \tabularnewline
R Server & 'Gwilym Jenkins' @ 72.249.127.135 \tabularnewline
\hline
\end{tabular}
%Source: https://freestatistics.org/blog/index.php?pk=2441&T=0

[TABLE]
[ROW][C]Summary of compuational transaction[/C][/ROW]
[ROW][C]Raw Input[/C][C]view raw input (R code) [/C][/ROW]
[ROW][C]Raw Output[/C][C]view raw output of R engine [/C][/ROW]
[ROW][C]Computing time[/C][C]2 seconds[/C][/ROW]
[ROW][C]R Server[/C][C]'Gwilym Jenkins' @ 72.249.127.135[/C][/ROW]
[/TABLE]
Source: https://freestatistics.org/blog/index.php?pk=2441&T=0

Globally Unique Identifier (entire table): ba.freestatistics.org/blog/index.php?pk=2441&T=0

As an alternative you can also use a QR Code:  

The GUIDs for individual cells are displayed in the table below:

Summary of compuational transaction
Raw Inputview raw input (R code)
Raw Outputview raw output of R engine
Computing time2 seconds
R Server'Gwilym Jenkins' @ 72.249.127.135


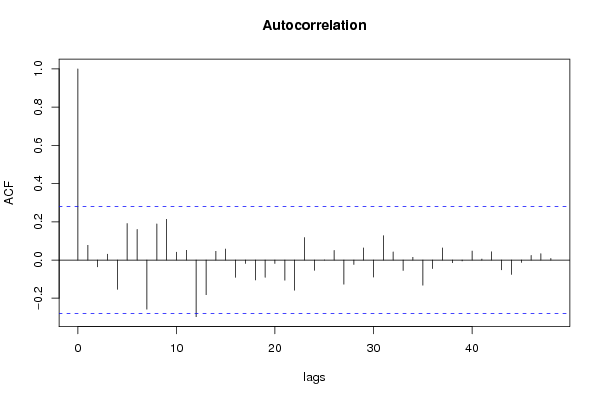
Autocorrelation Function
Time lag kACF(k)T-STATP-value
0170
10.07720.54040.295685
2-0.035599-0.24920.597873
30.0301870.21130.41676
4-0.153409-1.07390.855929
50.1909081.33640.093803
60.1597431.11820.134467
7-0.257123-1.79990.960979
80.1890011.3230.095987
90.2133341.49330.07088
100.0408170.28570.388148
110.0508510.3560.3617
12-0.296463-2.07520.978382
13-0.181535-1.27070.895091
140.0454010.31780.375991
150.0572590.40080.34515
16-0.090451-0.63320.735212
17-0.017688-0.12380.549016
18-0.104356-0.73050.765716
19-0.090846-0.63590.736108
20-0.018063-0.12640.550051
21-0.105821-0.74070.76881
22-0.157844-1.10490.862703
230.1176330.82340.207127
24-0.054054-0.37840.646608
253.5e-052e-040.499902
260.0500390.35030.363817
27-0.126544-0.88580.809977
28-0.023452-0.16420.564861
290.0629840.44090.330616
30-0.08951-0.62660.733075
310.1270660.88950.18905
320.0421380.2950.384634
33-0.054611-0.38230.648045
340.0138680.09710.46153
35-0.131494-0.92050.819079
36-0.044787-0.31350.622387
370.0629240.44050.330767
38-0.01437-0.10060.539856
39-0.004657-0.03260.512937
400.0470250.32920.371713
410.0052940.03710.485295
420.0432360.30270.381719
43-0.051089-0.35760.63892
44-0.075712-0.530.700741
45-0.012627-0.08840.535037
460.0238530.1670.434039
470.0331490.2320.408736

\begin{tabular}{lllllllll}
\hline
Autocorrelation Function \tabularnewline
Time lag k & ACF(k) & T-STAT & P-value \tabularnewline
0 & 1 & 7 & 0 \tabularnewline
1 & 0.0772 & 0.5404 & 0.295685 \tabularnewline
2 & -0.035599 & -0.2492 & 0.597873 \tabularnewline
3 & 0.030187 & 0.2113 & 0.41676 \tabularnewline
4 & -0.153409 & -1.0739 & 0.855929 \tabularnewline
5 & 0.190908 & 1.3364 & 0.093803 \tabularnewline
6 & 0.159743 & 1.1182 & 0.134467 \tabularnewline
7 & -0.257123 & -1.7999 & 0.960979 \tabularnewline
8 & 0.189001 & 1.323 & 0.095987 \tabularnewline
9 & 0.213334 & 1.4933 & 0.07088 \tabularnewline
10 & 0.040817 & 0.2857 & 0.388148 \tabularnewline
11 & 0.050851 & 0.356 & 0.3617 \tabularnewline
12 & -0.296463 & -2.0752 & 0.978382 \tabularnewline
13 & -0.181535 & -1.2707 & 0.895091 \tabularnewline
14 & 0.045401 & 0.3178 & 0.375991 \tabularnewline
15 & 0.057259 & 0.4008 & 0.34515 \tabularnewline
16 & -0.090451 & -0.6332 & 0.735212 \tabularnewline
17 & -0.017688 & -0.1238 & 0.549016 \tabularnewline
18 & -0.104356 & -0.7305 & 0.765716 \tabularnewline
19 & -0.090846 & -0.6359 & 0.736108 \tabularnewline
20 & -0.018063 & -0.1264 & 0.550051 \tabularnewline
21 & -0.105821 & -0.7407 & 0.76881 \tabularnewline
22 & -0.157844 & -1.1049 & 0.862703 \tabularnewline
23 & 0.117633 & 0.8234 & 0.207127 \tabularnewline
24 & -0.054054 & -0.3784 & 0.646608 \tabularnewline
25 & 3.5e-05 & 2e-04 & 0.499902 \tabularnewline
26 & 0.050039 & 0.3503 & 0.363817 \tabularnewline
27 & -0.126544 & -0.8858 & 0.809977 \tabularnewline
28 & -0.023452 & -0.1642 & 0.564861 \tabularnewline
29 & 0.062984 & 0.4409 & 0.330616 \tabularnewline
30 & -0.08951 & -0.6266 & 0.733075 \tabularnewline
31 & 0.127066 & 0.8895 & 0.18905 \tabularnewline
32 & 0.042138 & 0.295 & 0.384634 \tabularnewline
33 & -0.054611 & -0.3823 & 0.648045 \tabularnewline
34 & 0.013868 & 0.0971 & 0.46153 \tabularnewline
35 & -0.131494 & -0.9205 & 0.819079 \tabularnewline
36 & -0.044787 & -0.3135 & 0.622387 \tabularnewline
37 & 0.062924 & 0.4405 & 0.330767 \tabularnewline
38 & -0.01437 & -0.1006 & 0.539856 \tabularnewline
39 & -0.004657 & -0.0326 & 0.512937 \tabularnewline
40 & 0.047025 & 0.3292 & 0.371713 \tabularnewline
41 & 0.005294 & 0.0371 & 0.485295 \tabularnewline
42 & 0.043236 & 0.3027 & 0.381719 \tabularnewline
43 & -0.051089 & -0.3576 & 0.63892 \tabularnewline
44 & -0.075712 & -0.53 & 0.700741 \tabularnewline
45 & -0.012627 & -0.0884 & 0.535037 \tabularnewline
46 & 0.023853 & 0.167 & 0.434039 \tabularnewline
47 & 0.033149 & 0.232 & 0.408736 \tabularnewline
\hline
\end{tabular}
%Source: https://freestatistics.org/blog/index.php?pk=2441&T=1

[TABLE]
[ROW][C]Autocorrelation Function[/C][/ROW]
[ROW][C]Time lag k[/C][C]ACF(k)[/C][C]T-STAT[/C][C]P-value[/C][/ROW]
[ROW][C]0[/C][C]1[/C][C]7[/C][C]0[/C][/ROW]
[ROW][C]1[/C][C]0.0772[/C][C]0.5404[/C][C]0.295685[/C][/ROW]
[ROW][C]2[/C][C]-0.035599[/C][C]-0.2492[/C][C]0.597873[/C][/ROW]
[ROW][C]3[/C][C]0.030187[/C][C]0.2113[/C][C]0.41676[/C][/ROW]
[ROW][C]4[/C][C]-0.153409[/C][C]-1.0739[/C][C]0.855929[/C][/ROW]
[ROW][C]5[/C][C]0.190908[/C][C]1.3364[/C][C]0.093803[/C][/ROW]
[ROW][C]6[/C][C]0.159743[/C][C]1.1182[/C][C]0.134467[/C][/ROW]
[ROW][C]7[/C][C]-0.257123[/C][C]-1.7999[/C][C]0.960979[/C][/ROW]
[ROW][C]8[/C][C]0.189001[/C][C]1.323[/C][C]0.095987[/C][/ROW]
[ROW][C]9[/C][C]0.213334[/C][C]1.4933[/C][C]0.07088[/C][/ROW]
[ROW][C]10[/C][C]0.040817[/C][C]0.2857[/C][C]0.388148[/C][/ROW]
[ROW][C]11[/C][C]0.050851[/C][C]0.356[/C][C]0.3617[/C][/ROW]
[ROW][C]12[/C][C]-0.296463[/C][C]-2.0752[/C][C]0.978382[/C][/ROW]
[ROW][C]13[/C][C]-0.181535[/C][C]-1.2707[/C][C]0.895091[/C][/ROW]
[ROW][C]14[/C][C]0.045401[/C][C]0.3178[/C][C]0.375991[/C][/ROW]
[ROW][C]15[/C][C]0.057259[/C][C]0.4008[/C][C]0.34515[/C][/ROW]
[ROW][C]16[/C][C]-0.090451[/C][C]-0.6332[/C][C]0.735212[/C][/ROW]
[ROW][C]17[/C][C]-0.017688[/C][C]-0.1238[/C][C]0.549016[/C][/ROW]
[ROW][C]18[/C][C]-0.104356[/C][C]-0.7305[/C][C]0.765716[/C][/ROW]
[ROW][C]19[/C][C]-0.090846[/C][C]-0.6359[/C][C]0.736108[/C][/ROW]
[ROW][C]20[/C][C]-0.018063[/C][C]-0.1264[/C][C]0.550051[/C][/ROW]
[ROW][C]21[/C][C]-0.105821[/C][C]-0.7407[/C][C]0.76881[/C][/ROW]
[ROW][C]22[/C][C]-0.157844[/C][C]-1.1049[/C][C]0.862703[/C][/ROW]
[ROW][C]23[/C][C]0.117633[/C][C]0.8234[/C][C]0.207127[/C][/ROW]
[ROW][C]24[/C][C]-0.054054[/C][C]-0.3784[/C][C]0.646608[/C][/ROW]
[ROW][C]25[/C][C]3.5e-05[/C][C]2e-04[/C][C]0.499902[/C][/ROW]
[ROW][C]26[/C][C]0.050039[/C][C]0.3503[/C][C]0.363817[/C][/ROW]
[ROW][C]27[/C][C]-0.126544[/C][C]-0.8858[/C][C]0.809977[/C][/ROW]
[ROW][C]28[/C][C]-0.023452[/C][C]-0.1642[/C][C]0.564861[/C][/ROW]
[ROW][C]29[/C][C]0.062984[/C][C]0.4409[/C][C]0.330616[/C][/ROW]
[ROW][C]30[/C][C]-0.08951[/C][C]-0.6266[/C][C]0.733075[/C][/ROW]
[ROW][C]31[/C][C]0.127066[/C][C]0.8895[/C][C]0.18905[/C][/ROW]
[ROW][C]32[/C][C]0.042138[/C][C]0.295[/C][C]0.384634[/C][/ROW]
[ROW][C]33[/C][C]-0.054611[/C][C]-0.3823[/C][C]0.648045[/C][/ROW]
[ROW][C]34[/C][C]0.013868[/C][C]0.0971[/C][C]0.46153[/C][/ROW]
[ROW][C]35[/C][C]-0.131494[/C][C]-0.9205[/C][C]0.819079[/C][/ROW]
[ROW][C]36[/C][C]-0.044787[/C][C]-0.3135[/C][C]0.622387[/C][/ROW]
[ROW][C]37[/C][C]0.062924[/C][C]0.4405[/C][C]0.330767[/C][/ROW]
[ROW][C]38[/C][C]-0.01437[/C][C]-0.1006[/C][C]0.539856[/C][/ROW]
[ROW][C]39[/C][C]-0.004657[/C][C]-0.0326[/C][C]0.512937[/C][/ROW]
[ROW][C]40[/C][C]0.047025[/C][C]0.3292[/C][C]0.371713[/C][/ROW]
[ROW][C]41[/C][C]0.005294[/C][C]0.0371[/C][C]0.485295[/C][/ROW]
[ROW][C]42[/C][C]0.043236[/C][C]0.3027[/C][C]0.381719[/C][/ROW]
[ROW][C]43[/C][C]-0.051089[/C][C]-0.3576[/C][C]0.63892[/C][/ROW]
[ROW][C]44[/C][C]-0.075712[/C][C]-0.53[/C][C]0.700741[/C][/ROW]
[ROW][C]45[/C][C]-0.012627[/C][C]-0.0884[/C][C]0.535037[/C][/ROW]
[ROW][C]46[/C][C]0.023853[/C][C]0.167[/C][C]0.434039[/C][/ROW]
[ROW][C]47[/C][C]0.033149[/C][C]0.232[/C][C]0.408736[/C][/ROW]
[/TABLE]
Source: https://freestatistics.org/blog/index.php?pk=2441&T=1

Globally Unique Identifier (entire table): ba.freestatistics.org/blog/index.php?pk=2441&T=1

As an alternative you can also use a QR Code:  

The GUIDs for individual cells are displayed in the table below:

Autocorrelation Function
Time lag kACF(k)T-STATP-value
0170
10.07720.54040.295685
2-0.035599-0.24920.597873
30.0301870.21130.41676
4-0.153409-1.07390.855929
50.1909081.33640.093803
60.1597431.11820.134467
7-0.257123-1.79990.960979
80.1890011.3230.095987
90.2133341.49330.07088
100.0408170.28570.388148
110.0508510.3560.3617
12-0.296463-2.07520.978382
13-0.181535-1.27070.895091
140.0454010.31780.375991
150.0572590.40080.34515
16-0.090451-0.63320.735212
17-0.017688-0.12380.549016
18-0.104356-0.73050.765716
19-0.090846-0.63590.736108
20-0.018063-0.12640.550051
21-0.105821-0.74070.76881
22-0.157844-1.10490.862703
230.1176330.82340.207127
24-0.054054-0.37840.646608
253.5e-052e-040.499902
260.0500390.35030.363817
27-0.126544-0.88580.809977
28-0.023452-0.16420.564861
290.0629840.44090.330616
30-0.08951-0.62660.733075
310.1270660.88950.18905
320.0421380.2950.384634
33-0.054611-0.38230.648045
340.0138680.09710.46153
35-0.131494-0.92050.819079
36-0.044787-0.31350.622387
370.0629240.44050.330767
38-0.01437-0.10060.539856
39-0.004657-0.03260.512937
400.0470250.32920.371713
410.0052940.03710.485295
420.0432360.30270.381719
43-0.051089-0.35760.63892
44-0.075712-0.530.700741
45-0.012627-0.08840.535037
460.0238530.1670.434039
470.0331490.2320.408736


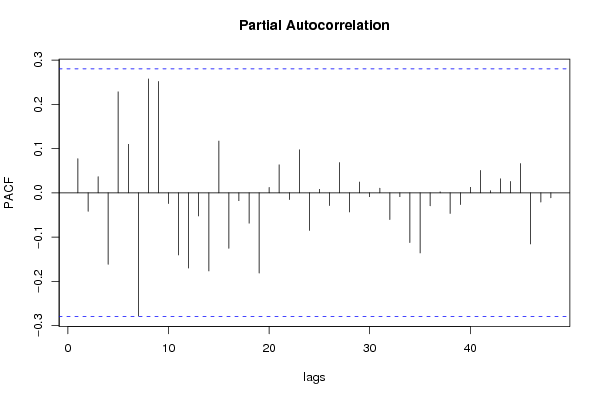
Partial Autocorrelation Function
Time lag kPACF(k)T-STATP-value
00.07720.54040.295685
1-0.041808-0.29270.614489
20.036560.25590.399543
3-0.161758-1.13230.868492
40.2281941.59740.058307
50.1095890.76710.223345
6-0.278698-1.95090.971599
70.2573551.80150.038891
80.2518291.76280.042085
9-0.0244-0.17080.567457
10-0.140394-0.98280.834723
11-0.170191-1.19130.880371
12-0.052444-0.36710.64244
13-0.176781-1.23750.889095
140.1169910.81890.208394
15-0.125571-0.8790.808154
16-0.017968-0.12580.549788
17-0.068796-0.48160.683874
18-0.181376-1.26960.894894
190.0122140.08550.466107
200.0631790.44220.330127
21-0.015275-0.10690.542358
220.0971240.67990.249893
23-0.085079-0.59560.722893
240.0079490.05560.477926
25-0.028967-0.20280.579923
260.0684070.47880.317089
27-0.043204-0.30240.618197
280.0242040.16940.433078
29-0.008732-0.06110.524246
300.0103170.07220.47136
31-0.060549-0.42380.663233
32-0.008778-0.06140.524373
33-0.112485-0.78740.782578
34-0.136003-0.9520.82712
35-0.029356-0.20550.58098
360.0023080.01620.493587
37-0.046541-0.32580.627015
38-0.026544-0.18580.573317
390.0125420.08780.465198
400.050440.35310.362772
410.0046840.03280.486988
420.0316780.22170.412716
430.0257990.18060.428717
440.0659790.46190.323115
45-0.115729-0.81010.789101
46-0.020888-0.14620.557825
47-0.011231-0.07860.531172

\begin{tabular}{lllllllll}
\hline
Partial Autocorrelation Function \tabularnewline
Time lag k & PACF(k) & T-STAT & P-value \tabularnewline
0 & 0.0772 & 0.5404 & 0.295685 \tabularnewline
1 & -0.041808 & -0.2927 & 0.614489 \tabularnewline
2 & 0.03656 & 0.2559 & 0.399543 \tabularnewline
3 & -0.161758 & -1.1323 & 0.868492 \tabularnewline
4 & 0.228194 & 1.5974 & 0.058307 \tabularnewline
5 & 0.109589 & 0.7671 & 0.223345 \tabularnewline
6 & -0.278698 & -1.9509 & 0.971599 \tabularnewline
7 & 0.257355 & 1.8015 & 0.038891 \tabularnewline
8 & 0.251829 & 1.7628 & 0.042085 \tabularnewline
9 & -0.0244 & -0.1708 & 0.567457 \tabularnewline
10 & -0.140394 & -0.9828 & 0.834723 \tabularnewline
11 & -0.170191 & -1.1913 & 0.880371 \tabularnewline
12 & -0.052444 & -0.3671 & 0.64244 \tabularnewline
13 & -0.176781 & -1.2375 & 0.889095 \tabularnewline
14 & 0.116991 & 0.8189 & 0.208394 \tabularnewline
15 & -0.125571 & -0.879 & 0.808154 \tabularnewline
16 & -0.017968 & -0.1258 & 0.549788 \tabularnewline
17 & -0.068796 & -0.4816 & 0.683874 \tabularnewline
18 & -0.181376 & -1.2696 & 0.894894 \tabularnewline
19 & 0.012214 & 0.0855 & 0.466107 \tabularnewline
20 & 0.063179 & 0.4422 & 0.330127 \tabularnewline
21 & -0.015275 & -0.1069 & 0.542358 \tabularnewline
22 & 0.097124 & 0.6799 & 0.249893 \tabularnewline
23 & -0.085079 & -0.5956 & 0.722893 \tabularnewline
24 & 0.007949 & 0.0556 & 0.477926 \tabularnewline
25 & -0.028967 & -0.2028 & 0.579923 \tabularnewline
26 & 0.068407 & 0.4788 & 0.317089 \tabularnewline
27 & -0.043204 & -0.3024 & 0.618197 \tabularnewline
28 & 0.024204 & 0.1694 & 0.433078 \tabularnewline
29 & -0.008732 & -0.0611 & 0.524246 \tabularnewline
30 & 0.010317 & 0.0722 & 0.47136 \tabularnewline
31 & -0.060549 & -0.4238 & 0.663233 \tabularnewline
32 & -0.008778 & -0.0614 & 0.524373 \tabularnewline
33 & -0.112485 & -0.7874 & 0.782578 \tabularnewline
34 & -0.136003 & -0.952 & 0.82712 \tabularnewline
35 & -0.029356 & -0.2055 & 0.58098 \tabularnewline
36 & 0.002308 & 0.0162 & 0.493587 \tabularnewline
37 & -0.046541 & -0.3258 & 0.627015 \tabularnewline
38 & -0.026544 & -0.1858 & 0.573317 \tabularnewline
39 & 0.012542 & 0.0878 & 0.465198 \tabularnewline
40 & 0.05044 & 0.3531 & 0.362772 \tabularnewline
41 & 0.004684 & 0.0328 & 0.486988 \tabularnewline
42 & 0.031678 & 0.2217 & 0.412716 \tabularnewline
43 & 0.025799 & 0.1806 & 0.428717 \tabularnewline
44 & 0.065979 & 0.4619 & 0.323115 \tabularnewline
45 & -0.115729 & -0.8101 & 0.789101 \tabularnewline
46 & -0.020888 & -0.1462 & 0.557825 \tabularnewline
47 & -0.011231 & -0.0786 & 0.531172 \tabularnewline
\hline
\end{tabular}
%Source: https://freestatistics.org/blog/index.php?pk=2441&T=2

[TABLE]
[ROW][C]Partial Autocorrelation Function[/C][/ROW]
[ROW][C]Time lag k[/C][C]PACF(k)[/C][C]T-STAT[/C][C]P-value[/C][/ROW]
[ROW][C]0[/C][C]0.0772[/C][C]0.5404[/C][C]0.295685[/C][/ROW]
[ROW][C]1[/C][C]-0.041808[/C][C]-0.2927[/C][C]0.614489[/C][/ROW]
[ROW][C]2[/C][C]0.03656[/C][C]0.2559[/C][C]0.399543[/C][/ROW]
[ROW][C]3[/C][C]-0.161758[/C][C]-1.1323[/C][C]0.868492[/C][/ROW]
[ROW][C]4[/C][C]0.228194[/C][C]1.5974[/C][C]0.058307[/C][/ROW]
[ROW][C]5[/C][C]0.109589[/C][C]0.7671[/C][C]0.223345[/C][/ROW]
[ROW][C]6[/C][C]-0.278698[/C][C]-1.9509[/C][C]0.971599[/C][/ROW]
[ROW][C]7[/C][C]0.257355[/C][C]1.8015[/C][C]0.038891[/C][/ROW]
[ROW][C]8[/C][C]0.251829[/C][C]1.7628[/C][C]0.042085[/C][/ROW]
[ROW][C]9[/C][C]-0.0244[/C][C]-0.1708[/C][C]0.567457[/C][/ROW]
[ROW][C]10[/C][C]-0.140394[/C][C]-0.9828[/C][C]0.834723[/C][/ROW]
[ROW][C]11[/C][C]-0.170191[/C][C]-1.1913[/C][C]0.880371[/C][/ROW]
[ROW][C]12[/C][C]-0.052444[/C][C]-0.3671[/C][C]0.64244[/C][/ROW]
[ROW][C]13[/C][C]-0.176781[/C][C]-1.2375[/C][C]0.889095[/C][/ROW]
[ROW][C]14[/C][C]0.116991[/C][C]0.8189[/C][C]0.208394[/C][/ROW]
[ROW][C]15[/C][C]-0.125571[/C][C]-0.879[/C][C]0.808154[/C][/ROW]
[ROW][C]16[/C][C]-0.017968[/C][C]-0.1258[/C][C]0.549788[/C][/ROW]
[ROW][C]17[/C][C]-0.068796[/C][C]-0.4816[/C][C]0.683874[/C][/ROW]
[ROW][C]18[/C][C]-0.181376[/C][C]-1.2696[/C][C]0.894894[/C][/ROW]
[ROW][C]19[/C][C]0.012214[/C][C]0.0855[/C][C]0.466107[/C][/ROW]
[ROW][C]20[/C][C]0.063179[/C][C]0.4422[/C][C]0.330127[/C][/ROW]
[ROW][C]21[/C][C]-0.015275[/C][C]-0.1069[/C][C]0.542358[/C][/ROW]
[ROW][C]22[/C][C]0.097124[/C][C]0.6799[/C][C]0.249893[/C][/ROW]
[ROW][C]23[/C][C]-0.085079[/C][C]-0.5956[/C][C]0.722893[/C][/ROW]
[ROW][C]24[/C][C]0.007949[/C][C]0.0556[/C][C]0.477926[/C][/ROW]
[ROW][C]25[/C][C]-0.028967[/C][C]-0.2028[/C][C]0.579923[/C][/ROW]
[ROW][C]26[/C][C]0.068407[/C][C]0.4788[/C][C]0.317089[/C][/ROW]
[ROW][C]27[/C][C]-0.043204[/C][C]-0.3024[/C][C]0.618197[/C][/ROW]
[ROW][C]28[/C][C]0.024204[/C][C]0.1694[/C][C]0.433078[/C][/ROW]
[ROW][C]29[/C][C]-0.008732[/C][C]-0.0611[/C][C]0.524246[/C][/ROW]
[ROW][C]30[/C][C]0.010317[/C][C]0.0722[/C][C]0.47136[/C][/ROW]
[ROW][C]31[/C][C]-0.060549[/C][C]-0.4238[/C][C]0.663233[/C][/ROW]
[ROW][C]32[/C][C]-0.008778[/C][C]-0.0614[/C][C]0.524373[/C][/ROW]
[ROW][C]33[/C][C]-0.112485[/C][C]-0.7874[/C][C]0.782578[/C][/ROW]
[ROW][C]34[/C][C]-0.136003[/C][C]-0.952[/C][C]0.82712[/C][/ROW]
[ROW][C]35[/C][C]-0.029356[/C][C]-0.2055[/C][C]0.58098[/C][/ROW]
[ROW][C]36[/C][C]0.002308[/C][C]0.0162[/C][C]0.493587[/C][/ROW]
[ROW][C]37[/C][C]-0.046541[/C][C]-0.3258[/C][C]0.627015[/C][/ROW]
[ROW][C]38[/C][C]-0.026544[/C][C]-0.1858[/C][C]0.573317[/C][/ROW]
[ROW][C]39[/C][C]0.012542[/C][C]0.0878[/C][C]0.465198[/C][/ROW]
[ROW][C]40[/C][C]0.05044[/C][C]0.3531[/C][C]0.362772[/C][/ROW]
[ROW][C]41[/C][C]0.004684[/C][C]0.0328[/C][C]0.486988[/C][/ROW]
[ROW][C]42[/C][C]0.031678[/C][C]0.2217[/C][C]0.412716[/C][/ROW]
[ROW][C]43[/C][C]0.025799[/C][C]0.1806[/C][C]0.428717[/C][/ROW]
[ROW][C]44[/C][C]0.065979[/C][C]0.4619[/C][C]0.323115[/C][/ROW]
[ROW][C]45[/C][C]-0.115729[/C][C]-0.8101[/C][C]0.789101[/C][/ROW]
[ROW][C]46[/C][C]-0.020888[/C][C]-0.1462[/C][C]0.557825[/C][/ROW]
[ROW][C]47[/C][C]-0.011231[/C][C]-0.0786[/C][C]0.531172[/C][/ROW]
[/TABLE]
Source: https://freestatistics.org/blog/index.php?pk=2441&T=2

Globally Unique Identifier (entire table): ba.freestatistics.org/blog/index.php?pk=2441&T=2

As an alternative you can also use a QR Code:  

The GUIDs for individual cells are displayed in the table below:

Partial Autocorrelation Function
Time lag kPACF(k)T-STATP-value
00.07720.54040.295685
1-0.041808-0.29270.614489
20.036560.25590.399543
3-0.161758-1.13230.868492
40.2281941.59740.058307
50.1095890.76710.223345
6-0.278698-1.95090.971599
70.2573551.80150.038891
80.2518291.76280.042085
9-0.0244-0.17080.567457
10-0.140394-0.98280.834723
11-0.170191-1.19130.880371
12-0.052444-0.36710.64244
13-0.176781-1.23750.889095
140.1169910.81890.208394
15-0.125571-0.8790.808154
16-0.017968-0.12580.549788
17-0.068796-0.48160.683874
18-0.181376-1.26960.894894
190.0122140.08550.466107
200.0631790.44220.330127
21-0.015275-0.10690.542358
220.0971240.67990.249893
23-0.085079-0.59560.722893
240.0079490.05560.477926
25-0.028967-0.20280.579923
260.0684070.47880.317089
27-0.043204-0.30240.618197
280.0242040.16940.433078
29-0.008732-0.06110.524246
300.0103170.07220.47136
31-0.060549-0.42380.663233
32-0.008778-0.06140.524373
33-0.112485-0.78740.782578
34-0.136003-0.9520.82712
35-0.029356-0.20550.58098
360.0023080.01620.493587
37-0.046541-0.32580.627015
38-0.026544-0.18580.573317
390.0125420.08780.465198
400.050440.35310.362772
410.0046840.03280.486988
420.0316780.22170.412716
430.0257990.18060.428717
440.0659790.46190.323115
45-0.115729-0.81010.789101
46-0.020888-0.14620.557825
47-0.011231-0.07860.531172


Parameters (Session):
par1 = 48 ; par2 = 1 ; par3 = 0 ; par4 = 1 ; par5 = 12 ;
Parameters (R input):
par1 = 48 ; par2 = 1 ; par3 = 0 ; par4 = 1 ; par5 = 12 ;
R code (references can be found in the software module):
if (par1 == 'Default') {
par1 = 10*log10(length(x))
} else {
par1 <- as.numeric(par1)
}
par2 <- as.numeric(par2)
par3 <- as.numeric(par3)
par4 <- as.numeric(par4)
par5 <- as.numeric(par5)
if (par2 == 0) {
x <- log(x)
} else {
x <- (x ^ par2 - 1) / par2
}
if (par3 > 0) x <- diff(x,lag=1,difference=par3)
if (par4 > 0) x <- diff(x,lag=par5,difference=par4)
bitmap(file='pic1.png')
racf <- acf(x,par1,main='Autocorrelation',xlab='lags',ylab='ACF')
dev.off()
bitmap(file='pic2.png')
rpacf <- pacf(x,par1,main='Partial Autocorrelation',xlab='lags',ylab='PACF')
dev.off()
(myacf <- c(racf$acf))
(mypacf <- c(rpacf$acf))
lengthx <- length(x)
sqrtn <- sqrt(lengthx)
load(file='createtable')
a<-table.start()
a<-table.row.start(a)
a<-table.element(a,'Autocorrelation Function',4,TRUE)
a<-table.row.end(a)
a<-table.row.start(a)
a<-table.element(a,'Time lag k',header=TRUE)
a<-table.element(a,hyperlink('basics.htm','ACF(k)','click here for more information about the Autocorrelation Function'),header=TRUE)
a<-table.element(a,'T-STAT',header=TRUE)
a<-table.element(a,'P-value',header=TRUE)
a<-table.row.end(a)
for (i in 1:par1) {
a<-table.row.start(a)
a<-table.element(a,i-1,header=TRUE)
a<-table.element(a,round(myacf[i],6))
mytstat <- myacf[i]*sqrtn
a<-table.element(a,round(mytstat,4))
a<-table.element(a,round(1-pt(mytstat,lengthx),6))
a<-table.row.end(a)
}
a<-table.end(a)
table.save(a,file='mytable.tab')
a<-table.start()
a<-table.row.start(a)
a<-table.element(a,'Partial Autocorrelation Function',4,TRUE)
a<-table.row.end(a)
a<-table.row.start(a)
a<-table.element(a,'Time lag k',header=TRUE)
a<-table.element(a,hyperlink('basics.htm','PACF(k)','click here for more information about the Partial Autocorrelation Function'),header=TRUE)
a<-table.element(a,'T-STAT',header=TRUE)
a<-table.element(a,'P-value',header=TRUE)
a<-table.row.end(a)
for (i in 1:par1) {
a<-table.row.start(a)
a<-table.element(a,i-1,header=TRUE)
a<-table.element(a,round(mypacf[i],6))
mytstat <- mypacf[i]*sqrtn
a<-table.element(a,round(mytstat,4))
a<-table.element(a,round(1-pt(mytstat,lengthx),6))
a<-table.row.end(a)
}
a<-table.end(a)
table.save(a,file='mytable1.tab')