Free Statistics

of Irreproducible Research!

Author's title

Author*Unverified author*
R Software Modulerwasp_arimabackwardselection.wasp
Title produced by softwareARIMA Backward Selection
Date of computationTue, 04 Dec 2007 12:08:41 -0700
Cite this page as followsStatistical Computations at FreeStatistics.org, Office for Research Development and Education, URL https://freestatistics.org/blog/index.php?v=date/2007/Dec/04/t1196794569pzeb4r6alhs4qzo.htm/, Retrieved Thu, 02 May 2024 10:16:58 +0000
Statistical Computations at FreeStatistics.org, Office for Research Development and Education, URL https://freestatistics.org/blog/index.php?pk=2437, Retrieved Thu, 02 May 2024 10:16:58 +0000
QR Codes:

Original text written by user:
IsPrivate?No (this computation is public)
User-defined keywords
Estimated Impact179
Family? (F = Feedback message, R = changed R code, M = changed R Module, P = changed Parameters, D = changed Data)
-       [ARIMA Backward Selection] [] [2007-12-04 19:08:41] [67794d83edd3193bd9ea9816803ddb96] [Current]
Feedback Forum

Post a new message
Dataseries X:
5329
4903
5826
6006
6552
6748
5633
5361
6631
7078
6100
6376
5571
5512
5461
5704
6420
6344
5624
5322
6098
6303
5581
5491
5108
4585
5545
5145
5888
5925
5715
5595
6160
6163
5906
5045
5130
4743
5438
5698
6333
6340
5635
5948
6199
6023
4540
4315
5161
4433
5199
5582
5936
6391
5647
5827
6101
5777
5511
5036
4468
4053
4821
5138
6102
6029
5365
5717
6150
5737
5268
5307


Summary of compuational transaction
Raw Inputview raw input (R code)
Raw Outputview raw output of R engine
Computing time5 seconds
R Server'Gwilym Jenkins' @ 72.249.127.135

\begin{tabular}{lllllllll}
\hline
Summary of compuational transaction \tabularnewline
Raw Input & view raw input (R code)  \tabularnewline
Raw Output & view raw output of R engine  \tabularnewline
Computing time & 5 seconds \tabularnewline
R Server & 'Gwilym Jenkins' @ 72.249.127.135 \tabularnewline
\hline
\end{tabular}
%Source: https://freestatistics.org/blog/index.php?pk=2437&T=0

[TABLE]
[ROW][C]Summary of compuational transaction[/C][/ROW]
[ROW][C]Raw Input[/C][C]view raw input (R code) [/C][/ROW]
[ROW][C]Raw Output[/C][C]view raw output of R engine [/C][/ROW]
[ROW][C]Computing time[/C][C]5 seconds[/C][/ROW]
[ROW][C]R Server[/C][C]'Gwilym Jenkins' @ 72.249.127.135[/C][/ROW]
[/TABLE]
Source: https://freestatistics.org/blog/index.php?pk=2437&T=0

Globally Unique Identifier (entire table): ba.freestatistics.org/blog/index.php?pk=2437&T=0

As an alternative you can also use a QR Code:  

The GUIDs for individual cells are displayed in the table below:

Summary of compuational transaction
Raw Inputview raw input (R code)
Raw Outputview raw output of R engine
Computing time5 seconds
R Server'Gwilym Jenkins' @ 72.249.127.135


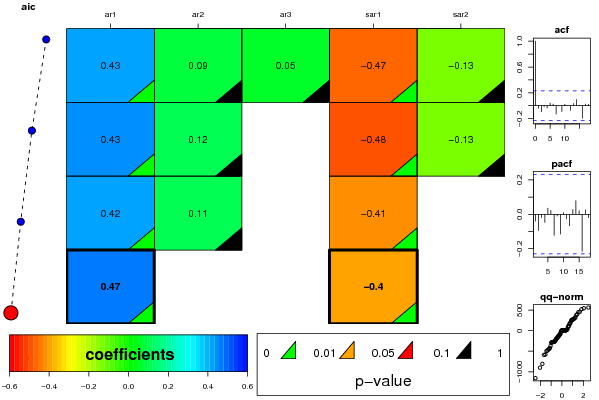
ARIMA Parameter Estimation and Backward Selection
Iterationar1ar2ar3sar1sar2
Estimates ( 1 )0.42580.09290.0533-0.4691-0.1281
(p-val)(0.002 )(0.5182 )(0.6926 )(0.0038 )(0.4469 )
Estimates ( 2 )0.43430.11740-0.4811-0.1286
(p-val)(0.0015 )(0.3668 )(NA )(0.0026 )(0.4482 )
Estimates ( 3 )0.41940.11130-0.41440
(p-val)(0.0019 )(0.3926 )(NA )(0.0015 )(NA )
Estimates ( 4 )0.470600-0.40430
(p-val)(1e-04 )(NA )(NA )(0.0021 )(NA )

\begin{tabular}{lllllllll}
\hline
ARIMA Parameter Estimation and Backward Selection \tabularnewline
Iteration & ar1 & ar2 & ar3 & sar1 & sar2 \tabularnewline
Estimates ( 1 ) & 0.4258 & 0.0929 & 0.0533 & -0.4691 & -0.1281 \tabularnewline
(p-val) & (0.002 ) & (0.5182 ) & (0.6926 ) & (0.0038 ) & (0.4469 ) \tabularnewline
Estimates ( 2 ) & 0.4343 & 0.1174 & 0 & -0.4811 & -0.1286 \tabularnewline
(p-val) & (0.0015 ) & (0.3668 ) & (NA ) & (0.0026 ) & (0.4482 ) \tabularnewline
Estimates ( 3 ) & 0.4194 & 0.1113 & 0 & -0.4144 & 0 \tabularnewline
(p-val) & (0.0019 ) & (0.3926 ) & (NA ) & (0.0015 ) & (NA ) \tabularnewline
Estimates ( 4 ) & 0.4706 & 0 & 0 & -0.4043 & 0 \tabularnewline
(p-val) & (1e-04 ) & (NA ) & (NA ) & (0.0021 ) & (NA ) \tabularnewline
\hline
\end{tabular}
%Source: https://freestatistics.org/blog/index.php?pk=2437&T=1

[TABLE]
[ROW][C]ARIMA Parameter Estimation and Backward Selection[/C][/ROW]
[ROW][C]Iteration[/C][C]ar1[/C][C]ar2[/C][C]ar3[/C][C]sar1[/C][C]sar2[/C][/ROW]
[ROW][C]Estimates ( 1 )[/C][C]0.4258[/C][C]0.0929[/C][C]0.0533[/C][C]-0.4691[/C][C]-0.1281[/C][/ROW]
[ROW][C](p-val)[/C][C](0.002 )[/C][C](0.5182 )[/C][C](0.6926 )[/C][C](0.0038 )[/C][C](0.4469 )[/C][/ROW]
[ROW][C]Estimates ( 2 )[/C][C]0.4343[/C][C]0.1174[/C][C]0[/C][C]-0.4811[/C][C]-0.1286[/C][/ROW]
[ROW][C](p-val)[/C][C](0.0015 )[/C][C](0.3668 )[/C][C](NA )[/C][C](0.0026 )[/C][C](0.4482 )[/C][/ROW]
[ROW][C]Estimates ( 3 )[/C][C]0.4194[/C][C]0.1113[/C][C]0[/C][C]-0.4144[/C][C]0[/C][/ROW]
[ROW][C](p-val)[/C][C](0.0019 )[/C][C](0.3926 )[/C][C](NA )[/C][C](0.0015 )[/C][C](NA )[/C][/ROW]
[ROW][C]Estimates ( 4 )[/C][C]0.4706[/C][C]0[/C][C]0[/C][C]-0.4043[/C][C]0[/C][/ROW]
[ROW][C](p-val)[/C][C](1e-04 )[/C][C](NA )[/C][C](NA )[/C][C](0.0021 )[/C][C](NA )[/C][/ROW]
[/TABLE]
Source: https://freestatistics.org/blog/index.php?pk=2437&T=1

Globally Unique Identifier (entire table): ba.freestatistics.org/blog/index.php?pk=2437&T=1

As an alternative you can also use a QR Code:  

The GUIDs for individual cells are displayed in the table below:

ARIMA Parameter Estimation and Backward Selection
Iterationar1ar2ar3sar1sar2
Estimates ( 1 )0.42580.09290.0533-0.4691-0.1281
(p-val)(0.002 )(0.5182 )(0.6926 )(0.0038 )(0.4469 )
Estimates ( 2 )0.43430.11740-0.4811-0.1286
(p-val)(0.0015 )(0.3668 )(NA )(0.0026 )(0.4482 )
Estimates ( 3 )0.41940.11130-0.41440
(p-val)(0.0019 )(0.3926 )(NA )(0.0015 )(NA )
Estimates ( 4 )0.470600-0.40430
(p-val)(1e-04 )(NA )(NA )(0.0021 )(NA )


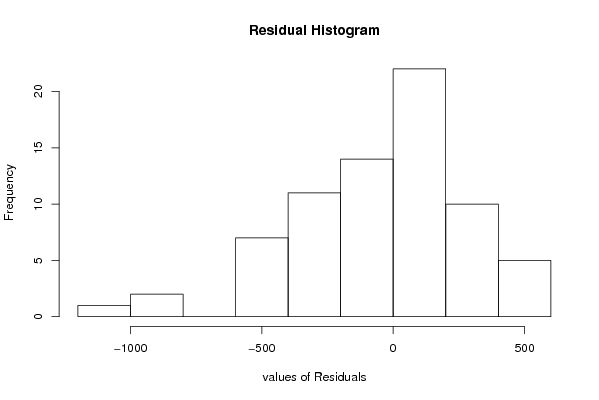
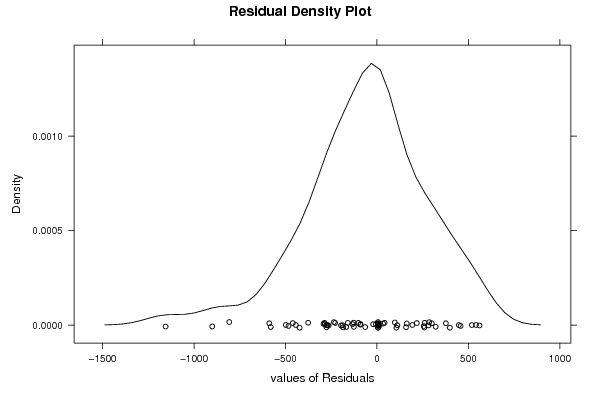
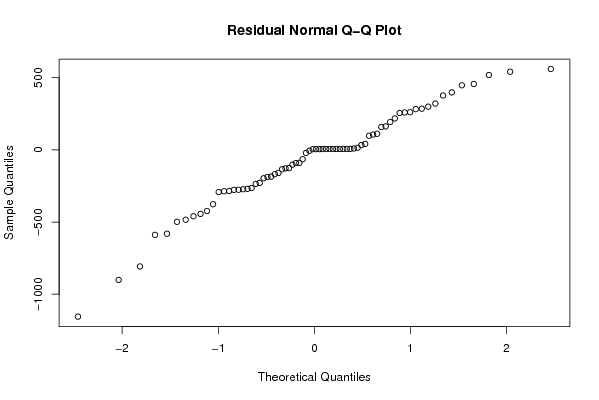
Estimated ARIMA Residuals
Value
6.37598706895282
193.112796156564
447.805026885614
-588.689714940649
-196.413588507446
33.3953539250992
-284.594789459344
162.874871959820
14.6466086169682
-460.022407482216
-483.92503608696
-102.145432475125
-498.379193570998
-20.9455687383278
-443.498843341936
256.056204089027
-580.872774247073
-292.250049194493
-264.205664294686
398.537436027808
285.490474250696
-276.336138472884
-423.121377769891
321.034087725885
-807.555439130542
158.803021127254
-64.4785827544571
41.5896101358385
376.778584807881
97.7714316942565
111.418677145101
-168.505338132464
457.020343122221
-126.121469339543
-277.030060842044
-1155.4477425419
-376.332552366775
560.866513170363
-159.542072404046
-185.245948690053
259.242333100536
-228.519411872808
299.560589568781
-91.0326269566558
9.35487618264597
-90.0932607051682
-272.509736761583
541.507526266461
282.466931906795
-900.730747132239
-269.753292174928
-188.083116540245
-235.392969777482
260.955215810631
-286.721167436526
-134.215434528737
-6.01674159011054
106.386363260823
-127.647289296377
218.026250924401
518.737724177226

\begin{tabular}{lllllllll}
\hline
Estimated ARIMA Residuals \tabularnewline
Value \tabularnewline
6.37598706895282 \tabularnewline
193.112796156564 \tabularnewline
447.805026885614 \tabularnewline
-588.689714940649 \tabularnewline
-196.413588507446 \tabularnewline
33.3953539250992 \tabularnewline
-284.594789459344 \tabularnewline
162.874871959820 \tabularnewline
14.6466086169682 \tabularnewline
-460.022407482216 \tabularnewline
-483.92503608696 \tabularnewline
-102.145432475125 \tabularnewline
-498.379193570998 \tabularnewline
-20.9455687383278 \tabularnewline
-443.498843341936 \tabularnewline
256.056204089027 \tabularnewline
-580.872774247073 \tabularnewline
-292.250049194493 \tabularnewline
-264.205664294686 \tabularnewline
398.537436027808 \tabularnewline
285.490474250696 \tabularnewline
-276.336138472884 \tabularnewline
-423.121377769891 \tabularnewline
321.034087725885 \tabularnewline
-807.555439130542 \tabularnewline
158.803021127254 \tabularnewline
-64.4785827544571 \tabularnewline
41.5896101358385 \tabularnewline
376.778584807881 \tabularnewline
97.7714316942565 \tabularnewline
111.418677145101 \tabularnewline
-168.505338132464 \tabularnewline
457.020343122221 \tabularnewline
-126.121469339543 \tabularnewline
-277.030060842044 \tabularnewline
-1155.4477425419 \tabularnewline
-376.332552366775 \tabularnewline
560.866513170363 \tabularnewline
-159.542072404046 \tabularnewline
-185.245948690053 \tabularnewline
259.242333100536 \tabularnewline
-228.519411872808 \tabularnewline
299.560589568781 \tabularnewline
-91.0326269566558 \tabularnewline
9.35487618264597 \tabularnewline
-90.0932607051682 \tabularnewline
-272.509736761583 \tabularnewline
541.507526266461 \tabularnewline
282.466931906795 \tabularnewline
-900.730747132239 \tabularnewline
-269.753292174928 \tabularnewline
-188.083116540245 \tabularnewline
-235.392969777482 \tabularnewline
260.955215810631 \tabularnewline
-286.721167436526 \tabularnewline
-134.215434528737 \tabularnewline
-6.01674159011054 \tabularnewline
106.386363260823 \tabularnewline
-127.647289296377 \tabularnewline
218.026250924401 \tabularnewline
518.737724177226 \tabularnewline
\hline
\end{tabular}
%Source: https://freestatistics.org/blog/index.php?pk=2437&T=2

[TABLE]
[ROW][C]Estimated ARIMA Residuals[/C][/ROW]
[ROW][C]Value[/C][/ROW]
[ROW][C]6.37598706895282[/C][/ROW]
[ROW][C]193.112796156564[/C][/ROW]
[ROW][C]447.805026885614[/C][/ROW]
[ROW][C]-588.689714940649[/C][/ROW]
[ROW][C]-196.413588507446[/C][/ROW]
[ROW][C]33.3953539250992[/C][/ROW]
[ROW][C]-284.594789459344[/C][/ROW]
[ROW][C]162.874871959820[/C][/ROW]
[ROW][C]14.6466086169682[/C][/ROW]
[ROW][C]-460.022407482216[/C][/ROW]
[ROW][C]-483.92503608696[/C][/ROW]
[ROW][C]-102.145432475125[/C][/ROW]
[ROW][C]-498.379193570998[/C][/ROW]
[ROW][C]-20.9455687383278[/C][/ROW]
[ROW][C]-443.498843341936[/C][/ROW]
[ROW][C]256.056204089027[/C][/ROW]
[ROW][C]-580.872774247073[/C][/ROW]
[ROW][C]-292.250049194493[/C][/ROW]
[ROW][C]-264.205664294686[/C][/ROW]
[ROW][C]398.537436027808[/C][/ROW]
[ROW][C]285.490474250696[/C][/ROW]
[ROW][C]-276.336138472884[/C][/ROW]
[ROW][C]-423.121377769891[/C][/ROW]
[ROW][C]321.034087725885[/C][/ROW]
[ROW][C]-807.555439130542[/C][/ROW]
[ROW][C]158.803021127254[/C][/ROW]
[ROW][C]-64.4785827544571[/C][/ROW]
[ROW][C]41.5896101358385[/C][/ROW]
[ROW][C]376.778584807881[/C][/ROW]
[ROW][C]97.7714316942565[/C][/ROW]
[ROW][C]111.418677145101[/C][/ROW]
[ROW][C]-168.505338132464[/C][/ROW]
[ROW][C]457.020343122221[/C][/ROW]
[ROW][C]-126.121469339543[/C][/ROW]
[ROW][C]-277.030060842044[/C][/ROW]
[ROW][C]-1155.4477425419[/C][/ROW]
[ROW][C]-376.332552366775[/C][/ROW]
[ROW][C]560.866513170363[/C][/ROW]
[ROW][C]-159.542072404046[/C][/ROW]
[ROW][C]-185.245948690053[/C][/ROW]
[ROW][C]259.242333100536[/C][/ROW]
[ROW][C]-228.519411872808[/C][/ROW]
[ROW][C]299.560589568781[/C][/ROW]
[ROW][C]-91.0326269566558[/C][/ROW]
[ROW][C]9.35487618264597[/C][/ROW]
[ROW][C]-90.0932607051682[/C][/ROW]
[ROW][C]-272.509736761583[/C][/ROW]
[ROW][C]541.507526266461[/C][/ROW]
[ROW][C]282.466931906795[/C][/ROW]
[ROW][C]-900.730747132239[/C][/ROW]
[ROW][C]-269.753292174928[/C][/ROW]
[ROW][C]-188.083116540245[/C][/ROW]
[ROW][C]-235.392969777482[/C][/ROW]
[ROW][C]260.955215810631[/C][/ROW]
[ROW][C]-286.721167436526[/C][/ROW]
[ROW][C]-134.215434528737[/C][/ROW]
[ROW][C]-6.01674159011054[/C][/ROW]
[ROW][C]106.386363260823[/C][/ROW]
[ROW][C]-127.647289296377[/C][/ROW]
[ROW][C]218.026250924401[/C][/ROW]
[ROW][C]518.737724177226[/C][/ROW]
[/TABLE]
Source: https://freestatistics.org/blog/index.php?pk=2437&T=2

Globally Unique Identifier (entire table): ba.freestatistics.org/blog/index.php?pk=2437&T=2

As an alternative you can also use a QR Code:  

The GUIDs for individual cells are displayed in the table below:

Estimated ARIMA Residuals
Value
6.37598706895282
193.112796156564
447.805026885614
-588.689714940649
-196.413588507446
33.3953539250992
-284.594789459344
162.874871959820
14.6466086169682
-460.022407482216
-483.92503608696
-102.145432475125
-498.379193570998
-20.9455687383278
-443.498843341936
256.056204089027
-580.872774247073
-292.250049194493
-264.205664294686
398.537436027808
285.490474250696
-276.336138472884
-423.121377769891
321.034087725885
-807.555439130542
158.803021127254
-64.4785827544571
41.5896101358385
376.778584807881
97.7714316942565
111.418677145101
-168.505338132464
457.020343122221
-126.121469339543
-277.030060842044
-1155.4477425419
-376.332552366775
560.866513170363
-159.542072404046
-185.245948690053
259.242333100536
-228.519411872808
299.560589568781
-91.0326269566558
9.35487618264597
-90.0932607051682
-272.509736761583
541.507526266461
282.466931906795
-900.730747132239
-269.753292174928
-188.083116540245
-235.392969777482
260.955215810631
-286.721167436526
-134.215434528737
-6.01674159011054
106.386363260823
-127.647289296377
218.026250924401
518.737724177226


Parameters (Session):
par1 = FALSE ; par2 = 1 ; par3 = 0 ; par4 = 1 ; par5 = 12 ; par6 = 3 ; par7 = 1 ; par8 = 2 ; par9 = 1 ;
Parameters (R input):
par1 = FALSE ; par2 = 1 ; par3 = 0 ; par4 = 1 ; par5 = 12 ; par6 = 3 ; par7 = 0 ; par8 = 2 ; par9 = 0 ;
R code (references can be found in the software module):
library(lattice)
if (par1 == 'TRUE') par1 <- TRUE
if (par1 == 'FALSE') par1 <- FALSE
par2 <- as.numeric(par2) #Box-Cox lambda transformation parameter
par3 <- as.numeric(par3) #degree of non-seasonal differencing
par4 <- as.numeric(par4) #degree of seasonal differencing
par5 <- as.numeric(par5) #seasonal period
par6 <- as.numeric(par6) #degree (p) of the non-seasonal AR(p) polynomial
par7 <- as.numeric(par7) #degree (q) of the non-seasonal MA(q) polynomial
par8 <- as.numeric(par8) #degree (P) of the seasonal AR(P) polynomial
par9 <- as.numeric(par9) #degree (Q) of the seasonal MA(Q) polynomial
armaGR <- function(arima.out, names, n){
try1 <- arima.out$coef
try2 <- sqrt(diag(arima.out$var.coef))
try.data.frame <- data.frame(matrix(NA,ncol=4,nrow=length(names)))
dimnames(try.data.frame) <- list(names,c('coef','std','tstat','pv'))
try.data.frame[,1] <- try1
for(i in 1:length(try2)) try.data.frame[which(rownames(try.data.frame)==names(try2)[i]),2] <- try2[i]
try.data.frame[,3] <- try.data.frame[,1] / try.data.frame[,2]
try.data.frame[,4] <- round((1-pt(abs(try.data.frame[,3]),df=n-(length(try2)+1)))*2,5)
vector <- rep(NA,length(names))
vector[is.na(try.data.frame[,4])] <- 0
maxi <- which.max(try.data.frame[,4])
continue <- max(try.data.frame[,4],na.rm=TRUE) > .05
vector[maxi] <- 0
list(summary=try.data.frame,next.vector=vector,continue=continue)
}
arimaSelect <- function(series, order=c(13,0,0), seasonal=list(order=c(2,0,0),period=12), include.mean=F){
nrc <- order[1]+order[3]+seasonal$order[1]+seasonal$order[3]
coeff <- matrix(NA, nrow=nrc, ncol=nrc)
pval <- matrix(NA, nrow=nrc, ncol=nrc)
mylist <- rep(list(NULL), nrc)
names <- NULL
if(order[1] > 0) names <- paste('ar',1:order[1],sep='')
if(order[3] > 0) names <- c( names , paste('ma',1:order[3],sep='') )
if(seasonal$order[1] > 0) names <- c(names, paste('sar',1:seasonal$order[1],sep=''))
if(seasonal$order[3] > 0) names <- c(names, paste('sma',1:seasonal$order[3],sep=''))
arima.out <- arima(series, order=order, seasonal=seasonal, include.mean=include.mean, method='ML')
mylist[[1]] <- arima.out
last.arma <- armaGR(arima.out, names, length(series))
mystop <- FALSE
i <- 1
coeff[i,] <- last.arma[[1]][,1]
pval [i,] <- last.arma[[1]][,4]
i <- 2
aic <- arima.out$aic
while(!mystop){
mylist[[i]] <- arima.out
arima.out <- arima(series, order=order, seasonal=seasonal, include.mean=include.mean, method='ML', fixed=last.arma$next.vector)
aic <- c(aic, arima.out$aic)
last.arma <- armaGR(arima.out, names, length(series))
mystop <- !last.arma$continue
coeff[i,] <- last.arma[[1]][,1]
pval [i,] <- last.arma[[1]][,4]
i <- i+1
}
list(coeff, pval, mylist, aic=aic)
}
arimaSelectplot <- function(arimaSelect.out,noms,choix){
noms <- names(arimaSelect.out[[3]][[1]]$coef)
coeff <- arimaSelect.out[[1]]
k <- min(which(is.na(coeff[,1])))-1
coeff <- coeff[1:k,]
pval <- arimaSelect.out[[2]][1:k,]
aic <- arimaSelect.out$aic[1:k]
coeff[coeff==0] <- NA
n <- ncol(coeff)
if(missing(choix)) choix <- k
layout(matrix(c(1,1,1,2,
3,3,3,2,
3,3,3,4,
5,6,7,7),nr=4),
widths=c(10,35,45,15),
heights=c(30,30,15,15))
couleurs <- rainbow(75)[1:50]#(50)
ticks <- pretty(coeff)
par(mar=c(1,1,3,1))
plot(aic,k:1-.5,type='o',pch=21,bg='blue',cex=2,axes=F,lty=2,xpd=NA)
points(aic[choix],k-choix+.5,pch=21,cex=4,bg=2,xpd=NA)
title('aic',line=2)
par(mar=c(3,0,0,0))
plot(0,axes=F,xlab='',ylab='',xlim=range(ticks),ylim=c(.1,1))
rect(xleft = min(ticks) + (0:49)/50*(max(ticks)-min(ticks)),
xright = min(ticks) + (1:50)/50*(max(ticks)-min(ticks)),
ytop = rep(1,50),
ybottom= rep(0,50),col=couleurs,border=NA)
axis(1,ticks)
rect(xleft=min(ticks),xright=max(ticks),ytop=1,ybottom=0)
text(mean(coeff,na.rm=T),.5,'coefficients',cex=2,font=2)
par(mar=c(1,1,3,1))
image(1:n,1:k,t(coeff[k:1,]),axes=F,col=couleurs,zlim=range(ticks))
for(i in 1:n) for(j in 1:k) if(!is.na(coeff[j,i])) {
if(pval[j,i]<.01) symb = 'green'
else if( (pval[j,i]<.05) & (pval[j,i]>=.01)) symb = 'orange'
else if( (pval[j,i]<.1) & (pval[j,i]>=.05)) symb = 'red'
else symb = 'black'
polygon(c(i+.5 ,i+.2 ,i+.5 ,i+.5),
c(k-j+0.5,k-j+0.5,k-j+0.8,k-j+0.5),
col=symb)
if(j==choix) {
rect(xleft=i-.5,
xright=i+.5,
ybottom=k-j+1.5,
ytop=k-j+.5,
lwd=4)
text(i,
k-j+1,
round(coeff[j,i],2),
cex=1.2,
font=2)
}
else{
rect(xleft=i-.5,xright=i+.5,ybottom=k-j+1.5,ytop=k-j+.5)
text(i,k-j+1,round(coeff[j,i],2),cex=1.2,font=1)
}
}
axis(3,1:n,noms)
par(mar=c(0.5,0,0,0.5))
plot(0,axes=F,xlab='',ylab='',type='n',xlim=c(0,8),ylim=c(-.2,.8))
cols <- c('green','orange','red','black')
niv <- c('0','0.01','0.05','0.1')
for(i in 0:3){
polygon(c(1+2*i ,1+2*i ,1+2*i-.5 ,1+2*i),
c(.4 ,.7 , .4 , .4),
col=cols[i+1])
text(2*i,0.5,niv[i+1],cex=1.5)
}
text(8,.5,1,cex=1.5)
text(4,0,'p-value',cex=2)
box()
residus <- arimaSelect.out[[3]][[choix]]$res
par(mar=c(1,2,4,1))
acf(residus,main='')
title('acf',line=.5)
par(mar=c(1,2,4,1))
pacf(residus,main='')
title('pacf',line=.5)
par(mar=c(2,2,4,1))
qqnorm(residus,main='')
title('qq-norm',line=.5)
residus
}
if (par2 == 0) x <- log(x)
if (par2 != 0) x <- x^par2
(selection <- arimaSelect(x, order=c(par6,par3,par7), seasonal=list(order=c(par8,par4,par9), period=par5)))
bitmap(file='test1.png')
resid <- arimaSelectplot(selection)
dev.off()
resid
bitmap(file='test2.png')
acf(resid,length(resid)/2, main='Residual Autocorrelation Function')
dev.off()
bitmap(file='test3.png')
pacf(resid,length(resid)/2, main='Residual Partial Autocorrelation Function')
dev.off()
bitmap(file='test4.png')
cpgram(resid, main='Residual Cumulative Periodogram')
dev.off()
bitmap(file='test5.png')
hist(resid, main='Residual Histogram', xlab='values of Residuals')
dev.off()
bitmap(file='test6.png')
densityplot(~resid,col='black',main='Residual Density Plot', xlab='values of Residuals')
dev.off()
bitmap(file='test7.png')
qqnorm(resid, main='Residual Normal Q-Q Plot')
dev.off()
ncols <- length(selection[[1]][1,])
nrows <- length(selection[[2]][,1])-1
load(file='createtable')
a<-table.start()
a<-table.row.start(a)
a<-table.element(a,'ARIMA Parameter Estimation and Backward Selection', ncols+1,TRUE)
a<-table.row.end(a)
a<-table.row.start(a)
a<-table.element(a,'Iteration', header=TRUE)
for (i in 1:ncols) {
a<-table.element(a,names(selection[[3]][[1]]$coef)[i],header=TRUE)
}
a<-table.row.end(a)
for (j in 1:nrows) {
a<-table.row.start(a)
mydum <- 'Estimates ('
mydum <- paste(mydum,j)
mydum <- paste(mydum,')')
a<-table.element(a,mydum, header=TRUE)
for (i in 1:ncols) {
a<-table.element(a,round(selection[[1]][j,i],4))
}
a<-table.row.end(a)
a<-table.row.start(a)
a<-table.element(a,'(p-val)', header=TRUE)
for (i in 1:ncols) {
mydum <- '('
mydum <- paste(mydum,round(selection[[2]][j,i],4),sep='')
mydum <- paste(mydum,')')
a<-table.element(a,mydum)
}
a<-table.row.end(a)
}
a<-table.end(a)
table.save(a,file='mytable.tab')
a<-table.start()
a<-table.row.start(a)
a<-table.element(a,'Estimated ARIMA Residuals', 1,TRUE)
a<-table.row.end(a)
a<-table.row.start(a)
a<-table.element(a,'Value', 1,TRUE)
a<-table.row.end(a)
for (i in (par4*par5+par3):length(resid)) {
a<-table.row.start(a)
a<-table.element(a,resid[i])
a<-table.row.end(a)
}
a<-table.end(a)
table.save(a,file='mytable1.tab')