Free Statistics

of Irreproducible Research!

Author's title

Author*Unverified author*
R Software Modulerwasp_cross.wasp
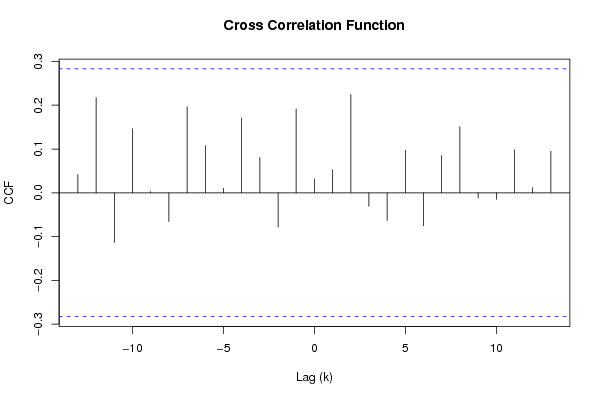
Title produced by softwareCross Correlation Function
Date of computationTue, 04 Dec 2007 09:06:44 -0700
Cite this page as followsStatistical Computations at FreeStatistics.org, Office for Research Development and Education, URL https://freestatistics.org/blog/index.php?v=date/2007/Dec/04/t11967836524rpozb4t4nvo8gh.htm/, Retrieved Thu, 02 May 2024 00:09:52 +0000
Statistical Computations at FreeStatistics.org, Office for Research Development and Education, URL https://freestatistics.org/blog/index.php?pk=2408, Retrieved Thu, 02 May 2024 00:09:52 +0000
QR Codes:

Original text written by user:
IsPrivate?No (this computation is public)
User-defined keywords
Estimated Impact219
Family? (F = Feedback message, R = changed R code, M = changed R Module, P = changed Parameters, D = changed Data)
-       [Cross Correlation Function] [] [2007-12-04 16:06:44] [0c12eff582f43eaf43ae2f09e879befe] [Current]
Feedback Forum

Post a new message
Dataseries X:
106.8
113.7
102.5
96.6
92.1
95.6
102.3
98.6
98.2
104.5
84
73.8
103.9
106
97.2
102.6
89
93.8
116.7
106.8
98.5
118.7
90
91.9
113.3
113.1
104.1
108.7
96.7
101
116.9
105.8
99
129.4
83
88.9
115.9
104.2
113.4
112.2
100.8
107.3
126.6
102.9
117.9
128.8
87.5
93.8
122.7
126.2
124.6
116.7
115.2
111.1
129.9
113.3
118.5
133.5
102.1
102.4
Dataseries Y:
112.6
113.8
107.8
103.2
103.3
101.2
107.7
110.4
101.9
115.9
89.9
88.6
117.2
123.9
100
103.6
94.1
98.7
119.5
112.7
104.4
124.7
89.1
97
121.6
118.8
114
111.5
97.2
102.5
113.4
109.8
104.9
126.1
80
96.8
117.2
112.3
117.3
111.1
102.2
104.3
122.9
107.6
121.3
131.5
89
104.4
128.9
135.9
133.3
121.3
120.5
120.4
137.9
126.1
133.2
146.6
103.4
117.2


Summary of compuational transaction
Raw Inputview raw input (R code)
Raw Outputview raw output of R engine
Computing time1 seconds
R Server'Gwilym Jenkins' @ 72.249.127.135

\begin{tabular}{lllllllll}
\hline
Summary of compuational transaction \tabularnewline
Raw Input & view raw input (R code)  \tabularnewline
Raw Output & view raw output of R engine  \tabularnewline
Computing time & 1 seconds \tabularnewline
R Server & 'Gwilym Jenkins' @ 72.249.127.135 \tabularnewline
\hline
\end{tabular}
%Source: https://freestatistics.org/blog/index.php?pk=2408&T=0

[TABLE]
[ROW][C]Summary of compuational transaction[/C][/ROW]
[ROW][C]Raw Input[/C][C]view raw input (R code) [/C][/ROW]
[ROW][C]Raw Output[/C][C]view raw output of R engine [/C][/ROW]
[ROW][C]Computing time[/C][C]1 seconds[/C][/ROW]
[ROW][C]R Server[/C][C]'Gwilym Jenkins' @ 72.249.127.135[/C][/ROW]
[/TABLE]
Source: https://freestatistics.org/blog/index.php?pk=2408&T=0

Globally Unique Identifier (entire table): ba.freestatistics.org/blog/index.php?pk=2408&T=0

As an alternative you can also use a QR Code:  

The GUIDs for individual cells are displayed in the table below:

Summary of compuational transaction
Raw Inputview raw input (R code)
Raw Outputview raw output of R engine
Computing time1 seconds
R Server'Gwilym Jenkins' @ 72.249.127.135


Cross Correlation Function
ParameterValue
Box-Cox transformation parameter (lambda) of X series1
Degree of non-seasonal differencing (d) of X series0
Degree of seasonal differencing (D) of X series1
Seasonal Period (s)12
Box-Cox transformation parameter (lambda) of Y series1
Degree of non-seasonal differencing (d) of Y series0
Degree of seasonal differencing (D) of Y series1
krho(Y[t],X[t+k])
-130.0417993665985482
-120.217417478161660
-11-0.113237021656213
-100.146343015668984
-90.00293676921982034
-8-0.065564286141792
-70.19630756722629
-60.107636912946185
-50.0103917948950055
-40.171135745711288
-30.080804242854339
-2-0.0781725679823032
-10.191442113984370
00.0318621375797071
10.052610769146903
20.224260111332286
3-0.0310073381951552
4-0.0631395634644694
50.0974422499761647
6-0.0753335292149743
70.0849382010355473
80.151002037396337
9-0.0118238590375328
10-0.015236433039932
110.0984541373498344
120.0118807584795173
130.0948540095153652

\begin{tabular}{lllllllll}
\hline
Cross Correlation Function \tabularnewline
Parameter & Value \tabularnewline
Box-Cox transformation parameter (lambda) of X series & 1 \tabularnewline
Degree of non-seasonal differencing (d) of X series & 0 \tabularnewline
Degree of seasonal differencing (D) of X series & 1 \tabularnewline
Seasonal Period (s) & 12 \tabularnewline
Box-Cox transformation parameter (lambda) of Y series & 1 \tabularnewline
Degree of non-seasonal differencing (d) of Y series & 0 \tabularnewline
Degree of seasonal differencing (D) of Y series & 1 \tabularnewline
k & rho(Y[t],X[t+k]) \tabularnewline
-13 & 0.0417993665985482 \tabularnewline
-12 & 0.217417478161660 \tabularnewline
-11 & -0.113237021656213 \tabularnewline
-10 & 0.146343015668984 \tabularnewline
-9 & 0.00293676921982034 \tabularnewline
-8 & -0.065564286141792 \tabularnewline
-7 & 0.19630756722629 \tabularnewline
-6 & 0.107636912946185 \tabularnewline
-5 & 0.0103917948950055 \tabularnewline
-4 & 0.171135745711288 \tabularnewline
-3 & 0.080804242854339 \tabularnewline
-2 & -0.0781725679823032 \tabularnewline
-1 & 0.191442113984370 \tabularnewline
0 & 0.0318621375797071 \tabularnewline
1 & 0.052610769146903 \tabularnewline
2 & 0.224260111332286 \tabularnewline
3 & -0.0310073381951552 \tabularnewline
4 & -0.0631395634644694 \tabularnewline
5 & 0.0974422499761647 \tabularnewline
6 & -0.0753335292149743 \tabularnewline
7 & 0.0849382010355473 \tabularnewline
8 & 0.151002037396337 \tabularnewline
9 & -0.0118238590375328 \tabularnewline
10 & -0.015236433039932 \tabularnewline
11 & 0.0984541373498344 \tabularnewline
12 & 0.0118807584795173 \tabularnewline
13 & 0.0948540095153652 \tabularnewline
\hline
\end{tabular}
%Source: https://freestatistics.org/blog/index.php?pk=2408&T=1

[TABLE]
[ROW][C]Cross Correlation Function[/C][/ROW]
[ROW][C]Parameter[/C][C]Value[/C][/ROW]
[ROW][C]Box-Cox transformation parameter (lambda) of X series[/C][C]1[/C][/ROW]
[ROW][C]Degree of non-seasonal differencing (d) of X series[/C][C]0[/C][/ROW]
[ROW][C]Degree of seasonal differencing (D) of X series[/C][C]1[/C][/ROW]
[ROW][C]Seasonal Period (s)[/C][C]12[/C][/ROW]
[ROW][C]Box-Cox transformation parameter (lambda) of Y series[/C][C]1[/C][/ROW]
[ROW][C]Degree of non-seasonal differencing (d) of Y series[/C][C]0[/C][/ROW]
[ROW][C]Degree of seasonal differencing (D) of Y series[/C][C]1[/C][/ROW]
[ROW][C]k[/C][C]rho(Y[t],X[t+k])[/C][/ROW]
[ROW][C]-13[/C][C]0.0417993665985482[/C][/ROW]
[ROW][C]-12[/C][C]0.217417478161660[/C][/ROW]
[ROW][C]-11[/C][C]-0.113237021656213[/C][/ROW]
[ROW][C]-10[/C][C]0.146343015668984[/C][/ROW]
[ROW][C]-9[/C][C]0.00293676921982034[/C][/ROW]
[ROW][C]-8[/C][C]-0.065564286141792[/C][/ROW]
[ROW][C]-7[/C][C]0.19630756722629[/C][/ROW]
[ROW][C]-6[/C][C]0.107636912946185[/C][/ROW]
[ROW][C]-5[/C][C]0.0103917948950055[/C][/ROW]
[ROW][C]-4[/C][C]0.171135745711288[/C][/ROW]
[ROW][C]-3[/C][C]0.080804242854339[/C][/ROW]
[ROW][C]-2[/C][C]-0.0781725679823032[/C][/ROW]
[ROW][C]-1[/C][C]0.191442113984370[/C][/ROW]
[ROW][C]0[/C][C]0.0318621375797071[/C][/ROW]
[ROW][C]1[/C][C]0.052610769146903[/C][/ROW]
[ROW][C]2[/C][C]0.224260111332286[/C][/ROW]
[ROW][C]3[/C][C]-0.0310073381951552[/C][/ROW]
[ROW][C]4[/C][C]-0.0631395634644694[/C][/ROW]
[ROW][C]5[/C][C]0.0974422499761647[/C][/ROW]
[ROW][C]6[/C][C]-0.0753335292149743[/C][/ROW]
[ROW][C]7[/C][C]0.0849382010355473[/C][/ROW]
[ROW][C]8[/C][C]0.151002037396337[/C][/ROW]
[ROW][C]9[/C][C]-0.0118238590375328[/C][/ROW]
[ROW][C]10[/C][C]-0.015236433039932[/C][/ROW]
[ROW][C]11[/C][C]0.0984541373498344[/C][/ROW]
[ROW][C]12[/C][C]0.0118807584795173[/C][/ROW]
[ROW][C]13[/C][C]0.0948540095153652[/C][/ROW]
[/TABLE]
Source: https://freestatistics.org/blog/index.php?pk=2408&T=1

Globally Unique Identifier (entire table): ba.freestatistics.org/blog/index.php?pk=2408&T=1

As an alternative you can also use a QR Code:  

The GUIDs for individual cells are displayed in the table below:

Cross Correlation Function
ParameterValue
Box-Cox transformation parameter (lambda) of X series1
Degree of non-seasonal differencing (d) of X series0
Degree of seasonal differencing (D) of X series1
Seasonal Period (s)12
Box-Cox transformation parameter (lambda) of Y series1
Degree of non-seasonal differencing (d) of Y series0
Degree of seasonal differencing (D) of Y series1
krho(Y[t],X[t+k])
-130.0417993665985482
-120.217417478161660
-11-0.113237021656213
-100.146343015668984
-90.00293676921982034
-8-0.065564286141792
-70.19630756722629
-60.107636912946185
-50.0103917948950055
-40.171135745711288
-30.080804242854339
-2-0.0781725679823032
-10.191442113984370
00.0318621375797071
10.052610769146903
20.224260111332286
3-0.0310073381951552
4-0.0631395634644694
50.0974422499761647
6-0.0753335292149743
70.0849382010355473
80.151002037396337
9-0.0118238590375328
10-0.015236433039932
110.0984541373498344
120.0118807584795173
130.0948540095153652


Parameters (Session):
par1 = 1 ; par2 = 0 ; par3 = 1 ; par4 = 12 ; par5 = 1 ; par6 = 0 ; par7 = 1 ;
Parameters (R input):
par1 = 1 ; par2 = 0 ; par3 = 1 ; par4 = 12 ; par5 = 1 ; par6 = 0 ; par7 = 1 ;
R code (references can be found in the software module):
par1 <- as.numeric(par1)
par2 <- as.numeric(par2)
par3 <- as.numeric(par3)
par4 <- as.numeric(par4)
par5 <- as.numeric(par5)
par6 <- as.numeric(par6)
par7 <- as.numeric(par7)
if (par1 == 0) {
x <- log(x)
} else {
x <- (x ^ par1 - 1) / par1
}
if (par5 == 0) {
y <- log(y)
} else {
y <- (y ^ par5 - 1) / par5
}
if (par2 > 0) x <- diff(x,lag=1,difference=par2)
if (par6 > 0) y <- diff(y,lag=1,difference=par6)
if (par3 > 0) x <- diff(x,lag=par4,difference=par3)
if (par7 > 0) x <- diff(y,lag=par4,difference=par7)
x
y
bitmap(file='test1.png')
(r <- ccf(x,y,main='Cross Correlation Function',ylab='CCF',xlab='Lag (k)'))
dev.off()
load(file='createtable')
a<-table.start()
a<-table.row.start(a)
a<-table.element(a,'Cross Correlation Function',2,TRUE)
a<-table.row.end(a)
a<-table.row.start(a)
a<-table.element(a,'Parameter',header=TRUE)
a<-table.element(a,'Value',header=TRUE)
a<-table.row.end(a)
a<-table.row.start(a)
a<-table.element(a,'Box-Cox transformation parameter (lambda) of X series',header=TRUE)
a<-table.element(a,par1)
a<-table.row.end(a)
a<-table.row.start(a)
a<-table.element(a,'Degree of non-seasonal differencing (d) of X series',header=TRUE)
a<-table.element(a,par2)
a<-table.row.end(a)
a<-table.row.start(a)
a<-table.element(a,'Degree of seasonal differencing (D) of X series',header=TRUE)
a<-table.element(a,par3)
a<-table.row.end(a)
a<-table.row.start(a)
a<-table.element(a,'Seasonal Period (s)',header=TRUE)
a<-table.element(a,par4)
a<-table.row.end(a)
a<-table.row.start(a)
a<-table.element(a,'Box-Cox transformation parameter (lambda) of Y series',header=TRUE)
a<-table.element(a,par5)
a<-table.row.end(a)
a<-table.row.start(a)
a<-table.element(a,'Degree of non-seasonal differencing (d) of Y series',header=TRUE)
a<-table.element(a,par6)
a<-table.row.end(a)
a<-table.row.start(a)
a<-table.element(a,'Degree of seasonal differencing (D) of Y series',header=TRUE)
a<-table.element(a,par7)
a<-table.row.end(a)
a<-table.row.start(a)
a<-table.element(a,'k',header=TRUE)
a<-table.element(a,'rho(Y[t],X[t+k])',header=TRUE)
a<-table.row.end(a)
mylength <- length(r$acf)
myhalf <- floor((mylength-1)/2)
for (i in 1:mylength) {
a<-table.row.start(a)
a<-table.element(a,i-myhalf-1,header=TRUE)
a<-table.element(a,r$acf[i])
a<-table.row.end(a)
}
a<-table.end(a)
table.save(a,file='mytable.tab')