Free Statistics

of Irreproducible Research!

Author's title

Author*Unverified author*
R Software Modulerwasp_arimabackwardselection.wasp
Title produced by softwareARIMA Backward Selection
Date of computationMon, 03 Dec 2007 10:03:58 -0700
Cite this page as followsStatistical Computations at FreeStatistics.org, Office for Research Development and Education, URL https://freestatistics.org/blog/index.php?v=date/2007/Dec/03/t119670142674p24k9x1zn635z.htm/, Retrieved Sat, 04 May 2024 02:14:29 +0000
Statistical Computations at FreeStatistics.org, Office for Research Development and Education, URL https://freestatistics.org/blog/index.php?pk=2347, Retrieved Sat, 04 May 2024 02:14:29 +0000
QR Codes:

Original text written by user:
IsPrivate?No (this computation is public)
User-defined keywords
Estimated Impact185
Family? (F = Feedback message, R = changed R code, M = changed R Module, P = changed Parameters, D = changed Data)
-       [ARIMA Backward Selection] [q1-oef9] [2007-12-03 17:03:58] [6bdd947de0ee04552c8f0fc807f31807] [Current]
Feedback Forum

Post a new message
Dataseries X:
9884.9
10174.5
11395.4
10760.2
10570.1
10536
9902.6
8889
10837.3
11624.1
10509
10984.9
10649.1
10855.7
11677.4
10760.2
10046.2
10772.8
9987.7
8638.7
11063.7
11855.7
10684.5
11337.4
10478
11123.9
12909.3
11339.9
10462.2
12733.5
10519.2
10414.9
12476.8
12384.6
12266.7
12919.9
11497.3
12142
13919.4
12656.8
12034.1
13199.7
10881.3
11301.2
13643.9
12517
13981.1
14275.7
13435
13565.7
16216.3
12970
14079.9
14235
12213.4
12581
14130.4
14210.8
14378.5
13142.8
13714.7
13621.9
15379.8
14441.8
15354.8
15537.8
14552.7


Summary of compuational transaction
Raw Inputview raw input (R code)
Raw Outputview raw output of R engine
Computing time5 seconds
R Server'Herman Ole Andreas Wold' @ 193.190.124.10:1001

\begin{tabular}{lllllllll}
\hline
Summary of compuational transaction \tabularnewline
Raw Input & view raw input (R code)  \tabularnewline
Raw Output & view raw output of R engine  \tabularnewline
Computing time & 5 seconds \tabularnewline
R Server & 'Herman Ole Andreas Wold' @ 193.190.124.10:1001 \tabularnewline
\hline
\end{tabular}
%Source: https://freestatistics.org/blog/index.php?pk=2347&T=0

[TABLE]
[ROW][C]Summary of compuational transaction[/C][/ROW]
[ROW][C]Raw Input[/C][C]view raw input (R code) [/C][/ROW]
[ROW][C]Raw Output[/C][C]view raw output of R engine [/C][/ROW]
[ROW][C]Computing time[/C][C]5 seconds[/C][/ROW]
[ROW][C]R Server[/C][C]'Herman Ole Andreas Wold' @ 193.190.124.10:1001[/C][/ROW]
[/TABLE]
Source: https://freestatistics.org/blog/index.php?pk=2347&T=0

Globally Unique Identifier (entire table): ba.freestatistics.org/blog/index.php?pk=2347&T=0

As an alternative you can also use a QR Code:  

The GUIDs for individual cells are displayed in the table below:

Summary of compuational transaction
Raw Inputview raw input (R code)
Raw Outputview raw output of R engine
Computing time5 seconds
R Server'Herman Ole Andreas Wold' @ 193.190.124.10:1001


ARIMA Parameter Estimation and Backward Selection
Iterationar1ar2ar3ma1
Estimates ( 1 )0.04370.38690.45310.2065
(p-val)(0.8478 )(0.0066 )(0.0021 )(0.3763 )
Estimates ( 2 )00.40450.47110.244
(p-val)(NA )(2e-04 )(0 )(0.0518 )
Estimates ( 3 )00.41290.46910
(p-val)(NA )(5e-04 )(1e-04 )(NA )

\begin{tabular}{lllllllll}
\hline
ARIMA Parameter Estimation and Backward Selection \tabularnewline
Iteration & ar1 & ar2 & ar3 & ma1 \tabularnewline
Estimates ( 1 ) & 0.0437 & 0.3869 & 0.4531 & 0.2065 \tabularnewline
(p-val) & (0.8478 ) & (0.0066 ) & (0.0021 ) & (0.3763 ) \tabularnewline
Estimates ( 2 ) & 0 & 0.4045 & 0.4711 & 0.244 \tabularnewline
(p-val) & (NA ) & (2e-04 ) & (0 ) & (0.0518 ) \tabularnewline
Estimates ( 3 ) & 0 & 0.4129 & 0.4691 & 0 \tabularnewline
(p-val) & (NA ) & (5e-04 ) & (1e-04 ) & (NA ) \tabularnewline
\hline
\end{tabular}
%Source: https://freestatistics.org/blog/index.php?pk=2347&T=1

[TABLE]
[ROW][C]ARIMA Parameter Estimation and Backward Selection[/C][/ROW]
[ROW][C]Iteration[/C][C]ar1[/C][C]ar2[/C][C]ar3[/C][C]ma1[/C][/ROW]
[ROW][C]Estimates ( 1 )[/C][C]0.0437[/C][C]0.3869[/C][C]0.4531[/C][C]0.2065[/C][/ROW]
[ROW][C](p-val)[/C][C](0.8478 )[/C][C](0.0066 )[/C][C](0.0021 )[/C][C](0.3763 )[/C][/ROW]
[ROW][C]Estimates ( 2 )[/C][C]0[/C][C]0.4045[/C][C]0.4711[/C][C]0.244[/C][/ROW]
[ROW][C](p-val)[/C][C](NA )[/C][C](2e-04 )[/C][C](0 )[/C][C](0.0518 )[/C][/ROW]
[ROW][C]Estimates ( 3 )[/C][C]0[/C][C]0.4129[/C][C]0.4691[/C][C]0[/C][/ROW]
[ROW][C](p-val)[/C][C](NA )[/C][C](5e-04 )[/C][C](1e-04 )[/C][C](NA )[/C][/ROW]
[/TABLE]
Source: https://freestatistics.org/blog/index.php?pk=2347&T=1

Globally Unique Identifier (entire table): ba.freestatistics.org/blog/index.php?pk=2347&T=1

As an alternative you can also use a QR Code:  

The GUIDs for individual cells are displayed in the table below:

ARIMA Parameter Estimation and Backward Selection
Iterationar1ar2ar3ma1
Estimates ( 1 )0.04370.38690.45310.2065
(p-val)(0.8478 )(0.0066 )(0.0021 )(0.3763 )
Estimates ( 2 )00.40450.47110.244
(p-val)(NA )(2e-04 )(0 )(0.0518 )
Estimates ( 3 )00.41290.46910
(p-val)(NA )(5e-04 )(1e-04 )(NA )


Estimated ARIMA Residuals
Value
10.9846622141056
432.907328441546
107.043170430094
-310.718340613830
-563.066680162026
-821.88221024375
304.409150311039
222.739102478217
-153.617567620326
117.903300209547
263.985770460607
137.436428442010
118.639481312424
-380.133330845621
135.687022465525
1101.94387046273
282.984862022675
-277.656619420353
1213.63229289218
-205.937519696414
837.416857980847
70.1576377968922
-457.026488841564
285.390734606293
633.253313527115
-24.3105989163414
-361.404686409927
-59.5061904717804
439.442498115066
576.516427060546
-682.949120465639
-727.451380194614
134.705463012109
768.15499178165
-584.071129605762
967.307222238165
516.449625765914
1055.90052753478
-189.924399550924
920.784714361121
-1400.11827739204
787.658453797334
-365.585953900272
446.272932939253
-211.579722277853
-488.398843808552
667.771097626739
-565.189276526768
-1909.29498007315
-213.161114599616
379.222878002443
-508.45398793519
1441.35142606928
1235.12491915561
800.229725020592
935.058799094239

\begin{tabular}{lllllllll}
\hline
Estimated ARIMA Residuals \tabularnewline
Value \tabularnewline
10.9846622141056 \tabularnewline
432.907328441546 \tabularnewline
107.043170430094 \tabularnewline
-310.718340613830 \tabularnewline
-563.066680162026 \tabularnewline
-821.88221024375 \tabularnewline
304.409150311039 \tabularnewline
222.739102478217 \tabularnewline
-153.617567620326 \tabularnewline
117.903300209547 \tabularnewline
263.985770460607 \tabularnewline
137.436428442010 \tabularnewline
118.639481312424 \tabularnewline
-380.133330845621 \tabularnewline
135.687022465525 \tabularnewline
1101.94387046273 \tabularnewline
282.984862022675 \tabularnewline
-277.656619420353 \tabularnewline
1213.63229289218 \tabularnewline
-205.937519696414 \tabularnewline
837.416857980847 \tabularnewline
70.1576377968922 \tabularnewline
-457.026488841564 \tabularnewline
285.390734606293 \tabularnewline
633.253313527115 \tabularnewline
-24.3105989163414 \tabularnewline
-361.404686409927 \tabularnewline
-59.5061904717804 \tabularnewline
439.442498115066 \tabularnewline
576.516427060546 \tabularnewline
-682.949120465639 \tabularnewline
-727.451380194614 \tabularnewline
134.705463012109 \tabularnewline
768.15499178165 \tabularnewline
-584.071129605762 \tabularnewline
967.307222238165 \tabularnewline
516.449625765914 \tabularnewline
1055.90052753478 \tabularnewline
-189.924399550924 \tabularnewline
920.784714361121 \tabularnewline
-1400.11827739204 \tabularnewline
787.658453797334 \tabularnewline
-365.585953900272 \tabularnewline
446.272932939253 \tabularnewline
-211.579722277853 \tabularnewline
-488.398843808552 \tabularnewline
667.771097626739 \tabularnewline
-565.189276526768 \tabularnewline
-1909.29498007315 \tabularnewline
-213.161114599616 \tabularnewline
379.222878002443 \tabularnewline
-508.45398793519 \tabularnewline
1441.35142606928 \tabularnewline
1235.12491915561 \tabularnewline
800.229725020592 \tabularnewline
935.058799094239 \tabularnewline
\hline
\end{tabular}
%Source: https://freestatistics.org/blog/index.php?pk=2347&T=2

[TABLE]
[ROW][C]Estimated ARIMA Residuals[/C][/ROW]
[ROW][C]Value[/C][/ROW]
[ROW][C]10.9846622141056[/C][/ROW]
[ROW][C]432.907328441546[/C][/ROW]
[ROW][C]107.043170430094[/C][/ROW]
[ROW][C]-310.718340613830[/C][/ROW]
[ROW][C]-563.066680162026[/C][/ROW]
[ROW][C]-821.88221024375[/C][/ROW]
[ROW][C]304.409150311039[/C][/ROW]
[ROW][C]222.739102478217[/C][/ROW]
[ROW][C]-153.617567620326[/C][/ROW]
[ROW][C]117.903300209547[/C][/ROW]
[ROW][C]263.985770460607[/C][/ROW]
[ROW][C]137.436428442010[/C][/ROW]
[ROW][C]118.639481312424[/C][/ROW]
[ROW][C]-380.133330845621[/C][/ROW]
[ROW][C]135.687022465525[/C][/ROW]
[ROW][C]1101.94387046273[/C][/ROW]
[ROW][C]282.984862022675[/C][/ROW]
[ROW][C]-277.656619420353[/C][/ROW]
[ROW][C]1213.63229289218[/C][/ROW]
[ROW][C]-205.937519696414[/C][/ROW]
[ROW][C]837.416857980847[/C][/ROW]
[ROW][C]70.1576377968922[/C][/ROW]
[ROW][C]-457.026488841564[/C][/ROW]
[ROW][C]285.390734606293[/C][/ROW]
[ROW][C]633.253313527115[/C][/ROW]
[ROW][C]-24.3105989163414[/C][/ROW]
[ROW][C]-361.404686409927[/C][/ROW]
[ROW][C]-59.5061904717804[/C][/ROW]
[ROW][C]439.442498115066[/C][/ROW]
[ROW][C]576.516427060546[/C][/ROW]
[ROW][C]-682.949120465639[/C][/ROW]
[ROW][C]-727.451380194614[/C][/ROW]
[ROW][C]134.705463012109[/C][/ROW]
[ROW][C]768.15499178165[/C][/ROW]
[ROW][C]-584.071129605762[/C][/ROW]
[ROW][C]967.307222238165[/C][/ROW]
[ROW][C]516.449625765914[/C][/ROW]
[ROW][C]1055.90052753478[/C][/ROW]
[ROW][C]-189.924399550924[/C][/ROW]
[ROW][C]920.784714361121[/C][/ROW]
[ROW][C]-1400.11827739204[/C][/ROW]
[ROW][C]787.658453797334[/C][/ROW]
[ROW][C]-365.585953900272[/C][/ROW]
[ROW][C]446.272932939253[/C][/ROW]
[ROW][C]-211.579722277853[/C][/ROW]
[ROW][C]-488.398843808552[/C][/ROW]
[ROW][C]667.771097626739[/C][/ROW]
[ROW][C]-565.189276526768[/C][/ROW]
[ROW][C]-1909.29498007315[/C][/ROW]
[ROW][C]-213.161114599616[/C][/ROW]
[ROW][C]379.222878002443[/C][/ROW]
[ROW][C]-508.45398793519[/C][/ROW]
[ROW][C]1441.35142606928[/C][/ROW]
[ROW][C]1235.12491915561[/C][/ROW]
[ROW][C]800.229725020592[/C][/ROW]
[ROW][C]935.058799094239[/C][/ROW]
[/TABLE]
Source: https://freestatistics.org/blog/index.php?pk=2347&T=2

Globally Unique Identifier (entire table): ba.freestatistics.org/blog/index.php?pk=2347&T=2

As an alternative you can also use a QR Code:  

The GUIDs for individual cells are displayed in the table below:

Estimated ARIMA Residuals
Value
10.9846622141056
432.907328441546
107.043170430094
-310.718340613830
-563.066680162026
-821.88221024375
304.409150311039
222.739102478217
-153.617567620326
117.903300209547
263.985770460607
137.436428442010
118.639481312424
-380.133330845621
135.687022465525
1101.94387046273
282.984862022675
-277.656619420353
1213.63229289218
-205.937519696414
837.416857980847
70.1576377968922
-457.026488841564
285.390734606293
633.253313527115
-24.3105989163414
-361.404686409927
-59.5061904717804
439.442498115066
576.516427060546
-682.949120465639
-727.451380194614
134.705463012109
768.15499178165
-584.071129605762
967.307222238165
516.449625765914
1055.90052753478
-189.924399550924
920.784714361121
-1400.11827739204
787.658453797334
-365.585953900272
446.272932939253
-211.579722277853
-488.398843808552
667.771097626739
-565.189276526768
-1909.29498007315
-213.161114599616
379.222878002443
-508.45398793519
1441.35142606928
1235.12491915561
800.229725020592
935.058799094239


Parameters (Session):
par1 = Default ; par2 = 1 ; par3 = 0 ; par4 = 1 ; par5 = 12 ;
Parameters (R input):
par1 = FALSE ; par2 = 1 ; par3 = 0 ; par4 = 1 ; par5 = 12 ; par6 = 3 ; par7 = 1 ; par8 = 0 ; par9 = 0 ;
R code (references can be found in the software module):
library(lattice)
if (par1 == 'TRUE') par1 <- TRUE
if (par1 == 'FALSE') par1 <- FALSE
par2 <- as.numeric(par2) #Box-Cox lambda transformation parameter
par3 <- as.numeric(par3) #degree of non-seasonal differencing
par4 <- as.numeric(par4) #degree of seasonal differencing
par5 <- as.numeric(par5) #seasonal period
par6 <- as.numeric(par6) #degree (p) of the non-seasonal AR(p) polynomial
par7 <- as.numeric(par7) #degree (q) of the non-seasonal MA(q) polynomial
par8 <- as.numeric(par8) #degree (P) of the seasonal AR(P) polynomial
par9 <- as.numeric(par9) #degree (Q) of the seasonal MA(Q) polynomial
armaGR <- function(arima.out, names, n){
try1 <- arima.out$coef
try2 <- sqrt(diag(arima.out$var.coef))
try.data.frame <- data.frame(matrix(NA,ncol=4,nrow=length(names)))
dimnames(try.data.frame) <- list(names,c('coef','std','tstat','pv'))
try.data.frame[,1] <- try1
for(i in 1:length(try2)) try.data.frame[which(rownames(try.data.frame)==names(try2)[i]),2] <- try2[i]
try.data.frame[,3] <- try.data.frame[,1] / try.data.frame[,2]
try.data.frame[,4] <- round((1-pt(abs(try.data.frame[,3]),df=n-(length(try2)+1)))*2,5)
vector <- rep(NA,length(names))
vector[is.na(try.data.frame[,4])] <- 0
maxi <- which.max(try.data.frame[,4])
continue <- max(try.data.frame[,4],na.rm=TRUE) > .05
vector[maxi] <- 0
list(summary=try.data.frame,next.vector=vector,continue=continue)
}
arimaSelect <- function(series, order=c(13,0,0), seasonal=list(order=c(2,0,0),period=12), include.mean=F){
nrc <- order[1]+order[3]+seasonal$order[1]+seasonal$order[3]
coeff <- matrix(NA, nrow=nrc, ncol=nrc)
pval <- matrix(NA, nrow=nrc, ncol=nrc)
mylist <- rep(list(NULL), nrc)
names <- NULL
if(order[1] > 0) names <- paste('ar',1:order[1],sep='')
if(order[3] > 0) names <- c( names , paste('ma',1:order[3],sep='') )
if(seasonal$order[1] > 0) names <- c(names, paste('sar',1:seasonal$order[1],sep=''))
if(seasonal$order[3] > 0) names <- c(names, paste('sma',1:seasonal$order[3],sep=''))
arima.out <- arima(series, order=order, seasonal=seasonal, include.mean=include.mean, method='ML')
mylist[[1]] <- arima.out
last.arma <- armaGR(arima.out, names, length(series))
mystop <- FALSE
i <- 1
coeff[i,] <- last.arma[[1]][,1]
pval [i,] <- last.arma[[1]][,4]
i <- 2
aic <- arima.out$aic
while(!mystop){
mylist[[i]] <- arima.out
arima.out <- arima(series, order=order, seasonal=seasonal, include.mean=include.mean, method='ML', fixed=last.arma$next.vector)
aic <- c(aic, arima.out$aic)
last.arma <- armaGR(arima.out, names, length(series))
mystop <- !last.arma$continue
coeff[i,] <- last.arma[[1]][,1]
pval [i,] <- last.arma[[1]][,4]
i <- i+1
}
list(coeff, pval, mylist, aic=aic)
}
arimaSelectplot <- function(arimaSelect.out,noms,choix){
noms <- names(arimaSelect.out[[3]][[1]]$coef)
coeff <- arimaSelect.out[[1]]
k <- min(which(is.na(coeff[,1])))-1
coeff <- coeff[1:k,]
pval <- arimaSelect.out[[2]][1:k,]
aic <- arimaSelect.out$aic[1:k]
coeff[coeff==0] <- NA
n <- ncol(coeff)
if(missing(choix)) choix <- k
layout(matrix(c(1,1,1,2,
3,3,3,2,
3,3,3,4,
5,6,7,7),nr=4),
widths=c(10,35,45,15),
heights=c(30,30,15,15))
couleurs <- rainbow(75)[1:50]#(50)
ticks <- pretty(coeff)
par(mar=c(1,1,3,1))
plot(aic,k:1-.5,type='o',pch=21,bg='blue',cex=2,axes=F,lty=2,xpd=NA)
points(aic[choix],k-choix+.5,pch=21,cex=4,bg=2,xpd=NA)
title('aic',line=2)
par(mar=c(3,0,0,0))
plot(0,axes=F,xlab='',ylab='',xlim=range(ticks),ylim=c(.1,1))
rect(xleft = min(ticks) + (0:49)/50*(max(ticks)-min(ticks)),
xright = min(ticks) + (1:50)/50*(max(ticks)-min(ticks)),
ytop = rep(1,50),
ybottom= rep(0,50),col=couleurs,border=NA)
axis(1,ticks)
rect(xleft=min(ticks),xright=max(ticks),ytop=1,ybottom=0)
text(mean(coeff,na.rm=T),.5,'coefficients',cex=2,font=2)
par(mar=c(1,1,3,1))
image(1:n,1:k,t(coeff[k:1,]),axes=F,col=couleurs,zlim=range(ticks))
for(i in 1:n) for(j in 1:k) if(!is.na(coeff[j,i])) {
if(pval[j,i]<.01) symb = 'green'
else if( (pval[j,i]<.05) & (pval[j,i]>=.01)) symb = 'orange'
else if( (pval[j,i]<.1) & (pval[j,i]>=.05)) symb = 'red'
else symb = 'black'
polygon(c(i+.5 ,i+.2 ,i+.5 ,i+.5),
c(k-j+0.5,k-j+0.5,k-j+0.8,k-j+0.5),
col=symb)
if(j==choix) {
rect(xleft=i-.5,
xright=i+.5,
ybottom=k-j+1.5,
ytop=k-j+.5,
lwd=4)
text(i,
k-j+1,
round(coeff[j,i],2),
cex=1.2,
font=2)
}
else{
rect(xleft=i-.5,xright=i+.5,ybottom=k-j+1.5,ytop=k-j+.5)
text(i,k-j+1,round(coeff[j,i],2),cex=1.2,font=1)
}
}
axis(3,1:n,noms)
par(mar=c(0.5,0,0,0.5))
plot(0,axes=F,xlab='',ylab='',type='n',xlim=c(0,8),ylim=c(-.2,.8))
cols <- c('green','orange','red','black')
niv <- c('0','0.01','0.05','0.1')
for(i in 0:3){
polygon(c(1+2*i ,1+2*i ,1+2*i-.5 ,1+2*i),
c(.4 ,.7 , .4 , .4),
col=cols[i+1])
text(2*i,0.5,niv[i+1],cex=1.5)
}
text(8,.5,1,cex=1.5)
text(4,0,'p-value',cex=2)
box()
residus <- arimaSelect.out[[3]][[choix]]$res
par(mar=c(1,2,4,1))
acf(residus,main='')
title('acf',line=.5)
par(mar=c(1,2,4,1))
pacf(residus,main='')
title('pacf',line=.5)
par(mar=c(2,2,4,1))
qqnorm(residus,main='')
title('qq-norm',line=.5)
residus
}
if (par2 == 0) x <- log(x)
if (par2 != 0) x <- x^par2
(selection <- arimaSelect(x, order=c(par6,par3,par7), seasonal=list(order=c(par8,par4,par9), period=par5)))
bitmap(file='test1.png')
resid <- arimaSelectplot(selection)
dev.off()
resid
bitmap(file='test2.png')
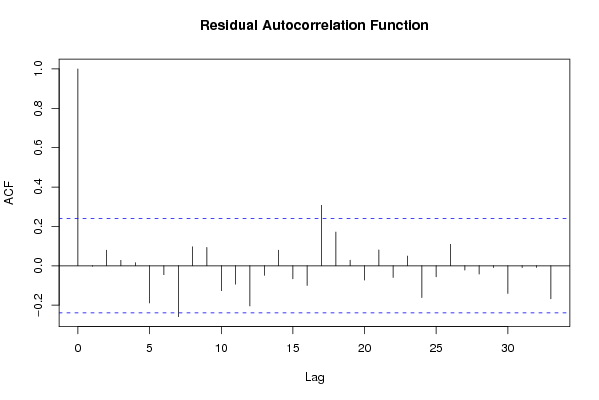
acf(resid,length(resid)/2, main='Residual Autocorrelation Function')
dev.off()
bitmap(file='test3.png')
pacf(resid,length(resid)/2, main='Residual Partial Autocorrelation Function')
dev.off()
bitmap(file='test4.png')
cpgram(resid, main='Residual Cumulative Periodogram')
dev.off()
bitmap(file='test5.png')
hist(resid, main='Residual Histogram', xlab='values of Residuals')
dev.off()
bitmap(file='test6.png')
densityplot(~resid,col='black',main='Residual Density Plot', xlab='values of Residuals')
dev.off()
bitmap(file='test7.png')
qqnorm(resid, main='Residual Normal Q-Q Plot')
dev.off()
ncols <- length(selection[[1]][1,])
nrows <- length(selection[[2]][,1])-1
load(file='createtable')
a<-table.start()
a<-table.row.start(a)
a<-table.element(a,'ARIMA Parameter Estimation and Backward Selection', ncols+1,TRUE)
a<-table.row.end(a)
a<-table.row.start(a)
a<-table.element(a,'Iteration', header=TRUE)
for (i in 1:ncols) {
a<-table.element(a,names(selection[[3]][[1]]$coef)[i],header=TRUE)
}
a<-table.row.end(a)
for (j in 1:nrows) {
a<-table.row.start(a)
mydum <- 'Estimates ('
mydum <- paste(mydum,j)
mydum <- paste(mydum,')')
a<-table.element(a,mydum, header=TRUE)
for (i in 1:ncols) {
a<-table.element(a,round(selection[[1]][j,i],4))
}
a<-table.row.end(a)
a<-table.row.start(a)
a<-table.element(a,'(p-val)', header=TRUE)
for (i in 1:ncols) {
mydum <- '('
mydum <- paste(mydum,round(selection[[2]][j,i],4),sep='')
mydum <- paste(mydum,')')
a<-table.element(a,mydum)
}
a<-table.row.end(a)
}
a<-table.end(a)
table.save(a,file='mytable.tab')
a<-table.start()
a<-table.row.start(a)
a<-table.element(a,'Estimated ARIMA Residuals', 1,TRUE)
a<-table.row.end(a)
a<-table.row.start(a)
a<-table.element(a,'Value', 1,TRUE)
a<-table.row.end(a)
for (i in (par4*par5+par3):length(resid)) {
a<-table.row.start(a)
a<-table.element(a,resid[i])
a<-table.row.end(a)
}
a<-table.end(a)
table.save(a,file='mytable1.tab')