Free Statistics

of Irreproducible Research!

Author's title

Author*Unverified author*
R Software Modulerwasp_autocorrelation.wasp
Title produced by software(Partial) Autocorrelation Function
Date of computationMon, 03 Dec 2007 09:17:08 -0700
Cite this page as followsStatistical Computations at FreeStatistics.org, Office for Research Development and Education, URL https://freestatistics.org/blog/index.php?v=date/2007/Dec/03/t11966979558ycofip81czvh9g.htm/, Retrieved Fri, 03 May 2024 16:49:33 +0000
Statistical Computations at FreeStatistics.org, Office for Research Development and Education, URL https://freestatistics.org/blog/index.php?pk=2342, Retrieved Fri, 03 May 2024 16:49:33 +0000
QR Codes:

Original text written by user:
IsPrivate?No (this computation is public)
User-defined keywords
Estimated Impact187
Family? (F = Feedback message, R = changed R code, M = changed R Module, P = changed Parameters, D = changed Data)
-       [(Partial) Autocorrelation Function] [frankrijk oef 9] [2007-12-03 16:17:08] [6bdd947de0ee04552c8f0fc807f31807] [Current]
Feedback Forum

Post a new message
Dataseries X:
2595.3
2576
2821.1
2807.3
2725.4
2617.5
2521.4
2463.2
2808.6
2993.2
2605.6
2856.4
2861.5
2809.3
3092.4
2671.3
2568.8
2656.9
2547.8
2408.4
2818.7
2871.5
2779.8
3009.6
2764
2788.5
3319.4
2998.2
2841.2
3233.5
2889.3
2910.5
3259.3
3419.9
3311.8
3644.9
3208.3
3400.6
3969.6
3657.2
3268.7
3486.7
3121.8
3544.2
3840.6
3725.7
4304.1
4887.5
4370
4343.9
5546
3953.4
4115.5
3964.8
3651
4032.1
3862.5
3993.1
3963
3962.3
3910.2
3685.9
4055.5
3868.8
4325.1
4356.4
4319.8


Summary of compuational transaction
Raw Inputview raw input (R code)
Raw Outputview raw output of R engine
Computing time2 seconds
R Server'Gwilym Jenkins' @ 72.249.127.135

\begin{tabular}{lllllllll}
\hline
Summary of compuational transaction \tabularnewline
Raw Input & view raw input (R code)  \tabularnewline
Raw Output & view raw output of R engine  \tabularnewline
Computing time & 2 seconds \tabularnewline
R Server & 'Gwilym Jenkins' @ 72.249.127.135 \tabularnewline
\hline
\end{tabular}
%Source: https://freestatistics.org/blog/index.php?pk=2342&T=0

[TABLE]
[ROW][C]Summary of compuational transaction[/C][/ROW]
[ROW][C]Raw Input[/C][C]view raw input (R code) [/C][/ROW]
[ROW][C]Raw Output[/C][C]view raw output of R engine [/C][/ROW]
[ROW][C]Computing time[/C][C]2 seconds[/C][/ROW]
[ROW][C]R Server[/C][C]'Gwilym Jenkins' @ 72.249.127.135[/C][/ROW]
[/TABLE]
Source: https://freestatistics.org/blog/index.php?pk=2342&T=0

Globally Unique Identifier (entire table): ba.freestatistics.org/blog/index.php?pk=2342&T=0

As an alternative you can also use a QR Code:  

The GUIDs for individual cells are displayed in the table below:

Summary of compuational transaction
Raw Inputview raw input (R code)
Raw Outputview raw output of R engine
Computing time2 seconds
R Server'Gwilym Jenkins' @ 72.249.127.135


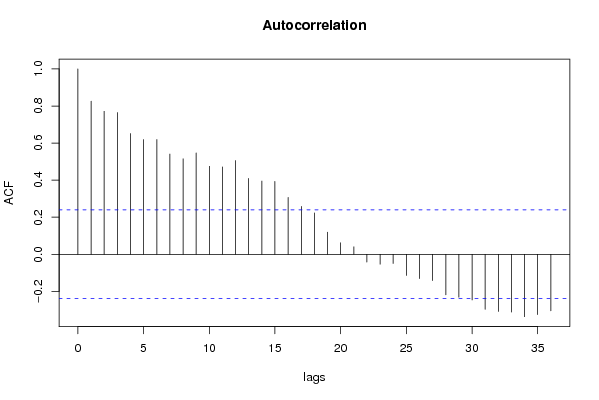
Autocorrelation Function
Time lag kACF(k)T-STATP-value
018.18540
10.8257816.75930
20.7713046.31340
30.7648496.26060
40.6511485.32991e-06
50.6191915.06832e-06
60.6190825.06742e-06
70.5411094.42921.8e-05
80.5154034.21883.8e-05
90.5468224.47591.5e-05
100.4747583.88610.000118
110.471533.85960.000129
120.5058224.14035e-05
130.4089493.34740.000671
140.3951813.23470.000946
150.3930893.21760.000996
160.3069492.51250.007201
170.2582892.11420.019112
180.2228041.82370.036327
190.1195190.97830.165721
200.0617940.50580.307326
210.0405780.33210.370408
22-0.041977-0.34360.633886
23-0.053473-0.43770.668491
24-0.04917-0.40250.655691
25-0.114025-0.93330.823002
26-0.131149-1.07350.856551
27-0.141694-1.15980.87488
28-0.218649-1.78970.960991
29-0.231531-1.89520.968807
30-0.246303-2.01610.976098
31-0.297032-2.43130.991137
32-0.308596-2.5260.993046
33-0.311497-2.54970.993462
34-0.336529-2.75460.996221
35-0.324951-2.65980.995114

\begin{tabular}{lllllllll}
\hline
Autocorrelation Function \tabularnewline
Time lag k & ACF(k) & T-STAT & P-value \tabularnewline
0 & 1 & 8.1854 & 0 \tabularnewline
1 & 0.825781 & 6.7593 & 0 \tabularnewline
2 & 0.771304 & 6.3134 & 0 \tabularnewline
3 & 0.764849 & 6.2606 & 0 \tabularnewline
4 & 0.651148 & 5.3299 & 1e-06 \tabularnewline
5 & 0.619191 & 5.0683 & 2e-06 \tabularnewline
6 & 0.619082 & 5.0674 & 2e-06 \tabularnewline
7 & 0.541109 & 4.4292 & 1.8e-05 \tabularnewline
8 & 0.515403 & 4.2188 & 3.8e-05 \tabularnewline
9 & 0.546822 & 4.4759 & 1.5e-05 \tabularnewline
10 & 0.474758 & 3.8861 & 0.000118 \tabularnewline
11 & 0.47153 & 3.8596 & 0.000129 \tabularnewline
12 & 0.505822 & 4.1403 & 5e-05 \tabularnewline
13 & 0.408949 & 3.3474 & 0.000671 \tabularnewline
14 & 0.395181 & 3.2347 & 0.000946 \tabularnewline
15 & 0.393089 & 3.2176 & 0.000996 \tabularnewline
16 & 0.306949 & 2.5125 & 0.007201 \tabularnewline
17 & 0.258289 & 2.1142 & 0.019112 \tabularnewline
18 & 0.222804 & 1.8237 & 0.036327 \tabularnewline
19 & 0.119519 & 0.9783 & 0.165721 \tabularnewline
20 & 0.061794 & 0.5058 & 0.307326 \tabularnewline
21 & 0.040578 & 0.3321 & 0.370408 \tabularnewline
22 & -0.041977 & -0.3436 & 0.633886 \tabularnewline
23 & -0.053473 & -0.4377 & 0.668491 \tabularnewline
24 & -0.04917 & -0.4025 & 0.655691 \tabularnewline
25 & -0.114025 & -0.9333 & 0.823002 \tabularnewline
26 & -0.131149 & -1.0735 & 0.856551 \tabularnewline
27 & -0.141694 & -1.1598 & 0.87488 \tabularnewline
28 & -0.218649 & -1.7897 & 0.960991 \tabularnewline
29 & -0.231531 & -1.8952 & 0.968807 \tabularnewline
30 & -0.246303 & -2.0161 & 0.976098 \tabularnewline
31 & -0.297032 & -2.4313 & 0.991137 \tabularnewline
32 & -0.308596 & -2.526 & 0.993046 \tabularnewline
33 & -0.311497 & -2.5497 & 0.993462 \tabularnewline
34 & -0.336529 & -2.7546 & 0.996221 \tabularnewline
35 & -0.324951 & -2.6598 & 0.995114 \tabularnewline
\hline
\end{tabular}
%Source: https://freestatistics.org/blog/index.php?pk=2342&T=1

[TABLE]
[ROW][C]Autocorrelation Function[/C][/ROW]
[ROW][C]Time lag k[/C][C]ACF(k)[/C][C]T-STAT[/C][C]P-value[/C][/ROW]
[ROW][C]0[/C][C]1[/C][C]8.1854[/C][C]0[/C][/ROW]
[ROW][C]1[/C][C]0.825781[/C][C]6.7593[/C][C]0[/C][/ROW]
[ROW][C]2[/C][C]0.771304[/C][C]6.3134[/C][C]0[/C][/ROW]
[ROW][C]3[/C][C]0.764849[/C][C]6.2606[/C][C]0[/C][/ROW]
[ROW][C]4[/C][C]0.651148[/C][C]5.3299[/C][C]1e-06[/C][/ROW]
[ROW][C]5[/C][C]0.619191[/C][C]5.0683[/C][C]2e-06[/C][/ROW]
[ROW][C]6[/C][C]0.619082[/C][C]5.0674[/C][C]2e-06[/C][/ROW]
[ROW][C]7[/C][C]0.541109[/C][C]4.4292[/C][C]1.8e-05[/C][/ROW]
[ROW][C]8[/C][C]0.515403[/C][C]4.2188[/C][C]3.8e-05[/C][/ROW]
[ROW][C]9[/C][C]0.546822[/C][C]4.4759[/C][C]1.5e-05[/C][/ROW]
[ROW][C]10[/C][C]0.474758[/C][C]3.8861[/C][C]0.000118[/C][/ROW]
[ROW][C]11[/C][C]0.47153[/C][C]3.8596[/C][C]0.000129[/C][/ROW]
[ROW][C]12[/C][C]0.505822[/C][C]4.1403[/C][C]5e-05[/C][/ROW]
[ROW][C]13[/C][C]0.408949[/C][C]3.3474[/C][C]0.000671[/C][/ROW]
[ROW][C]14[/C][C]0.395181[/C][C]3.2347[/C][C]0.000946[/C][/ROW]
[ROW][C]15[/C][C]0.393089[/C][C]3.2176[/C][C]0.000996[/C][/ROW]
[ROW][C]16[/C][C]0.306949[/C][C]2.5125[/C][C]0.007201[/C][/ROW]
[ROW][C]17[/C][C]0.258289[/C][C]2.1142[/C][C]0.019112[/C][/ROW]
[ROW][C]18[/C][C]0.222804[/C][C]1.8237[/C][C]0.036327[/C][/ROW]
[ROW][C]19[/C][C]0.119519[/C][C]0.9783[/C][C]0.165721[/C][/ROW]
[ROW][C]20[/C][C]0.061794[/C][C]0.5058[/C][C]0.307326[/C][/ROW]
[ROW][C]21[/C][C]0.040578[/C][C]0.3321[/C][C]0.370408[/C][/ROW]
[ROW][C]22[/C][C]-0.041977[/C][C]-0.3436[/C][C]0.633886[/C][/ROW]
[ROW][C]23[/C][C]-0.053473[/C][C]-0.4377[/C][C]0.668491[/C][/ROW]
[ROW][C]24[/C][C]-0.04917[/C][C]-0.4025[/C][C]0.655691[/C][/ROW]
[ROW][C]25[/C][C]-0.114025[/C][C]-0.9333[/C][C]0.823002[/C][/ROW]
[ROW][C]26[/C][C]-0.131149[/C][C]-1.0735[/C][C]0.856551[/C][/ROW]
[ROW][C]27[/C][C]-0.141694[/C][C]-1.1598[/C][C]0.87488[/C][/ROW]
[ROW][C]28[/C][C]-0.218649[/C][C]-1.7897[/C][C]0.960991[/C][/ROW]
[ROW][C]29[/C][C]-0.231531[/C][C]-1.8952[/C][C]0.968807[/C][/ROW]
[ROW][C]30[/C][C]-0.246303[/C][C]-2.0161[/C][C]0.976098[/C][/ROW]
[ROW][C]31[/C][C]-0.297032[/C][C]-2.4313[/C][C]0.991137[/C][/ROW]
[ROW][C]32[/C][C]-0.308596[/C][C]-2.526[/C][C]0.993046[/C][/ROW]
[ROW][C]33[/C][C]-0.311497[/C][C]-2.5497[/C][C]0.993462[/C][/ROW]
[ROW][C]34[/C][C]-0.336529[/C][C]-2.7546[/C][C]0.996221[/C][/ROW]
[ROW][C]35[/C][C]-0.324951[/C][C]-2.6598[/C][C]0.995114[/C][/ROW]
[/TABLE]
Source: https://freestatistics.org/blog/index.php?pk=2342&T=1

Globally Unique Identifier (entire table): ba.freestatistics.org/blog/index.php?pk=2342&T=1

As an alternative you can also use a QR Code:  

The GUIDs for individual cells are displayed in the table below:

Autocorrelation Function
Time lag kACF(k)T-STATP-value
018.18540
10.8257816.75930
20.7713046.31340
30.7648496.26060
40.6511485.32991e-06
50.6191915.06832e-06
60.6190825.06742e-06
70.5411094.42921.8e-05
80.5154034.21883.8e-05
90.5468224.47591.5e-05
100.4747583.88610.000118
110.471533.85960.000129
120.5058224.14035e-05
130.4089493.34740.000671
140.3951813.23470.000946
150.3930893.21760.000996
160.3069492.51250.007201
170.2582892.11420.019112
180.2228041.82370.036327
190.1195190.97830.165721
200.0617940.50580.307326
210.0405780.33210.370408
22-0.041977-0.34360.633886
23-0.053473-0.43770.668491
24-0.04917-0.40250.655691
25-0.114025-0.93330.823002
26-0.131149-1.07350.856551
27-0.141694-1.15980.87488
28-0.218649-1.78970.960991
29-0.231531-1.89520.968807
30-0.246303-2.01610.976098
31-0.297032-2.43130.991137
32-0.308596-2.5260.993046
33-0.311497-2.54970.993462
34-0.336529-2.75460.996221
35-0.324951-2.65980.995114


Partial Autocorrelation Function
Time lag kPACF(k)T-STATP-value
00.8257816.75930
10.2810232.30030.012277
20.2554862.09120.020151
3-0.214632-1.75680.958243
40.0660840.54090.295179
50.1304391.06770.144746
6-0.066183-0.54170.705099
7-0.003743-0.03060.512177
80.1910541.56380.061282
9-0.101945-0.83450.796506
100.0562090.46010.323471
110.108790.89050.188195
12-0.198461-1.62450.945515
13-0.010182-0.08330.533087
14-0.010172-0.08330.533052
15-0.065574-0.53670.703391
16-0.154667-1.2660.895053
17-0.108932-0.89160.812113
18-0.115604-0.94630.826293
19-0.109489-0.89620.813323
20-0.047118-0.38570.649521
21-0.031971-0.26170.602821
220.0291510.23860.406069
230.0114490.09370.462807
24-0.035787-0.29290.614761
25-0.067685-0.5540.709296
26-0.040128-0.32850.628207
27-0.100983-0.82660.794296
280.0506110.41430.340001
29-0.013617-0.11150.544207
300.06220.50910.306168
310.0028330.02320.490785
320.0370760.30350.381232
330.1034060.84640.200168
340.0550050.45020.326998
350.065230.53390.297577

\begin{tabular}{lllllllll}
\hline
Partial Autocorrelation Function \tabularnewline
Time lag k & PACF(k) & T-STAT & P-value \tabularnewline
0 & 0.825781 & 6.7593 & 0 \tabularnewline
1 & 0.281023 & 2.3003 & 0.012277 \tabularnewline
2 & 0.255486 & 2.0912 & 0.020151 \tabularnewline
3 & -0.214632 & -1.7568 & 0.958243 \tabularnewline
4 & 0.066084 & 0.5409 & 0.295179 \tabularnewline
5 & 0.130439 & 1.0677 & 0.144746 \tabularnewline
6 & -0.066183 & -0.5417 & 0.705099 \tabularnewline
7 & -0.003743 & -0.0306 & 0.512177 \tabularnewline
8 & 0.191054 & 1.5638 & 0.061282 \tabularnewline
9 & -0.101945 & -0.8345 & 0.796506 \tabularnewline
10 & 0.056209 & 0.4601 & 0.323471 \tabularnewline
11 & 0.10879 & 0.8905 & 0.188195 \tabularnewline
12 & -0.198461 & -1.6245 & 0.945515 \tabularnewline
13 & -0.010182 & -0.0833 & 0.533087 \tabularnewline
14 & -0.010172 & -0.0833 & 0.533052 \tabularnewline
15 & -0.065574 & -0.5367 & 0.703391 \tabularnewline
16 & -0.154667 & -1.266 & 0.895053 \tabularnewline
17 & -0.108932 & -0.8916 & 0.812113 \tabularnewline
18 & -0.115604 & -0.9463 & 0.826293 \tabularnewline
19 & -0.109489 & -0.8962 & 0.813323 \tabularnewline
20 & -0.047118 & -0.3857 & 0.649521 \tabularnewline
21 & -0.031971 & -0.2617 & 0.602821 \tabularnewline
22 & 0.029151 & 0.2386 & 0.406069 \tabularnewline
23 & 0.011449 & 0.0937 & 0.462807 \tabularnewline
24 & -0.035787 & -0.2929 & 0.614761 \tabularnewline
25 & -0.067685 & -0.554 & 0.709296 \tabularnewline
26 & -0.040128 & -0.3285 & 0.628207 \tabularnewline
27 & -0.100983 & -0.8266 & 0.794296 \tabularnewline
28 & 0.050611 & 0.4143 & 0.340001 \tabularnewline
29 & -0.013617 & -0.1115 & 0.544207 \tabularnewline
30 & 0.0622 & 0.5091 & 0.306168 \tabularnewline
31 & 0.002833 & 0.0232 & 0.490785 \tabularnewline
32 & 0.037076 & 0.3035 & 0.381232 \tabularnewline
33 & 0.103406 & 0.8464 & 0.200168 \tabularnewline
34 & 0.055005 & 0.4502 & 0.326998 \tabularnewline
35 & 0.06523 & 0.5339 & 0.297577 \tabularnewline
\hline
\end{tabular}
%Source: https://freestatistics.org/blog/index.php?pk=2342&T=2

[TABLE]
[ROW][C]Partial Autocorrelation Function[/C][/ROW]
[ROW][C]Time lag k[/C][C]PACF(k)[/C][C]T-STAT[/C][C]P-value[/C][/ROW]
[ROW][C]0[/C][C]0.825781[/C][C]6.7593[/C][C]0[/C][/ROW]
[ROW][C]1[/C][C]0.281023[/C][C]2.3003[/C][C]0.012277[/C][/ROW]
[ROW][C]2[/C][C]0.255486[/C][C]2.0912[/C][C]0.020151[/C][/ROW]
[ROW][C]3[/C][C]-0.214632[/C][C]-1.7568[/C][C]0.958243[/C][/ROW]
[ROW][C]4[/C][C]0.066084[/C][C]0.5409[/C][C]0.295179[/C][/ROW]
[ROW][C]5[/C][C]0.130439[/C][C]1.0677[/C][C]0.144746[/C][/ROW]
[ROW][C]6[/C][C]-0.066183[/C][C]-0.5417[/C][C]0.705099[/C][/ROW]
[ROW][C]7[/C][C]-0.003743[/C][C]-0.0306[/C][C]0.512177[/C][/ROW]
[ROW][C]8[/C][C]0.191054[/C][C]1.5638[/C][C]0.061282[/C][/ROW]
[ROW][C]9[/C][C]-0.101945[/C][C]-0.8345[/C][C]0.796506[/C][/ROW]
[ROW][C]10[/C][C]0.056209[/C][C]0.4601[/C][C]0.323471[/C][/ROW]
[ROW][C]11[/C][C]0.10879[/C][C]0.8905[/C][C]0.188195[/C][/ROW]
[ROW][C]12[/C][C]-0.198461[/C][C]-1.6245[/C][C]0.945515[/C][/ROW]
[ROW][C]13[/C][C]-0.010182[/C][C]-0.0833[/C][C]0.533087[/C][/ROW]
[ROW][C]14[/C][C]-0.010172[/C][C]-0.0833[/C][C]0.533052[/C][/ROW]
[ROW][C]15[/C][C]-0.065574[/C][C]-0.5367[/C][C]0.703391[/C][/ROW]
[ROW][C]16[/C][C]-0.154667[/C][C]-1.266[/C][C]0.895053[/C][/ROW]
[ROW][C]17[/C][C]-0.108932[/C][C]-0.8916[/C][C]0.812113[/C][/ROW]
[ROW][C]18[/C][C]-0.115604[/C][C]-0.9463[/C][C]0.826293[/C][/ROW]
[ROW][C]19[/C][C]-0.109489[/C][C]-0.8962[/C][C]0.813323[/C][/ROW]
[ROW][C]20[/C][C]-0.047118[/C][C]-0.3857[/C][C]0.649521[/C][/ROW]
[ROW][C]21[/C][C]-0.031971[/C][C]-0.2617[/C][C]0.602821[/C][/ROW]
[ROW][C]22[/C][C]0.029151[/C][C]0.2386[/C][C]0.406069[/C][/ROW]
[ROW][C]23[/C][C]0.011449[/C][C]0.0937[/C][C]0.462807[/C][/ROW]
[ROW][C]24[/C][C]-0.035787[/C][C]-0.2929[/C][C]0.614761[/C][/ROW]
[ROW][C]25[/C][C]-0.067685[/C][C]-0.554[/C][C]0.709296[/C][/ROW]
[ROW][C]26[/C][C]-0.040128[/C][C]-0.3285[/C][C]0.628207[/C][/ROW]
[ROW][C]27[/C][C]-0.100983[/C][C]-0.8266[/C][C]0.794296[/C][/ROW]
[ROW][C]28[/C][C]0.050611[/C][C]0.4143[/C][C]0.340001[/C][/ROW]
[ROW][C]29[/C][C]-0.013617[/C][C]-0.1115[/C][C]0.544207[/C][/ROW]
[ROW][C]30[/C][C]0.0622[/C][C]0.5091[/C][C]0.306168[/C][/ROW]
[ROW][C]31[/C][C]0.002833[/C][C]0.0232[/C][C]0.490785[/C][/ROW]
[ROW][C]32[/C][C]0.037076[/C][C]0.3035[/C][C]0.381232[/C][/ROW]
[ROW][C]33[/C][C]0.103406[/C][C]0.8464[/C][C]0.200168[/C][/ROW]
[ROW][C]34[/C][C]0.055005[/C][C]0.4502[/C][C]0.326998[/C][/ROW]
[ROW][C]35[/C][C]0.06523[/C][C]0.5339[/C][C]0.297577[/C][/ROW]
[/TABLE]
Source: https://freestatistics.org/blog/index.php?pk=2342&T=2

Globally Unique Identifier (entire table): ba.freestatistics.org/blog/index.php?pk=2342&T=2

As an alternative you can also use a QR Code:  

The GUIDs for individual cells are displayed in the table below:

Partial Autocorrelation Function
Time lag kPACF(k)T-STATP-value
00.8257816.75930
10.2810232.30030.012277
20.2554862.09120.020151
3-0.214632-1.75680.958243
40.0660840.54090.295179
50.1304391.06770.144746
6-0.066183-0.54170.705099
7-0.003743-0.03060.512177
80.1910541.56380.061282
9-0.101945-0.83450.796506
100.0562090.46010.323471
110.108790.89050.188195
12-0.198461-1.62450.945515
13-0.010182-0.08330.533087
14-0.010172-0.08330.533052
15-0.065574-0.53670.703391
16-0.154667-1.2660.895053
17-0.108932-0.89160.812113
18-0.115604-0.94630.826293
19-0.109489-0.89620.813323
20-0.047118-0.38570.649521
21-0.031971-0.26170.602821
220.0291510.23860.406069
230.0114490.09370.462807
24-0.035787-0.29290.614761
25-0.067685-0.5540.709296
26-0.040128-0.32850.628207
27-0.100983-0.82660.794296
280.0506110.41430.340001
29-0.013617-0.11150.544207
300.06220.50910.306168
310.0028330.02320.490785
320.0370760.30350.381232
330.1034060.84640.200168
340.0550050.45020.326998
350.065230.53390.297577


Parameters (Session):
par1 = 36 ; par2 = 1 ; par3 = 0 ; par4 = 0 ; par5 = 12 ;
Parameters (R input):
par1 = 36 ; par2 = 1 ; par3 = 0 ; par4 = 0 ; par5 = 12 ;
R code (references can be found in the software module):
if (par1 == 'Default') {
par1 = 10*log10(length(x))
} else {
par1 <- as.numeric(par1)
}
par2 <- as.numeric(par2)
par3 <- as.numeric(par3)
par4 <- as.numeric(par4)
par5 <- as.numeric(par5)
if (par2 == 0) {
x <- log(x)
} else {
x <- (x ^ par2 - 1) / par2
}
if (par3 > 0) x <- diff(x,lag=1,difference=par3)
if (par4 > 0) x <- diff(x,lag=par5,difference=par4)
bitmap(file='pic1.png')
racf <- acf(x,par1,main='Autocorrelation',xlab='lags',ylab='ACF')
dev.off()
bitmap(file='pic2.png')
rpacf <- pacf(x,par1,main='Partial Autocorrelation',xlab='lags',ylab='PACF')
dev.off()
(myacf <- c(racf$acf))
(mypacf <- c(rpacf$acf))
lengthx <- length(x)
sqrtn <- sqrt(lengthx)
load(file='createtable')
a<-table.start()
a<-table.row.start(a)
a<-table.element(a,'Autocorrelation Function',4,TRUE)
a<-table.row.end(a)
a<-table.row.start(a)
a<-table.element(a,'Time lag k',header=TRUE)
a<-table.element(a,hyperlink('basics.htm','ACF(k)','click here for more information about the Autocorrelation Function'),header=TRUE)
a<-table.element(a,'T-STAT',header=TRUE)
a<-table.element(a,'P-value',header=TRUE)
a<-table.row.end(a)
for (i in 1:par1) {
a<-table.row.start(a)
a<-table.element(a,i-1,header=TRUE)
a<-table.element(a,round(myacf[i],6))
mytstat <- myacf[i]*sqrtn
a<-table.element(a,round(mytstat,4))
a<-table.element(a,round(1-pt(mytstat,lengthx),6))
a<-table.row.end(a)
}
a<-table.end(a)
table.save(a,file='mytable.tab')
a<-table.start()
a<-table.row.start(a)
a<-table.element(a,'Partial Autocorrelation Function',4,TRUE)
a<-table.row.end(a)
a<-table.row.start(a)
a<-table.element(a,'Time lag k',header=TRUE)
a<-table.element(a,hyperlink('basics.htm','PACF(k)','click here for more information about the Partial Autocorrelation Function'),header=TRUE)
a<-table.element(a,'T-STAT',header=TRUE)
a<-table.element(a,'P-value',header=TRUE)
a<-table.row.end(a)
for (i in 1:par1) {
a<-table.row.start(a)
a<-table.element(a,i-1,header=TRUE)
a<-table.element(a,round(mypacf[i],6))
mytstat <- mypacf[i]*sqrtn
a<-table.element(a,round(mytstat,4))
a<-table.element(a,round(1-pt(mytstat,lengthx),6))
a<-table.row.end(a)
}
a<-table.end(a)
table.save(a,file='mytable1.tab')