Free Statistics

of Irreproducible Research!

Author's title

Author*Unverified author*
R Software Modulerwasp_autocorrelation.wasp
Title produced by software(Partial) Autocorrelation Function
Date of computationMon, 03 Dec 2007 03:43:46 -0700
Cite this page as followsStatistical Computations at FreeStatistics.org, Office for Research Development and Education, URL https://freestatistics.org/blog/index.php?v=date/2007/Dec/03/t11966779474l1gpb2ct3p8ukr.htm/, Retrieved Sat, 04 May 2024 03:32:14 +0000
Statistical Computations at FreeStatistics.org, Office for Research Development and Education, URL https://freestatistics.org/blog/index.php?pk=2309, Retrieved Sat, 04 May 2024 03:32:14 +0000
QR Codes:

Original text written by user:
IsPrivate?No (this computation is public)
User-defined keywordsQ1 Estimation of ARMA processes
Estimated Impact217
Family? (F = Feedback message, R = changed R code, M = changed R Module, P = changed Parameters, D = changed Data)
-       [(Partial) Autocorrelation Function] [Q1 Estimation of ...] [2007-12-03 10:43:46] [0cecb02636bfe8ebd97a7fef80b2b9e7] [Current]
Feedback Forum

Post a new message
Dataseries X:
112.7
118.4
108.1
105.4
114.6
106.9
115.9
109.8
101.8
114.2
110.8
108.4
127.5
128.6
116.6
127.4
105
108.3
125
111.6
106.5
130.3
115
116.1
134
126.5
125.8
136.4
114.9
110.9
125.5
116.8
116.8
125.5
104.2
115.1
132.8
123.3
124.8
122
117.4
117.9
137.4
114.6
124.7
129.6
109.4
120.9
134.9
136.3
133.2
127.2
122.7
120.5
137.8
119.1
124.3
134.3
121.7
125


Summary of compuational transaction
Raw Inputview raw input (R code)
Raw Outputview raw output of R engine
Computing time1 seconds
R Server'Gwilym Jenkins' @ 72.249.127.135

\begin{tabular}{lllllllll}
\hline
Summary of compuational transaction \tabularnewline
Raw Input & view raw input (R code)  \tabularnewline
Raw Output & view raw output of R engine  \tabularnewline
Computing time & 1 seconds \tabularnewline
R Server & 'Gwilym Jenkins' @ 72.249.127.135 \tabularnewline
\hline
\end{tabular}
%Source: https://freestatistics.org/blog/index.php?pk=2309&T=0

[TABLE]
[ROW][C]Summary of compuational transaction[/C][/ROW]
[ROW][C]Raw Input[/C][C]view raw input (R code) [/C][/ROW]
[ROW][C]Raw Output[/C][C]view raw output of R engine [/C][/ROW]
[ROW][C]Computing time[/C][C]1 seconds[/C][/ROW]
[ROW][C]R Server[/C][C]'Gwilym Jenkins' @ 72.249.127.135[/C][/ROW]
[/TABLE]
Source: https://freestatistics.org/blog/index.php?pk=2309&T=0

Globally Unique Identifier (entire table): ba.freestatistics.org/blog/index.php?pk=2309&T=0

As an alternative you can also use a QR Code:  

The GUIDs for individual cells are displayed in the table below:

Summary of compuational transaction
Raw Inputview raw input (R code)
Raw Outputview raw output of R engine
Computing time1 seconds
R Server'Gwilym Jenkins' @ 72.249.127.135


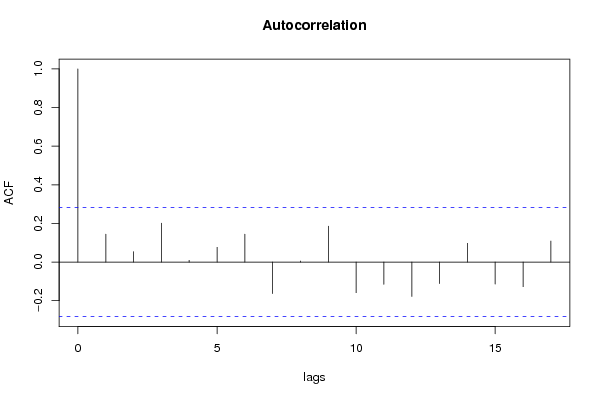
Autocorrelation Function
Time lag kACF(k)T-STATP-value
016.92820
10.1440050.99770.161714
20.053470.37050.356337
30.2013141.39470.084757
40.0090450.06270.475147
50.0765410.53030.299177
60.1440960.99830.161563
7-0.163556-1.13310.86861
80.0052030.0360.485696
90.1856071.28590.10232
10-0.158944-1.10120.861848
11-0.115718-0.80170.786666
12-0.178473-1.23650.888855
13-0.111832-0.77480.778869
140.0967860.67060.252859
15-0.114129-0.79070.783499
16-0.127459-0.88310.809197

\begin{tabular}{lllllllll}
\hline
Autocorrelation Function \tabularnewline
Time lag k & ACF(k) & T-STAT & P-value \tabularnewline
0 & 1 & 6.9282 & 0 \tabularnewline
1 & 0.144005 & 0.9977 & 0.161714 \tabularnewline
2 & 0.05347 & 0.3705 & 0.356337 \tabularnewline
3 & 0.201314 & 1.3947 & 0.084757 \tabularnewline
4 & 0.009045 & 0.0627 & 0.475147 \tabularnewline
5 & 0.076541 & 0.5303 & 0.299177 \tabularnewline
6 & 0.144096 & 0.9983 & 0.161563 \tabularnewline
7 & -0.163556 & -1.1331 & 0.86861 \tabularnewline
8 & 0.005203 & 0.036 & 0.485696 \tabularnewline
9 & 0.185607 & 1.2859 & 0.10232 \tabularnewline
10 & -0.158944 & -1.1012 & 0.861848 \tabularnewline
11 & -0.115718 & -0.8017 & 0.786666 \tabularnewline
12 & -0.178473 & -1.2365 & 0.888855 \tabularnewline
13 & -0.111832 & -0.7748 & 0.778869 \tabularnewline
14 & 0.096786 & 0.6706 & 0.252859 \tabularnewline
15 & -0.114129 & -0.7907 & 0.783499 \tabularnewline
16 & -0.127459 & -0.8831 & 0.809197 \tabularnewline
\hline
\end{tabular}
%Source: https://freestatistics.org/blog/index.php?pk=2309&T=1

[TABLE]
[ROW][C]Autocorrelation Function[/C][/ROW]
[ROW][C]Time lag k[/C][C]ACF(k)[/C][C]T-STAT[/C][C]P-value[/C][/ROW]
[ROW][C]0[/C][C]1[/C][C]6.9282[/C][C]0[/C][/ROW]
[ROW][C]1[/C][C]0.144005[/C][C]0.9977[/C][C]0.161714[/C][/ROW]
[ROW][C]2[/C][C]0.05347[/C][C]0.3705[/C][C]0.356337[/C][/ROW]
[ROW][C]3[/C][C]0.201314[/C][C]1.3947[/C][C]0.084757[/C][/ROW]
[ROW][C]4[/C][C]0.009045[/C][C]0.0627[/C][C]0.475147[/C][/ROW]
[ROW][C]5[/C][C]0.076541[/C][C]0.5303[/C][C]0.299177[/C][/ROW]
[ROW][C]6[/C][C]0.144096[/C][C]0.9983[/C][C]0.161563[/C][/ROW]
[ROW][C]7[/C][C]-0.163556[/C][C]-1.1331[/C][C]0.86861[/C][/ROW]
[ROW][C]8[/C][C]0.005203[/C][C]0.036[/C][C]0.485696[/C][/ROW]
[ROW][C]9[/C][C]0.185607[/C][C]1.2859[/C][C]0.10232[/C][/ROW]
[ROW][C]10[/C][C]-0.158944[/C][C]-1.1012[/C][C]0.861848[/C][/ROW]
[ROW][C]11[/C][C]-0.115718[/C][C]-0.8017[/C][C]0.786666[/C][/ROW]
[ROW][C]12[/C][C]-0.178473[/C][C]-1.2365[/C][C]0.888855[/C][/ROW]
[ROW][C]13[/C][C]-0.111832[/C][C]-0.7748[/C][C]0.778869[/C][/ROW]
[ROW][C]14[/C][C]0.096786[/C][C]0.6706[/C][C]0.252859[/C][/ROW]
[ROW][C]15[/C][C]-0.114129[/C][C]-0.7907[/C][C]0.783499[/C][/ROW]
[ROW][C]16[/C][C]-0.127459[/C][C]-0.8831[/C][C]0.809197[/C][/ROW]
[/TABLE]
Source: https://freestatistics.org/blog/index.php?pk=2309&T=1

Globally Unique Identifier (entire table): ba.freestatistics.org/blog/index.php?pk=2309&T=1

As an alternative you can also use a QR Code:  

The GUIDs for individual cells are displayed in the table below:

Autocorrelation Function
Time lag kACF(k)T-STATP-value
016.92820
10.1440050.99770.161714
20.053470.37050.356337
30.2013141.39470.084757
40.0090450.06270.475147
50.0765410.53030.299177
60.1440960.99830.161563
7-0.163556-1.13310.86861
80.0052030.0360.485696
90.1856071.28590.10232
10-0.158944-1.10120.861848
11-0.115718-0.80170.786666
12-0.178473-1.23650.888855
13-0.111832-0.77480.778869
140.0967860.67060.252859
15-0.114129-0.79070.783499
16-0.127459-0.88310.809197


Partial Autocorrelation Function
Time lag kPACF(k)T-STATP-value
00.1440050.99770.161714
10.0334260.23160.408923
20.1932771.33910.093428
3-0.0487-0.33740.631359
40.0747410.51780.303482
50.0913260.63270.264958
6-0.204731-1.41840.918736
70.0311420.21580.415046
80.1640371.13650.130698
9-0.170365-1.18030.878157
10-0.118721-0.82250.792576
11-0.206857-1.43310.920851
120.0619140.4290.334938
130.124140.86010.197014
14-0.140758-0.97520.832825
150.0207720.14390.443085
160.1287860.89230.188354

\begin{tabular}{lllllllll}
\hline
Partial Autocorrelation Function \tabularnewline
Time lag k & PACF(k) & T-STAT & P-value \tabularnewline
0 & 0.144005 & 0.9977 & 0.161714 \tabularnewline
1 & 0.033426 & 0.2316 & 0.408923 \tabularnewline
2 & 0.193277 & 1.3391 & 0.093428 \tabularnewline
3 & -0.0487 & -0.3374 & 0.631359 \tabularnewline
4 & 0.074741 & 0.5178 & 0.303482 \tabularnewline
5 & 0.091326 & 0.6327 & 0.264958 \tabularnewline
6 & -0.204731 & -1.4184 & 0.918736 \tabularnewline
7 & 0.031142 & 0.2158 & 0.415046 \tabularnewline
8 & 0.164037 & 1.1365 & 0.130698 \tabularnewline
9 & -0.170365 & -1.1803 & 0.878157 \tabularnewline
10 & -0.118721 & -0.8225 & 0.792576 \tabularnewline
11 & -0.206857 & -1.4331 & 0.920851 \tabularnewline
12 & 0.061914 & 0.429 & 0.334938 \tabularnewline
13 & 0.12414 & 0.8601 & 0.197014 \tabularnewline
14 & -0.140758 & -0.9752 & 0.832825 \tabularnewline
15 & 0.020772 & 0.1439 & 0.443085 \tabularnewline
16 & 0.128786 & 0.8923 & 0.188354 \tabularnewline
\hline
\end{tabular}
%Source: https://freestatistics.org/blog/index.php?pk=2309&T=2

[TABLE]
[ROW][C]Partial Autocorrelation Function[/C][/ROW]
[ROW][C]Time lag k[/C][C]PACF(k)[/C][C]T-STAT[/C][C]P-value[/C][/ROW]
[ROW][C]0[/C][C]0.144005[/C][C]0.9977[/C][C]0.161714[/C][/ROW]
[ROW][C]1[/C][C]0.033426[/C][C]0.2316[/C][C]0.408923[/C][/ROW]
[ROW][C]2[/C][C]0.193277[/C][C]1.3391[/C][C]0.093428[/C][/ROW]
[ROW][C]3[/C][C]-0.0487[/C][C]-0.3374[/C][C]0.631359[/C][/ROW]
[ROW][C]4[/C][C]0.074741[/C][C]0.5178[/C][C]0.303482[/C][/ROW]
[ROW][C]5[/C][C]0.091326[/C][C]0.6327[/C][C]0.264958[/C][/ROW]
[ROW][C]6[/C][C]-0.204731[/C][C]-1.4184[/C][C]0.918736[/C][/ROW]
[ROW][C]7[/C][C]0.031142[/C][C]0.2158[/C][C]0.415046[/C][/ROW]
[ROW][C]8[/C][C]0.164037[/C][C]1.1365[/C][C]0.130698[/C][/ROW]
[ROW][C]9[/C][C]-0.170365[/C][C]-1.1803[/C][C]0.878157[/C][/ROW]
[ROW][C]10[/C][C]-0.118721[/C][C]-0.8225[/C][C]0.792576[/C][/ROW]
[ROW][C]11[/C][C]-0.206857[/C][C]-1.4331[/C][C]0.920851[/C][/ROW]
[ROW][C]12[/C][C]0.061914[/C][C]0.429[/C][C]0.334938[/C][/ROW]
[ROW][C]13[/C][C]0.12414[/C][C]0.8601[/C][C]0.197014[/C][/ROW]
[ROW][C]14[/C][C]-0.140758[/C][C]-0.9752[/C][C]0.832825[/C][/ROW]
[ROW][C]15[/C][C]0.020772[/C][C]0.1439[/C][C]0.443085[/C][/ROW]
[ROW][C]16[/C][C]0.128786[/C][C]0.8923[/C][C]0.188354[/C][/ROW]
[/TABLE]
Source: https://freestatistics.org/blog/index.php?pk=2309&T=2

Globally Unique Identifier (entire table): ba.freestatistics.org/blog/index.php?pk=2309&T=2

As an alternative you can also use a QR Code:  

The GUIDs for individual cells are displayed in the table below:

Partial Autocorrelation Function
Time lag kPACF(k)T-STATP-value
00.1440050.99770.161714
10.0334260.23160.408923
20.1932771.33910.093428
3-0.0487-0.33740.631359
40.0747410.51780.303482
50.0913260.63270.264958
6-0.204731-1.41840.918736
70.0311420.21580.415046
80.1640371.13650.130698
9-0.170365-1.18030.878157
10-0.118721-0.82250.792576
11-0.206857-1.43310.920851
120.0619140.4290.334938
130.124140.86010.197014
14-0.140758-0.97520.832825
150.0207720.14390.443085
160.1287860.89230.188354


Parameters (Session):
par1 = Default ; par2 = 1 ; par3 = 0 ; par4 = 1 ; par5 = 12 ;
Parameters (R input):
par1 = Default ; par2 = 1 ; par3 = 0 ; par4 = 1 ; par5 = 12 ;
R code (references can be found in the software module):
if (par1 == 'Default') {
par1 = 10*log10(length(x))
} else {
par1 <- as.numeric(par1)
}
par2 <- as.numeric(par2)
par3 <- as.numeric(par3)
par4 <- as.numeric(par4)
par5 <- as.numeric(par5)
if (par2 == 0) {
x <- log(x)
} else {
x <- (x ^ par2 - 1) / par2
}
if (par3 > 0) x <- diff(x,lag=1,difference=par3)
if (par4 > 0) x <- diff(x,lag=par5,difference=par4)
bitmap(file='pic1.png')
racf <- acf(x,par1,main='Autocorrelation',xlab='lags',ylab='ACF')
dev.off()
bitmap(file='pic2.png')
rpacf <- pacf(x,par1,main='Partial Autocorrelation',xlab='lags',ylab='PACF')
dev.off()
(myacf <- c(racf$acf))
(mypacf <- c(rpacf$acf))
lengthx <- length(x)
sqrtn <- sqrt(lengthx)
load(file='createtable')
a<-table.start()
a<-table.row.start(a)
a<-table.element(a,'Autocorrelation Function',4,TRUE)
a<-table.row.end(a)
a<-table.row.start(a)
a<-table.element(a,'Time lag k',header=TRUE)
a<-table.element(a,hyperlink('basics.htm','ACF(k)','click here for more information about the Autocorrelation Function'),header=TRUE)
a<-table.element(a,'T-STAT',header=TRUE)
a<-table.element(a,'P-value',header=TRUE)
a<-table.row.end(a)
for (i in 1:par1) {
a<-table.row.start(a)
a<-table.element(a,i-1,header=TRUE)
a<-table.element(a,round(myacf[i],6))
mytstat <- myacf[i]*sqrtn
a<-table.element(a,round(mytstat,4))
a<-table.element(a,round(1-pt(mytstat,lengthx),6))
a<-table.row.end(a)
}
a<-table.end(a)
table.save(a,file='mytable.tab')
a<-table.start()
a<-table.row.start(a)
a<-table.element(a,'Partial Autocorrelation Function',4,TRUE)
a<-table.row.end(a)
a<-table.row.start(a)
a<-table.element(a,'Time lag k',header=TRUE)
a<-table.element(a,hyperlink('basics.htm','PACF(k)','click here for more information about the Partial Autocorrelation Function'),header=TRUE)
a<-table.element(a,'T-STAT',header=TRUE)
a<-table.element(a,'P-value',header=TRUE)
a<-table.row.end(a)
for (i in 1:par1) {
a<-table.row.start(a)
a<-table.element(a,i-1,header=TRUE)
a<-table.element(a,round(mypacf[i],6))
mytstat <- mypacf[i]*sqrtn
a<-table.element(a,round(mytstat,4))
a<-table.element(a,round(1-pt(mytstat,lengthx),6))
a<-table.row.end(a)
}
a<-table.end(a)
table.save(a,file='mytable1.tab')