Free Statistics
of Irreproducible Research!
Description of Statistical Computation | |||||||||||||||||||||||||||||||||||||||||||||||||||
|---|---|---|---|---|---|---|---|---|---|---|---|---|---|---|---|---|---|---|---|---|---|---|---|---|---|---|---|---|---|---|---|---|---|---|---|---|---|---|---|---|---|---|---|---|---|---|---|---|---|---|---|
| Author's title | |||||||||||||||||||||||||||||||||||||||||||||||||||
| Author | *Unverified author* | ||||||||||||||||||||||||||||||||||||||||||||||||||
| R Software Module | rwasp_pairs.wasp | ||||||||||||||||||||||||||||||||||||||||||||||||||
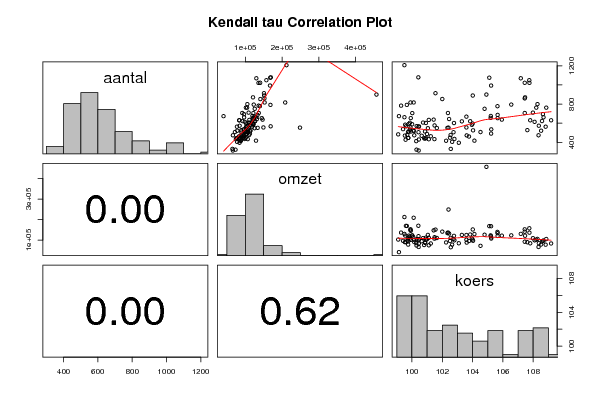
| Title produced by software | Kendall tau Correlation Matrix | ||||||||||||||||||||||||||||||||||||||||||||||||||
| Date of computation | Mon, 03 Dec 2007 03:29:31 -0700 | ||||||||||||||||||||||||||||||||||||||||||||||||||
| Cite this page as follows | Statistical Computations at FreeStatistics.org, Office for Research Development and Education, URL https://freestatistics.org/blog/index.php?v=date/2007/Dec/03/t1196677083a0huwf686q6styw.htm/, Retrieved Sat, 04 May 2024 00:57:57 +0000 | ||||||||||||||||||||||||||||||||||||||||||||||||||
| Statistical Computations at FreeStatistics.org, Office for Research Development and Education, URL https://freestatistics.org/blog/index.php?pk=2304, Retrieved Sat, 04 May 2024 00:57:57 +0000 | |||||||||||||||||||||||||||||||||||||||||||||||||||
| QR Codes: | |||||||||||||||||||||||||||||||||||||||||||||||||||
|
| |||||||||||||||||||||||||||||||||||||||||||||||||||
| Original text written by user: | |||||||||||||||||||||||||||||||||||||||||||||||||||
| IsPrivate? | No (this computation is public) | ||||||||||||||||||||||||||||||||||||||||||||||||||
| User-defined keywords | ex012008 | ||||||||||||||||||||||||||||||||||||||||||||||||||
| Estimated Impact | 537 | ||||||||||||||||||||||||||||||||||||||||||||||||||
Tree of Dependent Computations | |||||||||||||||||||||||||||||||||||||||||||||||||||
| Family? (F = Feedback message, R = changed R code, M = changed R Module, P = changed Parameters, D = changed Data) | |||||||||||||||||||||||||||||||||||||||||||||||||||
| - [Kendall tau Correlation Matrix] [omzet, aantal en ...] [2007-12-03 10:29:31] [d41d8cd98f00b204e9800998ecf8427e] [Current] | |||||||||||||||||||||||||||||||||||||||||||||||||||
| Feedback Forum | |||||||||||||||||||||||||||||||||||||||||||||||||||
Post a new message | |||||||||||||||||||||||||||||||||||||||||||||||||||
Dataset | |||||||||||||||||||||||||||||||||||||||||||||||||||
| Dataseries X: | |||||||||||||||||||||||||||||||||||||||||||||||||||
589 122302.01 100.01 606 109264.65 100.73 566 103674.75 100.46 487 103890.3 100.99 442 75512.66 100.8 463 83121.3 101.24 547 125096.81 101.05 432 74206.73 101.11 513 88481.63 100.86 602 111598.17 100.92 637 146919.48 101.43 913 150790.85 101.55 576 113780.5 101.49 634 110870.76 101.11 563 118785.32 100.43 513 112820.5 99.79 483 102188.92 99.09 477 97092.73 99.69 524 114067.82 100.08 470 89690.15 99.53 427 89267.9 99.58 537 96198.64 99.41 662 129599.75 99.5 1079 169424.7 100.42 816 152510.91 99.9 705 121850.2 100.02 653 144737.64 99.92 584 121381.88 99.55 508 106894.86 99.74 446 94305.06 99.76 604 116800.42 99.86 446 77584.28 99.75 512 100680.88 99.92 533 106634.05 99.86 791 168390.77 99.66 1206 211971.89 99.5 783 136163.28 99.28 567 168950.25 99.6 473 89816.88 100.15 412 85406.93 100.28 314 66055.52 100.44 323 73311.68 100.3 438 85674.51 100.87 429 82822.59 100.45 468 94277.63 100.64 518 100991.65 100.13 555 149245.88 99.9 816 208517.17 100.11 673 40733.51 99.14 593 121352.23 99.79 569 104020.11 100.31 505 99566.82 100.43 447 101352.17 100.92 433 106628.41 101.48 549 109696.95 101.64 553 248696.37 102.41 505 105628.33 102.74 601 120449.17 102.77 706 136547.7 102.37 852 140896.42 102 643 131509.91 102.45 448 95450.31 102.51 551 133592.64 102.34 476 110332.9 102.55 416 88110.54 102.25 331 64931.25 102.56 435 98446.22 102.8 395 84212.38 103.09 405 77519.55 102.65 619 124806.02 103.29 596 102185.94 104 889 151348.79 104.01 668 124378.28 103.59 555 101433.13 103.59 620 126724.22 103.84 472 87461.88 103.61 460 95288.27 103.76 417 129055.33 104.12 582 107753.06 103.95 525 96364.03 104.03 507 71662.75 104.52 750 125666.24 104.79 899 456841.51 104.91 1075 167642.32 105.1 993 167154.73 105.22 777 139685.18 105.64 675 119275.2 105.2 655 122746.05 105.19 535 107337.43 105.23 491 112584.89 105.22 686 133183.08 105.65 637 121152.57 105.93 652 119815.6 105.65 794 122858.44 106.55 859 152077.17 107.44 1049 157221.96 107.74 1022 140435.08 107.44 762 101455.09 108.2 762 104791.29 108.86 563 77226.59 108.82 573 84477.43 108.37 473 66227.74 108.35 527 89076.23 107.61 710 108924.43 107.98 630 83926.11 107.8 706 91764.8 107.44 870 120892.76 107.46 1069 129952.42 107.18 1021 135865.14 107.75 799 105512.77 108.28 694 96486.62 108.64 521 78064.88 108.52 622 92370.22 108.58 614 98454.46 108.09 661 96703.93 108.68 630 83170.95 109.18 | |||||||||||||||||||||||||||||||||||||||||||||||||||
Tables (Output of Computation) | |||||||||||||||||||||||||||||||||||||||||||||||||||
| |||||||||||||||||||||||||||||||||||||||||||||||||||
Figures (Output of Computation) | |||||||||||||||||||||||||||||||||||||||||||||||||||
Input Parameters & R Code | |||||||||||||||||||||||||||||||||||||||||||||||||||
| Parameters (Session): | |||||||||||||||||||||||||||||||||||||||||||||||||||
| Parameters (R input): | |||||||||||||||||||||||||||||||||||||||||||||||||||
| R code (references can be found in the software module): | |||||||||||||||||||||||||||||||||||||||||||||||||||
panel.tau <- function(x, y, digits=2, prefix='', cex.cor) | |||||||||||||||||||||||||||||||||||||||||||||||||||