Free Statistics

of Irreproducible Research!

Author's title

Author*Unverified author*
R Software Modulerwasp_autocorrelation.wasp
Title produced by software(Partial) Autocorrelation Function
Date of computationSun, 02 Dec 2007 13:01:24 -0700
Cite this page as followsStatistical Computations at FreeStatistics.org, Office for Research Development and Education, URL https://freestatistics.org/blog/index.php?v=date/2007/Dec/02/t1196625001d6g3l6olp06oe8w.htm/, Retrieved Sat, 27 Apr 2024 16:00:41 +0000
Statistical Computations at FreeStatistics.org, Office for Research Development and Education, URL https://freestatistics.org/blog/index.php?pk=2288, Retrieved Sat, 27 Apr 2024 16:00:41 +0000
QR Codes:

Original text written by user:
IsPrivate?No (this computation is public)
User-defined keywords
Estimated Impact310
Family? (F = Feedback message, R = changed R code, M = changed R Module, P = changed Parameters, D = changed Data)
-       [(Partial) Autocorrelation Function] [ACF werkloosheid] [2007-12-02 20:01:24] [89d26cd0a44959d9c8b169f34617598a] [Current]
-   PD    [(Partial) Autocorrelation Function] [Werkloosheid] [2007-12-13 20:14:28] [74be16979710d4c4e7c6647856088456]
-   PD    [(Partial) Autocorrelation Function] [Totale uitvoer] [2007-12-13 20:24:06] [74be16979710d4c4e7c6647856088456]
Feedback Forum

Post a new message
Dataseries X:
7.6
7.7
7.6
8.2
8
8.1
8.3
8.2
8.1
7.7
7.6
7.7
8.2
8.4
8.4
8.6
8.4
8.5
8.7
8.7
8.6
7.4
7.3
7.4
9
9.2
9.2
8.5
8.3
8.3
8.6
8.6
8.5
8.1
8.1
8
8.6
8.7
8.7
8.6
8.4
8.4
8.7
8.7
8.5
8.3
8.3
8.3
8.1
8.2
8.1
8.1
7.9
7.7
8.1
8
7.7
7.8
7.6
7.4
7.7


Summary of compuational transaction
Raw Inputview raw input (R code)
Raw Outputview raw output of R engine
Computing time3 seconds
R Server'Herman Ole Andreas Wold' @ 193.190.124.10:1001

\begin{tabular}{lllllllll}
\hline
Summary of compuational transaction \tabularnewline
Raw Input & view raw input (R code)  \tabularnewline
Raw Output & view raw output of R engine  \tabularnewline
Computing time & 3 seconds \tabularnewline
R Server & 'Herman Ole Andreas Wold' @ 193.190.124.10:1001 \tabularnewline
\hline
\end{tabular}
%Source: https://freestatistics.org/blog/index.php?pk=2288&T=0

[TABLE]
[ROW][C]Summary of compuational transaction[/C][/ROW]
[ROW][C]Raw Input[/C][C]view raw input (R code) [/C][/ROW]
[ROW][C]Raw Output[/C][C]view raw output of R engine [/C][/ROW]
[ROW][C]Computing time[/C][C]3 seconds[/C][/ROW]
[ROW][C]R Server[/C][C]'Herman Ole Andreas Wold' @ 193.190.124.10:1001[/C][/ROW]
[/TABLE]
Source: https://freestatistics.org/blog/index.php?pk=2288&T=0

Globally Unique Identifier (entire table): ba.freestatistics.org/blog/index.php?pk=2288&T=0

As an alternative you can also use a QR Code:  

The GUIDs for individual cells are displayed in the table below:

Summary of compuational transaction
Raw Inputview raw input (R code)
Raw Outputview raw output of R engine
Computing time3 seconds
R Server'Herman Ole Andreas Wold' @ 193.190.124.10:1001


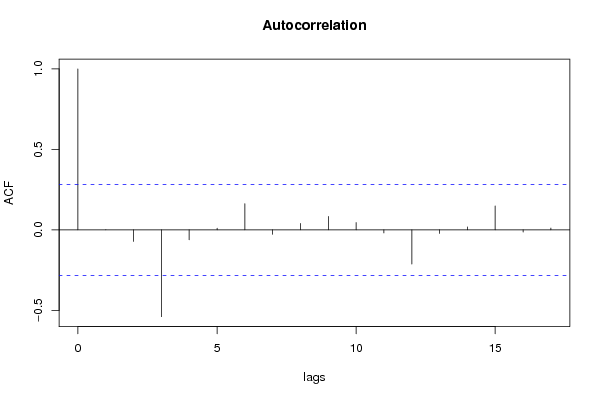
Autocorrelation Function
Time lag kACF(k)T-STATP-value
016.92820
10.0010190.00710.497199
2-0.072251-0.50060.69052
3-0.539298-3.73640.999752
4-0.061567-0.42650.664191
50.0106080.07350.470859
60.1628591.12830.132396
7-0.027461-0.19030.575044
80.0401520.27820.391035
90.083660.57960.282444
100.0456610.31640.376554
11-0.019437-0.13470.553281
12-0.212822-1.47450.926558
13-0.022235-0.1540.560891
140.0182090.12620.450068
150.1486711.030.154082
16-0.013868-0.09610.538072

\begin{tabular}{lllllllll}
\hline
Autocorrelation Function \tabularnewline
Time lag k & ACF(k) & T-STAT & P-value \tabularnewline
0 & 1 & 6.9282 & 0 \tabularnewline
1 & 0.001019 & 0.0071 & 0.497199 \tabularnewline
2 & -0.072251 & -0.5006 & 0.69052 \tabularnewline
3 & -0.539298 & -3.7364 & 0.999752 \tabularnewline
4 & -0.061567 & -0.4265 & 0.664191 \tabularnewline
5 & 0.010608 & 0.0735 & 0.470859 \tabularnewline
6 & 0.162859 & 1.1283 & 0.132396 \tabularnewline
7 & -0.027461 & -0.1903 & 0.575044 \tabularnewline
8 & 0.040152 & 0.2782 & 0.391035 \tabularnewline
9 & 0.08366 & 0.5796 & 0.282444 \tabularnewline
10 & 0.045661 & 0.3164 & 0.376554 \tabularnewline
11 & -0.019437 & -0.1347 & 0.553281 \tabularnewline
12 & -0.212822 & -1.4745 & 0.926558 \tabularnewline
13 & -0.022235 & -0.154 & 0.560891 \tabularnewline
14 & 0.018209 & 0.1262 & 0.450068 \tabularnewline
15 & 0.148671 & 1.03 & 0.154082 \tabularnewline
16 & -0.013868 & -0.0961 & 0.538072 \tabularnewline
\hline
\end{tabular}
%Source: https://freestatistics.org/blog/index.php?pk=2288&T=1

[TABLE]
[ROW][C]Autocorrelation Function[/C][/ROW]
[ROW][C]Time lag k[/C][C]ACF(k)[/C][C]T-STAT[/C][C]P-value[/C][/ROW]
[ROW][C]0[/C][C]1[/C][C]6.9282[/C][C]0[/C][/ROW]
[ROW][C]1[/C][C]0.001019[/C][C]0.0071[/C][C]0.497199[/C][/ROW]
[ROW][C]2[/C][C]-0.072251[/C][C]-0.5006[/C][C]0.69052[/C][/ROW]
[ROW][C]3[/C][C]-0.539298[/C][C]-3.7364[/C][C]0.999752[/C][/ROW]
[ROW][C]4[/C][C]-0.061567[/C][C]-0.4265[/C][C]0.664191[/C][/ROW]
[ROW][C]5[/C][C]0.010608[/C][C]0.0735[/C][C]0.470859[/C][/ROW]
[ROW][C]6[/C][C]0.162859[/C][C]1.1283[/C][C]0.132396[/C][/ROW]
[ROW][C]7[/C][C]-0.027461[/C][C]-0.1903[/C][C]0.575044[/C][/ROW]
[ROW][C]8[/C][C]0.040152[/C][C]0.2782[/C][C]0.391035[/C][/ROW]
[ROW][C]9[/C][C]0.08366[/C][C]0.5796[/C][C]0.282444[/C][/ROW]
[ROW][C]10[/C][C]0.045661[/C][C]0.3164[/C][C]0.376554[/C][/ROW]
[ROW][C]11[/C][C]-0.019437[/C][C]-0.1347[/C][C]0.553281[/C][/ROW]
[ROW][C]12[/C][C]-0.212822[/C][C]-1.4745[/C][C]0.926558[/C][/ROW]
[ROW][C]13[/C][C]-0.022235[/C][C]-0.154[/C][C]0.560891[/C][/ROW]
[ROW][C]14[/C][C]0.018209[/C][C]0.1262[/C][C]0.450068[/C][/ROW]
[ROW][C]15[/C][C]0.148671[/C][C]1.03[/C][C]0.154082[/C][/ROW]
[ROW][C]16[/C][C]-0.013868[/C][C]-0.0961[/C][C]0.538072[/C][/ROW]
[/TABLE]
Source: https://freestatistics.org/blog/index.php?pk=2288&T=1

Globally Unique Identifier (entire table): ba.freestatistics.org/blog/index.php?pk=2288&T=1

As an alternative you can also use a QR Code:  

The GUIDs for individual cells are displayed in the table below:

Autocorrelation Function
Time lag kACF(k)T-STATP-value
016.92820
10.0010190.00710.497199
2-0.072251-0.50060.69052
3-0.539298-3.73640.999752
4-0.061567-0.42650.664191
50.0106080.07350.470859
60.1628591.12830.132396
7-0.027461-0.19030.575044
80.0401520.27820.391035
90.083660.57960.282444
100.0456610.31640.376554
11-0.019437-0.13470.553281
12-0.212822-1.47450.926558
13-0.022235-0.1540.560891
140.0182090.12620.450068
150.1486711.030.154082
16-0.013868-0.09610.538072


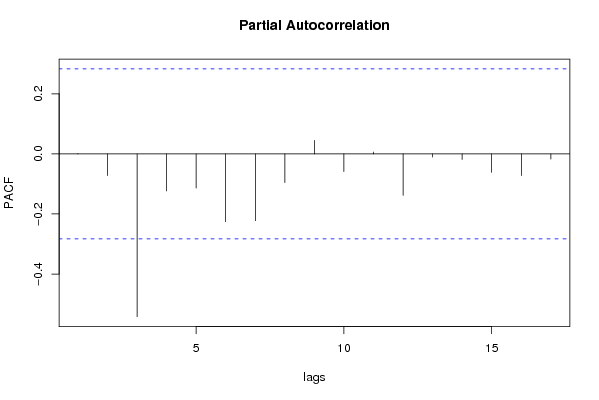
Partial Autocorrelation Function
Time lag kPACF(k)T-STATP-value
00.0010190.00710.497199
1-0.072252-0.50060.690523
2-0.541975-3.75490.999766
3-0.123434-0.85520.801648
4-0.113667-0.78750.782572
5-0.225616-1.56310.937702
6-0.22261-1.54230.935215
7-0.095611-0.66240.744563
80.0448790.31090.378599
9-0.059024-0.40890.657796
100.006250.04330.482822
11-0.137988-0.9560.828071
12-0.010488-0.07270.528813
13-0.018535-0.12840.550822
14-0.061452-0.42580.663904
15-0.071977-0.49870.689855
16-0.01713-0.11870.546988

\begin{tabular}{lllllllll}
\hline
Partial Autocorrelation Function \tabularnewline
Time lag k & PACF(k) & T-STAT & P-value \tabularnewline
0 & 0.001019 & 0.0071 & 0.497199 \tabularnewline
1 & -0.072252 & -0.5006 & 0.690523 \tabularnewline
2 & -0.541975 & -3.7549 & 0.999766 \tabularnewline
3 & -0.123434 & -0.8552 & 0.801648 \tabularnewline
4 & -0.113667 & -0.7875 & 0.782572 \tabularnewline
5 & -0.225616 & -1.5631 & 0.937702 \tabularnewline
6 & -0.22261 & -1.5423 & 0.935215 \tabularnewline
7 & -0.095611 & -0.6624 & 0.744563 \tabularnewline
8 & 0.044879 & 0.3109 & 0.378599 \tabularnewline
9 & -0.059024 & -0.4089 & 0.657796 \tabularnewline
10 & 0.00625 & 0.0433 & 0.482822 \tabularnewline
11 & -0.137988 & -0.956 & 0.828071 \tabularnewline
12 & -0.010488 & -0.0727 & 0.528813 \tabularnewline
13 & -0.018535 & -0.1284 & 0.550822 \tabularnewline
14 & -0.061452 & -0.4258 & 0.663904 \tabularnewline
15 & -0.071977 & -0.4987 & 0.689855 \tabularnewline
16 & -0.01713 & -0.1187 & 0.546988 \tabularnewline
\hline
\end{tabular}
%Source: https://freestatistics.org/blog/index.php?pk=2288&T=2

[TABLE]
[ROW][C]Partial Autocorrelation Function[/C][/ROW]
[ROW][C]Time lag k[/C][C]PACF(k)[/C][C]T-STAT[/C][C]P-value[/C][/ROW]
[ROW][C]0[/C][C]0.001019[/C][C]0.0071[/C][C]0.497199[/C][/ROW]
[ROW][C]1[/C][C]-0.072252[/C][C]-0.5006[/C][C]0.690523[/C][/ROW]
[ROW][C]2[/C][C]-0.541975[/C][C]-3.7549[/C][C]0.999766[/C][/ROW]
[ROW][C]3[/C][C]-0.123434[/C][C]-0.8552[/C][C]0.801648[/C][/ROW]
[ROW][C]4[/C][C]-0.113667[/C][C]-0.7875[/C][C]0.782572[/C][/ROW]
[ROW][C]5[/C][C]-0.225616[/C][C]-1.5631[/C][C]0.937702[/C][/ROW]
[ROW][C]6[/C][C]-0.22261[/C][C]-1.5423[/C][C]0.935215[/C][/ROW]
[ROW][C]7[/C][C]-0.095611[/C][C]-0.6624[/C][C]0.744563[/C][/ROW]
[ROW][C]8[/C][C]0.044879[/C][C]0.3109[/C][C]0.378599[/C][/ROW]
[ROW][C]9[/C][C]-0.059024[/C][C]-0.4089[/C][C]0.657796[/C][/ROW]
[ROW][C]10[/C][C]0.00625[/C][C]0.0433[/C][C]0.482822[/C][/ROW]
[ROW][C]11[/C][C]-0.137988[/C][C]-0.956[/C][C]0.828071[/C][/ROW]
[ROW][C]12[/C][C]-0.010488[/C][C]-0.0727[/C][C]0.528813[/C][/ROW]
[ROW][C]13[/C][C]-0.018535[/C][C]-0.1284[/C][C]0.550822[/C][/ROW]
[ROW][C]14[/C][C]-0.061452[/C][C]-0.4258[/C][C]0.663904[/C][/ROW]
[ROW][C]15[/C][C]-0.071977[/C][C]-0.4987[/C][C]0.689855[/C][/ROW]
[ROW][C]16[/C][C]-0.01713[/C][C]-0.1187[/C][C]0.546988[/C][/ROW]
[/TABLE]
Source: https://freestatistics.org/blog/index.php?pk=2288&T=2

Globally Unique Identifier (entire table): ba.freestatistics.org/blog/index.php?pk=2288&T=2

As an alternative you can also use a QR Code:  

The GUIDs for individual cells are displayed in the table below:

Partial Autocorrelation Function
Time lag kPACF(k)T-STATP-value
00.0010190.00710.497199
1-0.072252-0.50060.690523
2-0.541975-3.75490.999766
3-0.123434-0.85520.801648
4-0.113667-0.78750.782572
5-0.225616-1.56310.937702
6-0.22261-1.54230.935215
7-0.095611-0.66240.744563
80.0448790.31090.378599
9-0.059024-0.40890.657796
100.006250.04330.482822
11-0.137988-0.9560.828071
12-0.010488-0.07270.528813
13-0.018535-0.12840.550822
14-0.061452-0.42580.663904
15-0.071977-0.49870.689855
16-0.01713-0.11870.546988


Parameters (Session):
par1 = Default ; par2 = 1 ; par3 = 1 ; par4 = 1 ; par5 = 12 ;
Parameters (R input):
par1 = Default ; par2 = 1 ; par3 = 1 ; par4 = 1 ; par5 = 12 ;
R code (references can be found in the software module):
if (par1 == 'Default') {
par1 = 10*log10(length(x))
} else {
par1 <- as.numeric(par1)
}
par2 <- as.numeric(par2)
par3 <- as.numeric(par3)
par4 <- as.numeric(par4)
par5 <- as.numeric(par5)
if (par2 == 0) {
x <- log(x)
} else {
x <- (x ^ par2 - 1) / par2
}
if (par3 > 0) x <- diff(x,lag=1,difference=par3)
if (par4 > 0) x <- diff(x,lag=par5,difference=par4)
bitmap(file='pic1.png')
racf <- acf(x,par1,main='Autocorrelation',xlab='lags',ylab='ACF')
dev.off()
bitmap(file='pic2.png')
rpacf <- pacf(x,par1,main='Partial Autocorrelation',xlab='lags',ylab='PACF')
dev.off()
(myacf <- c(racf$acf))
(mypacf <- c(rpacf$acf))
lengthx <- length(x)
sqrtn <- sqrt(lengthx)
load(file='createtable')
a<-table.start()
a<-table.row.start(a)
a<-table.element(a,'Autocorrelation Function',4,TRUE)
a<-table.row.end(a)
a<-table.row.start(a)
a<-table.element(a,'Time lag k',header=TRUE)
a<-table.element(a,hyperlink('basics.htm','ACF(k)','click here for more information about the Autocorrelation Function'),header=TRUE)
a<-table.element(a,'T-STAT',header=TRUE)
a<-table.element(a,'P-value',header=TRUE)
a<-table.row.end(a)
for (i in 1:par1) {
a<-table.row.start(a)
a<-table.element(a,i-1,header=TRUE)
a<-table.element(a,round(myacf[i],6))
mytstat <- myacf[i]*sqrtn
a<-table.element(a,round(mytstat,4))
a<-table.element(a,round(1-pt(mytstat,lengthx),6))
a<-table.row.end(a)
}
a<-table.end(a)
table.save(a,file='mytable.tab')
a<-table.start()
a<-table.row.start(a)
a<-table.element(a,'Partial Autocorrelation Function',4,TRUE)
a<-table.row.end(a)
a<-table.row.start(a)
a<-table.element(a,'Time lag k',header=TRUE)
a<-table.element(a,hyperlink('basics.htm','PACF(k)','click here for more information about the Partial Autocorrelation Function'),header=TRUE)
a<-table.element(a,'T-STAT',header=TRUE)
a<-table.element(a,'P-value',header=TRUE)
a<-table.row.end(a)
for (i in 1:par1) {
a<-table.row.start(a)
a<-table.element(a,i-1,header=TRUE)
a<-table.element(a,round(mypacf[i],6))
mytstat <- mypacf[i]*sqrtn
a<-table.element(a,round(mytstat,4))
a<-table.element(a,round(1-pt(mytstat,lengthx),6))
a<-table.row.end(a)
}
a<-table.end(a)
table.save(a,file='mytable1.tab')