Free Statistics

of Irreproducible Research!

Author's title

Author*Unverified author*
R Software Modulerwasp_autocorrelation.wasp
Title produced by software(Partial) Autocorrelation Function
Date of computationSun, 02 Dec 2007 12:39:04 -0700
Cite this page as followsStatistical Computations at FreeStatistics.org, Office for Research Development and Education, URL https://freestatistics.org/blog/index.php?v=date/2007/Dec/02/t1196623728mxp3jbp34qf9ov1.htm/, Retrieved Sat, 27 Apr 2024 21:38:21 +0000
Statistical Computations at FreeStatistics.org, Office for Research Development and Education, URL https://freestatistics.org/blog/index.php?pk=2287, Retrieved Sat, 27 Apr 2024 21:38:21 +0000
QR Codes:

Original text written by user:
IsPrivate?No (this computation is public)
User-defined keywords
Estimated Impact273
Family? (F = Feedback message, R = changed R code, M = changed R Module, P = changed Parameters, D = changed Data)
-       [(Partial) Autocorrelation Function] [AcF tot.uitvoer] [2007-12-02 19:39:04] [89d26cd0a44959d9c8b169f34617598a] [Current]
Feedback Forum

Post a new message
Dataseries X:
15023.6
12083
15761.3
16943
15070.3
13659.6
14768.9
14725.1
15998.1
15370.6
14956.9
15469.7
15101.8
11703.7
16283.6
16726.5
14968.9
14861
14583.3
15305.8
17903.9
16379.4
15420.3
17870.5
15912.8
13866.5
17823.2
17872
17420.4
16704.4
15991.2
16583.6
19123.5
17838.7
17209.4
18586.5
16258.1
15141.6
19202.1
17746.5
19090.1
18040.3
17515.5
17751.8
21072.4
17170
19439.5
19795.4
17574.9
16165.4
19464.6
19932.1
19961.2
17343.4
18924.2
18574.1
21350.6
18840.1
20304.8
21132.4
19753.9


Summary of compuational transaction
Raw Inputview raw input (R code)
Raw Outputview raw output of R engine
Computing time2 seconds
R Server'Gwilym Jenkins' @ 72.249.127.135

\begin{tabular}{lllllllll}
\hline
Summary of compuational transaction \tabularnewline
Raw Input & view raw input (R code)  \tabularnewline
Raw Output & view raw output of R engine  \tabularnewline
Computing time & 2 seconds \tabularnewline
R Server & 'Gwilym Jenkins' @ 72.249.127.135 \tabularnewline
\hline
\end{tabular}
%Source: https://freestatistics.org/blog/index.php?pk=2287&T=0

[TABLE]
[ROW][C]Summary of compuational transaction[/C][/ROW]
[ROW][C]Raw Input[/C][C]view raw input (R code) [/C][/ROW]
[ROW][C]Raw Output[/C][C]view raw output of R engine [/C][/ROW]
[ROW][C]Computing time[/C][C]2 seconds[/C][/ROW]
[ROW][C]R Server[/C][C]'Gwilym Jenkins' @ 72.249.127.135[/C][/ROW]
[/TABLE]
Source: https://freestatistics.org/blog/index.php?pk=2287&T=0

Globally Unique Identifier (entire table): ba.freestatistics.org/blog/index.php?pk=2287&T=0

As an alternative you can also use a QR Code:  

The GUIDs for individual cells are displayed in the table below:

Summary of compuational transaction
Raw Inputview raw input (R code)
Raw Outputview raw output of R engine
Computing time2 seconds
R Server'Gwilym Jenkins' @ 72.249.127.135


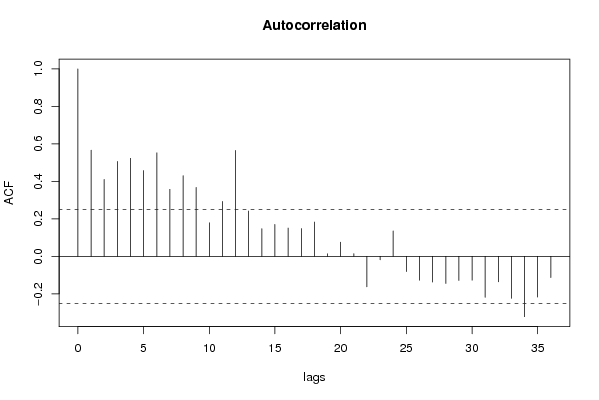
Autocorrelation Function
Time lag kACF(k)T-STATP-value
017.81020
10.5664464.42412e-05
20.4104653.20580.001072
30.5063423.95470.000101
40.52324.08636.5e-05
50.4575113.57330.000348
60.552644.31633e-05
70.3572482.79020.00351
80.4300893.35910.000676
90.3678992.87340.00279
100.1791121.39890.083452
110.2928412.28720.012835
120.5649354.41232.1e-05
130.2417841.88840.031866
140.147541.15230.126842
150.1703311.33030.094182
160.1505851.17610.122061
170.147961.15560.126174
180.1826761.42670.079376
190.0131070.10240.459398
200.0750760.58640.279898
210.0140670.10990.456437
22-0.162571-1.26970.895497
23-0.018918-0.14780.558487
240.1351891.05590.147598
25-0.081769-0.63860.737275
26-0.127487-0.99570.838337
27-0.137694-1.07540.85679
28-0.144994-1.13240.86906
29-0.128897-1.00670.840977
30-0.127171-0.99320.837741
31-0.218722-1.70830.953665
32-0.135962-1.06190.853766
33-0.224122-1.75040.957465
34-0.3221-2.51570.992735
35-0.217428-1.69820.952714

\begin{tabular}{lllllllll}
\hline
Autocorrelation Function \tabularnewline
Time lag k & ACF(k) & T-STAT & P-value \tabularnewline
0 & 1 & 7.8102 & 0 \tabularnewline
1 & 0.566446 & 4.4241 & 2e-05 \tabularnewline
2 & 0.410465 & 3.2058 & 0.001072 \tabularnewline
3 & 0.506342 & 3.9547 & 0.000101 \tabularnewline
4 & 0.5232 & 4.0863 & 6.5e-05 \tabularnewline
5 & 0.457511 & 3.5733 & 0.000348 \tabularnewline
6 & 0.55264 & 4.3163 & 3e-05 \tabularnewline
7 & 0.357248 & 2.7902 & 0.00351 \tabularnewline
8 & 0.430089 & 3.3591 & 0.000676 \tabularnewline
9 & 0.367899 & 2.8734 & 0.00279 \tabularnewline
10 & 0.179112 & 1.3989 & 0.083452 \tabularnewline
11 & 0.292841 & 2.2872 & 0.012835 \tabularnewline
12 & 0.564935 & 4.4123 & 2.1e-05 \tabularnewline
13 & 0.241784 & 1.8884 & 0.031866 \tabularnewline
14 & 0.14754 & 1.1523 & 0.126842 \tabularnewline
15 & 0.170331 & 1.3303 & 0.094182 \tabularnewline
16 & 0.150585 & 1.1761 & 0.122061 \tabularnewline
17 & 0.14796 & 1.1556 & 0.126174 \tabularnewline
18 & 0.182676 & 1.4267 & 0.079376 \tabularnewline
19 & 0.013107 & 0.1024 & 0.459398 \tabularnewline
20 & 0.075076 & 0.5864 & 0.279898 \tabularnewline
21 & 0.014067 & 0.1099 & 0.456437 \tabularnewline
22 & -0.162571 & -1.2697 & 0.895497 \tabularnewline
23 & -0.018918 & -0.1478 & 0.558487 \tabularnewline
24 & 0.135189 & 1.0559 & 0.147598 \tabularnewline
25 & -0.081769 & -0.6386 & 0.737275 \tabularnewline
26 & -0.127487 & -0.9957 & 0.838337 \tabularnewline
27 & -0.137694 & -1.0754 & 0.85679 \tabularnewline
28 & -0.144994 & -1.1324 & 0.86906 \tabularnewline
29 & -0.128897 & -1.0067 & 0.840977 \tabularnewline
30 & -0.127171 & -0.9932 & 0.837741 \tabularnewline
31 & -0.218722 & -1.7083 & 0.953665 \tabularnewline
32 & -0.135962 & -1.0619 & 0.853766 \tabularnewline
33 & -0.224122 & -1.7504 & 0.957465 \tabularnewline
34 & -0.3221 & -2.5157 & 0.992735 \tabularnewline
35 & -0.217428 & -1.6982 & 0.952714 \tabularnewline
\hline
\end{tabular}
%Source: https://freestatistics.org/blog/index.php?pk=2287&T=1

[TABLE]
[ROW][C]Autocorrelation Function[/C][/ROW]
[ROW][C]Time lag k[/C][C]ACF(k)[/C][C]T-STAT[/C][C]P-value[/C][/ROW]
[ROW][C]0[/C][C]1[/C][C]7.8102[/C][C]0[/C][/ROW]
[ROW][C]1[/C][C]0.566446[/C][C]4.4241[/C][C]2e-05[/C][/ROW]
[ROW][C]2[/C][C]0.410465[/C][C]3.2058[/C][C]0.001072[/C][/ROW]
[ROW][C]3[/C][C]0.506342[/C][C]3.9547[/C][C]0.000101[/C][/ROW]
[ROW][C]4[/C][C]0.5232[/C][C]4.0863[/C][C]6.5e-05[/C][/ROW]
[ROW][C]5[/C][C]0.457511[/C][C]3.5733[/C][C]0.000348[/C][/ROW]
[ROW][C]6[/C][C]0.55264[/C][C]4.3163[/C][C]3e-05[/C][/ROW]
[ROW][C]7[/C][C]0.357248[/C][C]2.7902[/C][C]0.00351[/C][/ROW]
[ROW][C]8[/C][C]0.430089[/C][C]3.3591[/C][C]0.000676[/C][/ROW]
[ROW][C]9[/C][C]0.367899[/C][C]2.8734[/C][C]0.00279[/C][/ROW]
[ROW][C]10[/C][C]0.179112[/C][C]1.3989[/C][C]0.083452[/C][/ROW]
[ROW][C]11[/C][C]0.292841[/C][C]2.2872[/C][C]0.012835[/C][/ROW]
[ROW][C]12[/C][C]0.564935[/C][C]4.4123[/C][C]2.1e-05[/C][/ROW]
[ROW][C]13[/C][C]0.241784[/C][C]1.8884[/C][C]0.031866[/C][/ROW]
[ROW][C]14[/C][C]0.14754[/C][C]1.1523[/C][C]0.126842[/C][/ROW]
[ROW][C]15[/C][C]0.170331[/C][C]1.3303[/C][C]0.094182[/C][/ROW]
[ROW][C]16[/C][C]0.150585[/C][C]1.1761[/C][C]0.122061[/C][/ROW]
[ROW][C]17[/C][C]0.14796[/C][C]1.1556[/C][C]0.126174[/C][/ROW]
[ROW][C]18[/C][C]0.182676[/C][C]1.4267[/C][C]0.079376[/C][/ROW]
[ROW][C]19[/C][C]0.013107[/C][C]0.1024[/C][C]0.459398[/C][/ROW]
[ROW][C]20[/C][C]0.075076[/C][C]0.5864[/C][C]0.279898[/C][/ROW]
[ROW][C]21[/C][C]0.014067[/C][C]0.1099[/C][C]0.456437[/C][/ROW]
[ROW][C]22[/C][C]-0.162571[/C][C]-1.2697[/C][C]0.895497[/C][/ROW]
[ROW][C]23[/C][C]-0.018918[/C][C]-0.1478[/C][C]0.558487[/C][/ROW]
[ROW][C]24[/C][C]0.135189[/C][C]1.0559[/C][C]0.147598[/C][/ROW]
[ROW][C]25[/C][C]-0.081769[/C][C]-0.6386[/C][C]0.737275[/C][/ROW]
[ROW][C]26[/C][C]-0.127487[/C][C]-0.9957[/C][C]0.838337[/C][/ROW]
[ROW][C]27[/C][C]-0.137694[/C][C]-1.0754[/C][C]0.85679[/C][/ROW]
[ROW][C]28[/C][C]-0.144994[/C][C]-1.1324[/C][C]0.86906[/C][/ROW]
[ROW][C]29[/C][C]-0.128897[/C][C]-1.0067[/C][C]0.840977[/C][/ROW]
[ROW][C]30[/C][C]-0.127171[/C][C]-0.9932[/C][C]0.837741[/C][/ROW]
[ROW][C]31[/C][C]-0.218722[/C][C]-1.7083[/C][C]0.953665[/C][/ROW]
[ROW][C]32[/C][C]-0.135962[/C][C]-1.0619[/C][C]0.853766[/C][/ROW]
[ROW][C]33[/C][C]-0.224122[/C][C]-1.7504[/C][C]0.957465[/C][/ROW]
[ROW][C]34[/C][C]-0.3221[/C][C]-2.5157[/C][C]0.992735[/C][/ROW]
[ROW][C]35[/C][C]-0.217428[/C][C]-1.6982[/C][C]0.952714[/C][/ROW]
[/TABLE]
Source: https://freestatistics.org/blog/index.php?pk=2287&T=1

Globally Unique Identifier (entire table): ba.freestatistics.org/blog/index.php?pk=2287&T=1

As an alternative you can also use a QR Code:  

The GUIDs for individual cells are displayed in the table below:

Autocorrelation Function
Time lag kACF(k)T-STATP-value
017.81020
10.5664464.42412e-05
20.4104653.20580.001072
30.5063423.95470.000101
40.52324.08636.5e-05
50.4575113.57330.000348
60.552644.31633e-05
70.3572482.79020.00351
80.4300893.35910.000676
90.3678992.87340.00279
100.1791121.39890.083452
110.2928412.28720.012835
120.5649354.41232.1e-05
130.2417841.88840.031866
140.147541.15230.126842
150.1703311.33030.094182
160.1505851.17610.122061
170.147961.15560.126174
180.1826761.42670.079376
190.0131070.10240.459398
200.0750760.58640.279898
210.0140670.10990.456437
22-0.162571-1.26970.895497
23-0.018918-0.14780.558487
240.1351891.05590.147598
25-0.081769-0.63860.737275
26-0.127487-0.99570.838337
27-0.137694-1.07540.85679
28-0.144994-1.13240.86906
29-0.128897-1.00670.840977
30-0.127171-0.99320.837741
31-0.218722-1.70830.953665
32-0.135962-1.06190.853766
33-0.224122-1.75040.957465
34-0.3221-2.51570.992735
35-0.217428-1.69820.952714


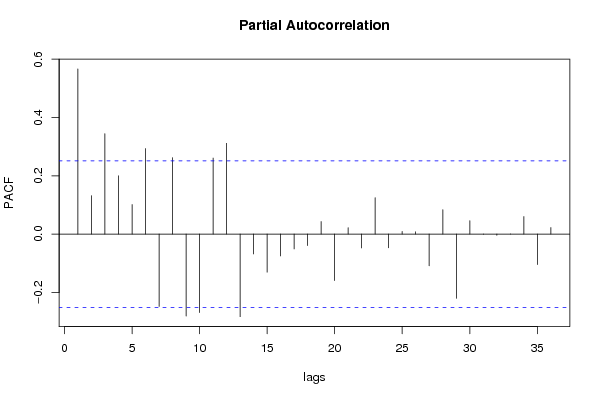
Partial Autocorrelation Function
Time lag kPACF(k)T-STATP-value
00.5664464.42412e-05
10.1319381.03050.153429
20.3443292.68930.004611
30.1998061.56050.061903
40.1013640.79170.215809
50.2932912.29070.012726
6-0.248276-1.93910.97144
70.2621242.04730.022474
8-0.281235-2.19650.984067
9-0.269301-2.10330.980215
100.260872.03750.022974
110.3114692.43270.008968
12-0.283189-2.21180.984631
13-0.068154-0.53230.701773
14-0.130898-1.02230.844673
15-0.07501-0.58580.719929
16-0.051057-0.39880.654272
17-0.039388-0.30760.620296
180.0431020.33660.368774
19-0.159325-1.24440.890938
200.0221050.17260.43175
21-0.047467-0.37070.643938
220.1247550.97440.166862
23-0.047218-0.36880.643217
240.0091010.07110.471783
250.0076490.05970.47628
26-0.108747-0.84930.800494
270.083750.65410.257749
28-0.220244-1.72020.954764
290.0458370.3580.360789
30-0.000309-0.00240.500959
31-0.004352-0.0340.513501
320.0003530.00280.498905
330.0599560.46830.32063
34-0.104713-0.81780.791683
350.0224330.17520.430748

\begin{tabular}{lllllllll}
\hline
Partial Autocorrelation Function \tabularnewline
Time lag k & PACF(k) & T-STAT & P-value \tabularnewline
0 & 0.566446 & 4.4241 & 2e-05 \tabularnewline
1 & 0.131938 & 1.0305 & 0.153429 \tabularnewline
2 & 0.344329 & 2.6893 & 0.004611 \tabularnewline
3 & 0.199806 & 1.5605 & 0.061903 \tabularnewline
4 & 0.101364 & 0.7917 & 0.215809 \tabularnewline
5 & 0.293291 & 2.2907 & 0.012726 \tabularnewline
6 & -0.248276 & -1.9391 & 0.97144 \tabularnewline
7 & 0.262124 & 2.0473 & 0.022474 \tabularnewline
8 & -0.281235 & -2.1965 & 0.984067 \tabularnewline
9 & -0.269301 & -2.1033 & 0.980215 \tabularnewline
10 & 0.26087 & 2.0375 & 0.022974 \tabularnewline
11 & 0.311469 & 2.4327 & 0.008968 \tabularnewline
12 & -0.283189 & -2.2118 & 0.984631 \tabularnewline
13 & -0.068154 & -0.5323 & 0.701773 \tabularnewline
14 & -0.130898 & -1.0223 & 0.844673 \tabularnewline
15 & -0.07501 & -0.5858 & 0.719929 \tabularnewline
16 & -0.051057 & -0.3988 & 0.654272 \tabularnewline
17 & -0.039388 & -0.3076 & 0.620296 \tabularnewline
18 & 0.043102 & 0.3366 & 0.368774 \tabularnewline
19 & -0.159325 & -1.2444 & 0.890938 \tabularnewline
20 & 0.022105 & 0.1726 & 0.43175 \tabularnewline
21 & -0.047467 & -0.3707 & 0.643938 \tabularnewline
22 & 0.124755 & 0.9744 & 0.166862 \tabularnewline
23 & -0.047218 & -0.3688 & 0.643217 \tabularnewline
24 & 0.009101 & 0.0711 & 0.471783 \tabularnewline
25 & 0.007649 & 0.0597 & 0.47628 \tabularnewline
26 & -0.108747 & -0.8493 & 0.800494 \tabularnewline
27 & 0.08375 & 0.6541 & 0.257749 \tabularnewline
28 & -0.220244 & -1.7202 & 0.954764 \tabularnewline
29 & 0.045837 & 0.358 & 0.360789 \tabularnewline
30 & -0.000309 & -0.0024 & 0.500959 \tabularnewline
31 & -0.004352 & -0.034 & 0.513501 \tabularnewline
32 & 0.000353 & 0.0028 & 0.498905 \tabularnewline
33 & 0.059956 & 0.4683 & 0.32063 \tabularnewline
34 & -0.104713 & -0.8178 & 0.791683 \tabularnewline
35 & 0.022433 & 0.1752 & 0.430748 \tabularnewline
\hline
\end{tabular}
%Source: https://freestatistics.org/blog/index.php?pk=2287&T=2

[TABLE]
[ROW][C]Partial Autocorrelation Function[/C][/ROW]
[ROW][C]Time lag k[/C][C]PACF(k)[/C][C]T-STAT[/C][C]P-value[/C][/ROW]
[ROW][C]0[/C][C]0.566446[/C][C]4.4241[/C][C]2e-05[/C][/ROW]
[ROW][C]1[/C][C]0.131938[/C][C]1.0305[/C][C]0.153429[/C][/ROW]
[ROW][C]2[/C][C]0.344329[/C][C]2.6893[/C][C]0.004611[/C][/ROW]
[ROW][C]3[/C][C]0.199806[/C][C]1.5605[/C][C]0.061903[/C][/ROW]
[ROW][C]4[/C][C]0.101364[/C][C]0.7917[/C][C]0.215809[/C][/ROW]
[ROW][C]5[/C][C]0.293291[/C][C]2.2907[/C][C]0.012726[/C][/ROW]
[ROW][C]6[/C][C]-0.248276[/C][C]-1.9391[/C][C]0.97144[/C][/ROW]
[ROW][C]7[/C][C]0.262124[/C][C]2.0473[/C][C]0.022474[/C][/ROW]
[ROW][C]8[/C][C]-0.281235[/C][C]-2.1965[/C][C]0.984067[/C][/ROW]
[ROW][C]9[/C][C]-0.269301[/C][C]-2.1033[/C][C]0.980215[/C][/ROW]
[ROW][C]10[/C][C]0.26087[/C][C]2.0375[/C][C]0.022974[/C][/ROW]
[ROW][C]11[/C][C]0.311469[/C][C]2.4327[/C][C]0.008968[/C][/ROW]
[ROW][C]12[/C][C]-0.283189[/C][C]-2.2118[/C][C]0.984631[/C][/ROW]
[ROW][C]13[/C][C]-0.068154[/C][C]-0.5323[/C][C]0.701773[/C][/ROW]
[ROW][C]14[/C][C]-0.130898[/C][C]-1.0223[/C][C]0.844673[/C][/ROW]
[ROW][C]15[/C][C]-0.07501[/C][C]-0.5858[/C][C]0.719929[/C][/ROW]
[ROW][C]16[/C][C]-0.051057[/C][C]-0.3988[/C][C]0.654272[/C][/ROW]
[ROW][C]17[/C][C]-0.039388[/C][C]-0.3076[/C][C]0.620296[/C][/ROW]
[ROW][C]18[/C][C]0.043102[/C][C]0.3366[/C][C]0.368774[/C][/ROW]
[ROW][C]19[/C][C]-0.159325[/C][C]-1.2444[/C][C]0.890938[/C][/ROW]
[ROW][C]20[/C][C]0.022105[/C][C]0.1726[/C][C]0.43175[/C][/ROW]
[ROW][C]21[/C][C]-0.047467[/C][C]-0.3707[/C][C]0.643938[/C][/ROW]
[ROW][C]22[/C][C]0.124755[/C][C]0.9744[/C][C]0.166862[/C][/ROW]
[ROW][C]23[/C][C]-0.047218[/C][C]-0.3688[/C][C]0.643217[/C][/ROW]
[ROW][C]24[/C][C]0.009101[/C][C]0.0711[/C][C]0.471783[/C][/ROW]
[ROW][C]25[/C][C]0.007649[/C][C]0.0597[/C][C]0.47628[/C][/ROW]
[ROW][C]26[/C][C]-0.108747[/C][C]-0.8493[/C][C]0.800494[/C][/ROW]
[ROW][C]27[/C][C]0.08375[/C][C]0.6541[/C][C]0.257749[/C][/ROW]
[ROW][C]28[/C][C]-0.220244[/C][C]-1.7202[/C][C]0.954764[/C][/ROW]
[ROW][C]29[/C][C]0.045837[/C][C]0.358[/C][C]0.360789[/C][/ROW]
[ROW][C]30[/C][C]-0.000309[/C][C]-0.0024[/C][C]0.500959[/C][/ROW]
[ROW][C]31[/C][C]-0.004352[/C][C]-0.034[/C][C]0.513501[/C][/ROW]
[ROW][C]32[/C][C]0.000353[/C][C]0.0028[/C][C]0.498905[/C][/ROW]
[ROW][C]33[/C][C]0.059956[/C][C]0.4683[/C][C]0.32063[/C][/ROW]
[ROW][C]34[/C][C]-0.104713[/C][C]-0.8178[/C][C]0.791683[/C][/ROW]
[ROW][C]35[/C][C]0.022433[/C][C]0.1752[/C][C]0.430748[/C][/ROW]
[/TABLE]
Source: https://freestatistics.org/blog/index.php?pk=2287&T=2

Globally Unique Identifier (entire table): ba.freestatistics.org/blog/index.php?pk=2287&T=2

As an alternative you can also use a QR Code:  

The GUIDs for individual cells are displayed in the table below:

Partial Autocorrelation Function
Time lag kPACF(k)T-STATP-value
00.5664464.42412e-05
10.1319381.03050.153429
20.3443292.68930.004611
30.1998061.56050.061903
40.1013640.79170.215809
50.2932912.29070.012726
6-0.248276-1.93910.97144
70.2621242.04730.022474
8-0.281235-2.19650.984067
9-0.269301-2.10330.980215
100.260872.03750.022974
110.3114692.43270.008968
12-0.283189-2.21180.984631
13-0.068154-0.53230.701773
14-0.130898-1.02230.844673
15-0.07501-0.58580.719929
16-0.051057-0.39880.654272
17-0.039388-0.30760.620296
180.0431020.33660.368774
19-0.159325-1.24440.890938
200.0221050.17260.43175
21-0.047467-0.37070.643938
220.1247550.97440.166862
23-0.047218-0.36880.643217
240.0091010.07110.471783
250.0076490.05970.47628
26-0.108747-0.84930.800494
270.083750.65410.257749
28-0.220244-1.72020.954764
290.0458370.3580.360789
30-0.000309-0.00240.500959
31-0.004352-0.0340.513501
320.0003530.00280.498905
330.0599560.46830.32063
34-0.104713-0.81780.791683
350.0224330.17520.430748


Parameters (Session):
par1 = 36 ; par2 = 1 ; par3 = 0 ; par4 = 0 ; par5 = 12 ;
Parameters (R input):
par1 = 36 ; par2 = 1 ; par3 = 0 ; par4 = 0 ; par5 = 12 ;
R code (references can be found in the software module):
if (par1 == 'Default') {
par1 = 10*log10(length(x))
} else {
par1 <- as.numeric(par1)
}
par2 <- as.numeric(par2)
par3 <- as.numeric(par3)
par4 <- as.numeric(par4)
par5 <- as.numeric(par5)
if (par2 == 0) {
x <- log(x)
} else {
x <- (x ^ par2 - 1) / par2
}
if (par3 > 0) x <- diff(x,lag=1,difference=par3)
if (par4 > 0) x <- diff(x,lag=par5,difference=par4)
bitmap(file='pic1.png')
racf <- acf(x,par1,main='Autocorrelation',xlab='lags',ylab='ACF')
dev.off()
bitmap(file='pic2.png')
rpacf <- pacf(x,par1,main='Partial Autocorrelation',xlab='lags',ylab='PACF')
dev.off()
(myacf <- c(racf$acf))
(mypacf <- c(rpacf$acf))
lengthx <- length(x)
sqrtn <- sqrt(lengthx)
load(file='createtable')
a<-table.start()
a<-table.row.start(a)
a<-table.element(a,'Autocorrelation Function',4,TRUE)
a<-table.row.end(a)
a<-table.row.start(a)
a<-table.element(a,'Time lag k',header=TRUE)
a<-table.element(a,hyperlink('basics.htm','ACF(k)','click here for more information about the Autocorrelation Function'),header=TRUE)
a<-table.element(a,'T-STAT',header=TRUE)
a<-table.element(a,'P-value',header=TRUE)
a<-table.row.end(a)
for (i in 1:par1) {
a<-table.row.start(a)
a<-table.element(a,i-1,header=TRUE)
a<-table.element(a,round(myacf[i],6))
mytstat <- myacf[i]*sqrtn
a<-table.element(a,round(mytstat,4))
a<-table.element(a,round(1-pt(mytstat,lengthx),6))
a<-table.row.end(a)
}
a<-table.end(a)
table.save(a,file='mytable.tab')
a<-table.start()
a<-table.row.start(a)
a<-table.element(a,'Partial Autocorrelation Function',4,TRUE)
a<-table.row.end(a)
a<-table.row.start(a)
a<-table.element(a,'Time lag k',header=TRUE)
a<-table.element(a,hyperlink('basics.htm','PACF(k)','click here for more information about the Partial Autocorrelation Function'),header=TRUE)
a<-table.element(a,'T-STAT',header=TRUE)
a<-table.element(a,'P-value',header=TRUE)
a<-table.row.end(a)
for (i in 1:par1) {
a<-table.row.start(a)
a<-table.element(a,i-1,header=TRUE)
a<-table.element(a,round(mypacf[i],6))
mytstat <- mypacf[i]*sqrtn
a<-table.element(a,round(mytstat,4))
a<-table.element(a,round(1-pt(mytstat,lengthx),6))
a<-table.row.end(a)
}
a<-table.end(a)
table.save(a,file='mytable1.tab')