Free Statistics

of Irreproducible Research!

Author's title

Author*Unverified author*
R Software Modulerwasp_multipleregression.wasp
Title produced by softwareMultiple Regression
Date of computationSun, 02 Dec 2007 04:37:30 -0700
Cite this page as followsStatistical Computations at FreeStatistics.org, Office for Research Development and Education, URL https://freestatistics.org/blog/index.php?v=date/2007/Dec/02/t1196594920e26p5rf3axsgwsr.htm/, Retrieved Sun, 28 Apr 2024 10:31:30 +0000
Statistical Computations at FreeStatistics.org, Office for Research Development and Education, URL https://freestatistics.org/blog/index.php?pk=2276, Retrieved Sun, 28 Apr 2024 10:31:30 +0000
QR Codes:

Original text written by user:Multiple Linear Regression
IsPrivate?No (this computation is public)
User-defined keywordsMultiple Linear Regression
Estimated Impact277
Family? (F = Feedback message, R = changed R code, M = changed R Module, P = changed Parameters, D = changed Data)
-       [Multiple Regression] [Multiple Linear R...] [2007-12-02 11:37:30] [d41d8cd98f00b204e9800998ecf8427e] [Current]
Feedback Forum

Post a new message
Dataseries X:
100.6	115.9	59.7	125
96.1	112.9	58.2	121.7
110	126.3	75.3	134.3
108.2	116.8	69	124.3
106.9	112	66.1	119.1
117.2	129.7	77.5	137.8
105.2	113.6	69.3	120.5
106.3	115.7	70.2	122.7
95.9	119.5	70.2	127.2
107.5	125.8	78.2	133.2
113	129.6	85.4	136.3
111.4	128	82.4	134.9
95.5	112.8	61.2	120.9
90.3	101.6	52.2	109.4
110.8	123.9	85.3	129.6
107.1	118.8	79.9	124.7
101.4	109.1	72.2	114.6
112.9	130.6	85.7	137.4
98.5	112.4	75.5	117.9
100.1	111	69.2	117.4
93.4	116.2	77.6	122
104.4	119.8	85.3	124.8
101.8	117.2	77	123.3
107.9	127.3	89.9	132.8
91.3	107.7	60	115.1
86.6	97.5	54.3	104.2
111.4	120.1	84	125.5
98.4	110.6	69.9	116.8
102.2	111.3	75.1	116.8
103	119.8	81.7	125.5
95.8	105.5	69.9	110.9
96	108.7	68.3	114.9
95.7	128.7	77.3	136.4
106.4	119.5	77.4	125.8
112	121.1	85.3	126.5
116.2	128.4	91	134
93.9	108.8	60.6	116.1
100.5	107.5	57.6	115
112.5	125.6	93.8	130.3
101.2	102.9	78.7	106.5
107.8	107.5	80.3	111.6
114.3	120.4	89.8	125
99.6	104.3	77.5	108.3
98.6	100.6	71.7	105
93.6	121.9	83.2	127.4
99.6	112.7	86.2	116.6
113.1	124.9	100.7	128.6
110.7	123.9	100.8	127.5
88.1	102.2	57.1	108.4
93.1	104.9	62.5	110.8
107.4	109.8	79.7	114.2
99.5	98.9	80.3	101.8
105.6	107.3	92.4	109.8
108.3	112.6	91.8	115.9
99.2	104	85.8	106.9
99.3	110.6	84.2	114.6
107.1	100.8	93.1	105.4
106.9	103.8	101.2	108.1
115.4	117	100.6	118.4
99	108.4	106.7	112.7
100.1	95.5	64	98.4
96.2	96.9	67.5	99.6
96.9	103.9	101	103.9
96.2	101.1	95.5	101.5
91	100.6	97	100.8
99	104.3	103.8	104.5
99	98	95.2	98.2
107.2	99.5	86.7	99.9
110.8	97.4	93.5	97.5
111.1	105.6	102.5	105.7
104.6	117.5	112.3	117.7
94.3	107.4	105.5	107.4
90.7	97.8	75.4	98.4
88.8	91.5	70.4	92
90.9	107.7	108	107.7
90.5	100.1	100	100.2
95.5	96.6	93.3	96.7
103.1	106.8	111.1	106.8
100.6	98	101.1	98
103.1	98.6	98.1	98.6


Summary of compuational transaction
Raw Inputview raw input (R code)
Raw Outputview raw output of R engine
Computing time3 seconds
R Server'Gwilym Jenkins' @ 72.249.127.135

\begin{tabular}{lllllllll}
\hline
Summary of compuational transaction \tabularnewline
Raw Input & view raw input (R code)  \tabularnewline
Raw Output & view raw output of R engine  \tabularnewline
Computing time & 3 seconds \tabularnewline
R Server & 'Gwilym Jenkins' @ 72.249.127.135 \tabularnewline
\hline
\end{tabular}
%Source: https://freestatistics.org/blog/index.php?pk=2276&T=0

[TABLE]
[ROW][C]Summary of compuational transaction[/C][/ROW]
[ROW][C]Raw Input[/C][C]view raw input (R code) [/C][/ROW]
[ROW][C]Raw Output[/C][C]view raw output of R engine [/C][/ROW]
[ROW][C]Computing time[/C][C]3 seconds[/C][/ROW]
[ROW][C]R Server[/C][C]'Gwilym Jenkins' @ 72.249.127.135[/C][/ROW]
[/TABLE]
Source: https://freestatistics.org/blog/index.php?pk=2276&T=0

Globally Unique Identifier (entire table): ba.freestatistics.org/blog/index.php?pk=2276&T=0

As an alternative you can also use a QR Code:  

The GUIDs for individual cells are displayed in the table below:

Summary of compuational transaction
Raw Inputview raw input (R code)
Raw Outputview raw output of R engine
Computing time3 seconds
R Server'Gwilym Jenkins' @ 72.249.127.135


Multiple Linear Regression - Estimated Regression Equation
1[t] = + 53.2368533361207 + 0.761056250969949`2`[t] + 0.217444956801800`3`[t] -0.423766010526483`4 `[t] -0.115859441483030t + e[t]

\begin{tabular}{lllllllll}
\hline
Multiple Linear Regression - Estimated Regression Equation \tabularnewline
1[t] =  +  53.2368533361207 +  0.761056250969949`2`[t] +  0.217444956801800`3`[t] -0.423766010526483`4
`[t] -0.115859441483030t  + e[t] \tabularnewline
\hline
\end{tabular}
%Source: https://freestatistics.org/blog/index.php?pk=2276&T=1

[TABLE]
[ROW][C]Multiple Linear Regression - Estimated Regression Equation[/C][/ROW]
[ROW][C]1[t] =  +  53.2368533361207 +  0.761056250969949`2`[t] +  0.217444956801800`3`[t] -0.423766010526483`4
`[t] -0.115859441483030t  + e[t][/C][/ROW]
[/TABLE]
Source: https://freestatistics.org/blog/index.php?pk=2276&T=1

Globally Unique Identifier (entire table): ba.freestatistics.org/blog/index.php?pk=2276&T=1

As an alternative you can also use a QR Code:  

The GUIDs for individual cells are displayed in the table below:

Multiple Linear Regression - Estimated Regression Equation
1[t] = + 53.2368533361207 + 0.761056250969949`2`[t] + 0.217444956801800`3`[t] -0.423766010526483`4 `[t] -0.115859441483030t + e[t]


Multiple Linear Regression - Ordinary Least Squares
VariableParameterS.D.T-STATH0: parameter = 02-tail p-value1-tail p-value
(Intercept)53.236853336120711.3106524.70681.1e-056e-06
`2`0.7610562509699490.8494750.89590.3731660.186583
`3`0.2174449568018000.1049142.07260.0416460.020823
`4 `-0.4237660105264830.769568-0.55070.5835070.291754
t-0.1158594414830300.072774-1.5920.115580.05779

\begin{tabular}{lllllllll}
\hline
Multiple Linear Regression - Ordinary Least Squares \tabularnewline
Variable & Parameter & S.D. & T-STATH0: parameter = 0 & 2-tail p-value & 1-tail p-value \tabularnewline
(Intercept) & 53.2368533361207 & 11.310652 & 4.7068 & 1.1e-05 & 6e-06 \tabularnewline
`2` & 0.761056250969949 & 0.849475 & 0.8959 & 0.373166 & 0.186583 \tabularnewline
`3` & 0.217444956801800 & 0.104914 & 2.0726 & 0.041646 & 0.020823 \tabularnewline
`4
` & -0.423766010526483 & 0.769568 & -0.5507 & 0.583507 & 0.291754 \tabularnewline
t & -0.115859441483030 & 0.072774 & -1.592 & 0.11558 & 0.05779 \tabularnewline
\hline
\end{tabular}
%Source: https://freestatistics.org/blog/index.php?pk=2276&T=2

[TABLE]
[ROW][C]Multiple Linear Regression - Ordinary Least Squares[/C][/ROW]
[ROW][C]Variable[/C][C]Parameter[/C][C]S.D.[/C][C]T-STATH0: parameter = 0[/C][C]2-tail p-value[/C][C]1-tail p-value[/C][/ROW]
[ROW][C](Intercept)[/C][C]53.2368533361207[/C][C]11.310652[/C][C]4.7068[/C][C]1.1e-05[/C][C]6e-06[/C][/ROW]
[ROW][C]`2`[/C][C]0.761056250969949[/C][C]0.849475[/C][C]0.8959[/C][C]0.373166[/C][C]0.186583[/C][/ROW]
[ROW][C]`3`[/C][C]0.217444956801800[/C][C]0.104914[/C][C]2.0726[/C][C]0.041646[/C][C]0.020823[/C][/ROW]
[ROW][C]`4
`[/C][C]-0.423766010526483[/C][C]0.769568[/C][C]-0.5507[/C][C]0.583507[/C][C]0.291754[/C][/ROW]
[ROW][C]t[/C][C]-0.115859441483030[/C][C]0.072774[/C][C]-1.592[/C][C]0.11558[/C][C]0.05779[/C][/ROW]
[/TABLE]
Source: https://freestatistics.org/blog/index.php?pk=2276&T=2

Globally Unique Identifier (entire table): ba.freestatistics.org/blog/index.php?pk=2276&T=2

As an alternative you can also use a QR Code:  

The GUIDs for individual cells are displayed in the table below:

Multiple Linear Regression - Ordinary Least Squares
VariableParameterS.D.T-STATH0: parameter = 02-tail p-value1-tail p-value
(Intercept)53.236853336120711.3106524.70681.1e-056e-06
`2`0.7610562509699490.8494750.89590.3731660.186583
`3`0.2174449568018000.1049142.07260.0416460.020823
`4 `-0.4237660105264830.769568-0.55070.5835070.291754
t-0.1158594414830300.072774-1.5920.115580.05779


Multiple Linear Regression - Regression Statistics
Multiple R0.692089938519227
R-squared0.478988482999547
Adjusted R-squared0.451201202092857
F-TEST (value)17.2376881569659
F-TEST (DF numerator)4
F-TEST (DF denominator)75
p-value4.56730875342259e-10
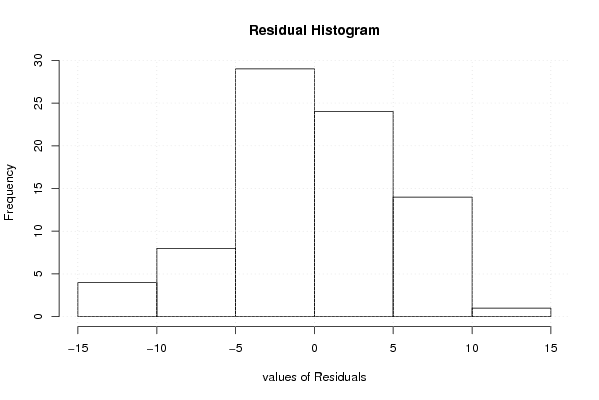
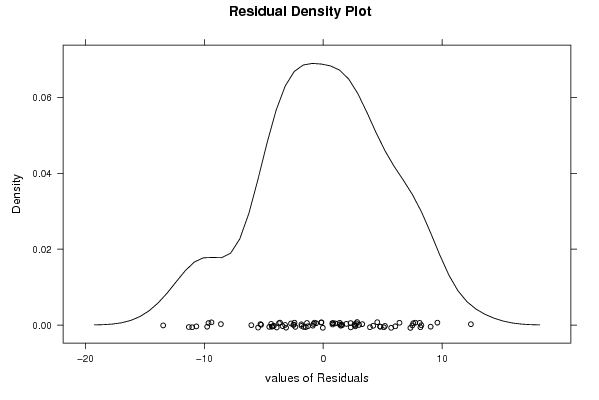
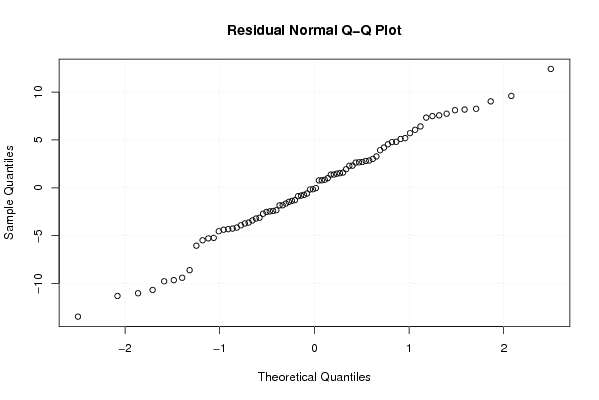
Multiple Linear Regression - Residual Statistics
Residual Standard Deviation5.5816683947729
Sum Squared Residuals2336.62665519050

\begin{tabular}{lllllllll}
\hline
Multiple Linear Regression - Regression Statistics \tabularnewline
Multiple R & 0.692089938519227 \tabularnewline
R-squared & 0.478988482999547 \tabularnewline
Adjusted R-squared & 0.451201202092857 \tabularnewline
F-TEST (value) & 17.2376881569659 \tabularnewline
F-TEST (DF numerator) & 4 \tabularnewline
F-TEST (DF denominator) & 75 \tabularnewline
p-value & 4.56730875342259e-10 \tabularnewline
Multiple Linear Regression - Residual Statistics \tabularnewline
Residual Standard Deviation & 5.5816683947729 \tabularnewline
Sum Squared Residuals & 2336.62665519050 \tabularnewline
\hline
\end{tabular}
%Source: https://freestatistics.org/blog/index.php?pk=2276&T=3

[TABLE]
[ROW][C]Multiple Linear Regression - Regression Statistics[/C][/ROW]
[ROW][C]Multiple R[/C][C]0.692089938519227[/C][/ROW]
[ROW][C]R-squared[/C][C]0.478988482999547[/C][/ROW]
[ROW][C]Adjusted R-squared[/C][C]0.451201202092857[/C][/ROW]
[ROW][C]F-TEST (value)[/C][C]17.2376881569659[/C][/ROW]
[ROW][C]F-TEST (DF numerator)[/C][C]4[/C][/ROW]
[ROW][C]F-TEST (DF denominator)[/C][C]75[/C][/ROW]
[ROW][C]p-value[/C][C]4.56730875342259e-10[/C][/ROW]
[ROW][C]Multiple Linear Regression - Residual Statistics[/C][/ROW]
[ROW][C]Residual Standard Deviation[/C][C]5.5816683947729[/C][/ROW]
[ROW][C]Sum Squared Residuals[/C][C]2336.62665519050[/C][/ROW]
[/TABLE]
Source: https://freestatistics.org/blog/index.php?pk=2276&T=3

Globally Unique Identifier (entire table): ba.freestatistics.org/blog/index.php?pk=2276&T=3

As an alternative you can also use a QR Code:  

The GUIDs for individual cells are displayed in the table below:

Multiple Linear Regression - Regression Statistics
Multiple R0.692089938519227
R-squared0.478988482999547
Adjusted R-squared0.451201202092857
F-TEST (value)17.2376881569659
F-TEST (DF numerator)4
F-TEST (DF denominator)75
p-value4.56730875342259e-10
Multiple Linear Regression - Residual Statistics
Residual Standard Deviation5.5816683947729
Sum Squared Residuals2336.62665519050


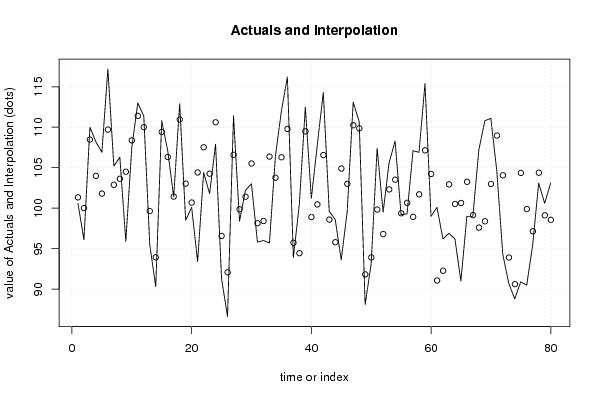
Multiple Linear Regression - Actuals, Interpolation, and Residuals
Time or IndexActualsInterpolationForecastResidualsPrediction Error
1100.6101.338125987312-0.738125987312079
296.1100.011358192454-3.91135819245363
3110108.4725095426451.52749045735504
4108.2103.9943725943614.20562740563907
5106.9101.7984360282355.10156397176537
6117.2109.7077203396157.49227966038502
7105.2102.8869585938492.31304140615083
8106.3103.6327325173662.66726748263360
995.9104.5019397822-8.6019397822
10107.5108.377698313083-0.877698313083153
11113111.4057816816271.59421831837322
12111.4110.0131697829241.38683021707649
1395.599.6521463898699-4.15214638986986
1490.393.9287614473618-3.62876144736176
15110.8109.4218110600131.37818893998678
16107.1106.3268154234330.773184576566506
17101.4101.434420886486-0.0344208864855695
18112.9110.9549127176771.94508728232308
1998.5103.033328154429-4.53332815442889
20100.1100.693969739000-0.59396973899984
2193.4104.412816791274-11.0128167912738
22104.4107.524541191182-3.12454119118232
23101.8104.260791371512-2.46079137151222
24107.9110.610862907567-2.71086290756729
2591.396.5773551250182-5.27735512501821
2686.692.0783351846101-5.47833518461011
27111.4106.5942462078474.80575379215273
2898.499.8691427828248-1.46914278282476
29102.2101.416736492390.783263507609949
30103105.518227607463-2.51822760746306
3195.898.1403970405352-2.34039704053519
329698.4169416291672-2.41694162916718
3395.7106.36824259198-10.6682425919799
34106.4103.7643298488342.63567015116573
35112106.2873393602695.71266063973116
36116.2109.7883817256886.41161827431192
3793.995.7309046668434-1.83090466684338
38100.594.43947984027326.06052015972685
39112.5109.4866260165163.01337398348386
40101.298.89700188083842.30299811916159
41107.8100.4687064710157.33129352898504
42114.3106.5577352156067.7422647843935
4399.698.59118954063741.00881045936258
4498.695.79666905585252.80333094414747
4593.6104.899566127457-11.2995661274569
4699.6103.010996961142-3.41099696114175
47113.1110.2477835288002.8522164711996
48110.7109.8587549436070.841245056393281
4988.191.819561044893-3.71956104489298
5093.193.915717822495-0.815717822494978
51107.499.82828283196567.57171716803441
5299.596.80207575951962.6979242404804
53105.6102.3200447192743.27995528072595
54108.3103.5223437696394.77765623036088
5599.299.370624923742-0.170624923742072
5699.3100.666826526724-1.36682652672391
57107.198.9265232381158.17347676188495
58106.9101.7109684712155.18903152878507
59115.4107.1457946600318.25420533996864
6099104.226731956699-5.22673195669872
61100.191.06820117279529.0317988272048
6296.292.27035861884463.92964138115538
6396.9102.944105141748-6.04410514174764
6496.2100.518379360402-4.31837936040241
6591100.644795436006-9.64479543600565
6699103.255535590416-4.25553559041568
679999.1447210056433-0.144721005643339
68107.297.6017615899059.5982384100951
69110.898.383348152900812.4166518470992
70111.1102.9902732942708.10972670572962
71104.6108.976751689670-4.37675168966958
7294.3104.060388315561-9.7603883155606
7390.793.9071897597702-3.20718975977023
7488.890.621553620537-1.82155362053702
7590.9104.357609455249-13.4576094552490
7690.599.8964079309286-9.39640793092863
7795.597.1431514373214-1.64315143732141
78103.1104.380549280486-1.28054928048642
79100.699.12208615508291.47791384491711
80103.198.55626598746054.54373401253946

\begin{tabular}{lllllllll}
\hline
Multiple Linear Regression - Actuals, Interpolation, and Residuals \tabularnewline
Time or Index & Actuals & InterpolationForecast & ResidualsPrediction Error \tabularnewline
1 & 100.6 & 101.338125987312 & -0.738125987312079 \tabularnewline
2 & 96.1 & 100.011358192454 & -3.91135819245363 \tabularnewline
3 & 110 & 108.472509542645 & 1.52749045735504 \tabularnewline
4 & 108.2 & 103.994372594361 & 4.20562740563907 \tabularnewline
5 & 106.9 & 101.798436028235 & 5.10156397176537 \tabularnewline
6 & 117.2 & 109.707720339615 & 7.49227966038502 \tabularnewline
7 & 105.2 & 102.886958593849 & 2.31304140615083 \tabularnewline
8 & 106.3 & 103.632732517366 & 2.66726748263360 \tabularnewline
9 & 95.9 & 104.5019397822 & -8.6019397822 \tabularnewline
10 & 107.5 & 108.377698313083 & -0.877698313083153 \tabularnewline
11 & 113 & 111.405781681627 & 1.59421831837322 \tabularnewline
12 & 111.4 & 110.013169782924 & 1.38683021707649 \tabularnewline
13 & 95.5 & 99.6521463898699 & -4.15214638986986 \tabularnewline
14 & 90.3 & 93.9287614473618 & -3.62876144736176 \tabularnewline
15 & 110.8 & 109.421811060013 & 1.37818893998678 \tabularnewline
16 & 107.1 & 106.326815423433 & 0.773184576566506 \tabularnewline
17 & 101.4 & 101.434420886486 & -0.0344208864855695 \tabularnewline
18 & 112.9 & 110.954912717677 & 1.94508728232308 \tabularnewline
19 & 98.5 & 103.033328154429 & -4.53332815442889 \tabularnewline
20 & 100.1 & 100.693969739000 & -0.59396973899984 \tabularnewline
21 & 93.4 & 104.412816791274 & -11.0128167912738 \tabularnewline
22 & 104.4 & 107.524541191182 & -3.12454119118232 \tabularnewline
23 & 101.8 & 104.260791371512 & -2.46079137151222 \tabularnewline
24 & 107.9 & 110.610862907567 & -2.71086290756729 \tabularnewline
25 & 91.3 & 96.5773551250182 & -5.27735512501821 \tabularnewline
26 & 86.6 & 92.0783351846101 & -5.47833518461011 \tabularnewline
27 & 111.4 & 106.594246207847 & 4.80575379215273 \tabularnewline
28 & 98.4 & 99.8691427828248 & -1.46914278282476 \tabularnewline
29 & 102.2 & 101.41673649239 & 0.783263507609949 \tabularnewline
30 & 103 & 105.518227607463 & -2.51822760746306 \tabularnewline
31 & 95.8 & 98.1403970405352 & -2.34039704053519 \tabularnewline
32 & 96 & 98.4169416291672 & -2.41694162916718 \tabularnewline
33 & 95.7 & 106.36824259198 & -10.6682425919799 \tabularnewline
34 & 106.4 & 103.764329848834 & 2.63567015116573 \tabularnewline
35 & 112 & 106.287339360269 & 5.71266063973116 \tabularnewline
36 & 116.2 & 109.788381725688 & 6.41161827431192 \tabularnewline
37 & 93.9 & 95.7309046668434 & -1.83090466684338 \tabularnewline
38 & 100.5 & 94.4394798402732 & 6.06052015972685 \tabularnewline
39 & 112.5 & 109.486626016516 & 3.01337398348386 \tabularnewline
40 & 101.2 & 98.8970018808384 & 2.30299811916159 \tabularnewline
41 & 107.8 & 100.468706471015 & 7.33129352898504 \tabularnewline
42 & 114.3 & 106.557735215606 & 7.7422647843935 \tabularnewline
43 & 99.6 & 98.5911895406374 & 1.00881045936258 \tabularnewline
44 & 98.6 & 95.7966690558525 & 2.80333094414747 \tabularnewline
45 & 93.6 & 104.899566127457 & -11.2995661274569 \tabularnewline
46 & 99.6 & 103.010996961142 & -3.41099696114175 \tabularnewline
47 & 113.1 & 110.247783528800 & 2.8522164711996 \tabularnewline
48 & 110.7 & 109.858754943607 & 0.841245056393281 \tabularnewline
49 & 88.1 & 91.819561044893 & -3.71956104489298 \tabularnewline
50 & 93.1 & 93.915717822495 & -0.815717822494978 \tabularnewline
51 & 107.4 & 99.8282828319656 & 7.57171716803441 \tabularnewline
52 & 99.5 & 96.8020757595196 & 2.6979242404804 \tabularnewline
53 & 105.6 & 102.320044719274 & 3.27995528072595 \tabularnewline
54 & 108.3 & 103.522343769639 & 4.77765623036088 \tabularnewline
55 & 99.2 & 99.370624923742 & -0.170624923742072 \tabularnewline
56 & 99.3 & 100.666826526724 & -1.36682652672391 \tabularnewline
57 & 107.1 & 98.926523238115 & 8.17347676188495 \tabularnewline
58 & 106.9 & 101.710968471215 & 5.18903152878507 \tabularnewline
59 & 115.4 & 107.145794660031 & 8.25420533996864 \tabularnewline
60 & 99 & 104.226731956699 & -5.22673195669872 \tabularnewline
61 & 100.1 & 91.0682011727952 & 9.0317988272048 \tabularnewline
62 & 96.2 & 92.2703586188446 & 3.92964138115538 \tabularnewline
63 & 96.9 & 102.944105141748 & -6.04410514174764 \tabularnewline
64 & 96.2 & 100.518379360402 & -4.31837936040241 \tabularnewline
65 & 91 & 100.644795436006 & -9.64479543600565 \tabularnewline
66 & 99 & 103.255535590416 & -4.25553559041568 \tabularnewline
67 & 99 & 99.1447210056433 & -0.144721005643339 \tabularnewline
68 & 107.2 & 97.601761589905 & 9.5982384100951 \tabularnewline
69 & 110.8 & 98.3833481529008 & 12.4166518470992 \tabularnewline
70 & 111.1 & 102.990273294270 & 8.10972670572962 \tabularnewline
71 & 104.6 & 108.976751689670 & -4.37675168966958 \tabularnewline
72 & 94.3 & 104.060388315561 & -9.7603883155606 \tabularnewline
73 & 90.7 & 93.9071897597702 & -3.20718975977023 \tabularnewline
74 & 88.8 & 90.621553620537 & -1.82155362053702 \tabularnewline
75 & 90.9 & 104.357609455249 & -13.4576094552490 \tabularnewline
76 & 90.5 & 99.8964079309286 & -9.39640793092863 \tabularnewline
77 & 95.5 & 97.1431514373214 & -1.64315143732141 \tabularnewline
78 & 103.1 & 104.380549280486 & -1.28054928048642 \tabularnewline
79 & 100.6 & 99.1220861550829 & 1.47791384491711 \tabularnewline
80 & 103.1 & 98.5562659874605 & 4.54373401253946 \tabularnewline
\hline
\end{tabular}
%Source: https://freestatistics.org/blog/index.php?pk=2276&T=4

[TABLE]
[ROW][C]Multiple Linear Regression - Actuals, Interpolation, and Residuals[/C][/ROW]
[ROW][C]Time or Index[/C][C]Actuals[/C][C]InterpolationForecast[/C][C]ResidualsPrediction Error[/C][/ROW]
[ROW][C]1[/C][C]100.6[/C][C]101.338125987312[/C][C]-0.738125987312079[/C][/ROW]
[ROW][C]2[/C][C]96.1[/C][C]100.011358192454[/C][C]-3.91135819245363[/C][/ROW]
[ROW][C]3[/C][C]110[/C][C]108.472509542645[/C][C]1.52749045735504[/C][/ROW]
[ROW][C]4[/C][C]108.2[/C][C]103.994372594361[/C][C]4.20562740563907[/C][/ROW]
[ROW][C]5[/C][C]106.9[/C][C]101.798436028235[/C][C]5.10156397176537[/C][/ROW]
[ROW][C]6[/C][C]117.2[/C][C]109.707720339615[/C][C]7.49227966038502[/C][/ROW]
[ROW][C]7[/C][C]105.2[/C][C]102.886958593849[/C][C]2.31304140615083[/C][/ROW]
[ROW][C]8[/C][C]106.3[/C][C]103.632732517366[/C][C]2.66726748263360[/C][/ROW]
[ROW][C]9[/C][C]95.9[/C][C]104.5019397822[/C][C]-8.6019397822[/C][/ROW]
[ROW][C]10[/C][C]107.5[/C][C]108.377698313083[/C][C]-0.877698313083153[/C][/ROW]
[ROW][C]11[/C][C]113[/C][C]111.405781681627[/C][C]1.59421831837322[/C][/ROW]
[ROW][C]12[/C][C]111.4[/C][C]110.013169782924[/C][C]1.38683021707649[/C][/ROW]
[ROW][C]13[/C][C]95.5[/C][C]99.6521463898699[/C][C]-4.15214638986986[/C][/ROW]
[ROW][C]14[/C][C]90.3[/C][C]93.9287614473618[/C][C]-3.62876144736176[/C][/ROW]
[ROW][C]15[/C][C]110.8[/C][C]109.421811060013[/C][C]1.37818893998678[/C][/ROW]
[ROW][C]16[/C][C]107.1[/C][C]106.326815423433[/C][C]0.773184576566506[/C][/ROW]
[ROW][C]17[/C][C]101.4[/C][C]101.434420886486[/C][C]-0.0344208864855695[/C][/ROW]
[ROW][C]18[/C][C]112.9[/C][C]110.954912717677[/C][C]1.94508728232308[/C][/ROW]
[ROW][C]19[/C][C]98.5[/C][C]103.033328154429[/C][C]-4.53332815442889[/C][/ROW]
[ROW][C]20[/C][C]100.1[/C][C]100.693969739000[/C][C]-0.59396973899984[/C][/ROW]
[ROW][C]21[/C][C]93.4[/C][C]104.412816791274[/C][C]-11.0128167912738[/C][/ROW]
[ROW][C]22[/C][C]104.4[/C][C]107.524541191182[/C][C]-3.12454119118232[/C][/ROW]
[ROW][C]23[/C][C]101.8[/C][C]104.260791371512[/C][C]-2.46079137151222[/C][/ROW]
[ROW][C]24[/C][C]107.9[/C][C]110.610862907567[/C][C]-2.71086290756729[/C][/ROW]
[ROW][C]25[/C][C]91.3[/C][C]96.5773551250182[/C][C]-5.27735512501821[/C][/ROW]
[ROW][C]26[/C][C]86.6[/C][C]92.0783351846101[/C][C]-5.47833518461011[/C][/ROW]
[ROW][C]27[/C][C]111.4[/C][C]106.594246207847[/C][C]4.80575379215273[/C][/ROW]
[ROW][C]28[/C][C]98.4[/C][C]99.8691427828248[/C][C]-1.46914278282476[/C][/ROW]
[ROW][C]29[/C][C]102.2[/C][C]101.41673649239[/C][C]0.783263507609949[/C][/ROW]
[ROW][C]30[/C][C]103[/C][C]105.518227607463[/C][C]-2.51822760746306[/C][/ROW]
[ROW][C]31[/C][C]95.8[/C][C]98.1403970405352[/C][C]-2.34039704053519[/C][/ROW]
[ROW][C]32[/C][C]96[/C][C]98.4169416291672[/C][C]-2.41694162916718[/C][/ROW]
[ROW][C]33[/C][C]95.7[/C][C]106.36824259198[/C][C]-10.6682425919799[/C][/ROW]
[ROW][C]34[/C][C]106.4[/C][C]103.764329848834[/C][C]2.63567015116573[/C][/ROW]
[ROW][C]35[/C][C]112[/C][C]106.287339360269[/C][C]5.71266063973116[/C][/ROW]
[ROW][C]36[/C][C]116.2[/C][C]109.788381725688[/C][C]6.41161827431192[/C][/ROW]
[ROW][C]37[/C][C]93.9[/C][C]95.7309046668434[/C][C]-1.83090466684338[/C][/ROW]
[ROW][C]38[/C][C]100.5[/C][C]94.4394798402732[/C][C]6.06052015972685[/C][/ROW]
[ROW][C]39[/C][C]112.5[/C][C]109.486626016516[/C][C]3.01337398348386[/C][/ROW]
[ROW][C]40[/C][C]101.2[/C][C]98.8970018808384[/C][C]2.30299811916159[/C][/ROW]
[ROW][C]41[/C][C]107.8[/C][C]100.468706471015[/C][C]7.33129352898504[/C][/ROW]
[ROW][C]42[/C][C]114.3[/C][C]106.557735215606[/C][C]7.7422647843935[/C][/ROW]
[ROW][C]43[/C][C]99.6[/C][C]98.5911895406374[/C][C]1.00881045936258[/C][/ROW]
[ROW][C]44[/C][C]98.6[/C][C]95.7966690558525[/C][C]2.80333094414747[/C][/ROW]
[ROW][C]45[/C][C]93.6[/C][C]104.899566127457[/C][C]-11.2995661274569[/C][/ROW]
[ROW][C]46[/C][C]99.6[/C][C]103.010996961142[/C][C]-3.41099696114175[/C][/ROW]
[ROW][C]47[/C][C]113.1[/C][C]110.247783528800[/C][C]2.8522164711996[/C][/ROW]
[ROW][C]48[/C][C]110.7[/C][C]109.858754943607[/C][C]0.841245056393281[/C][/ROW]
[ROW][C]49[/C][C]88.1[/C][C]91.819561044893[/C][C]-3.71956104489298[/C][/ROW]
[ROW][C]50[/C][C]93.1[/C][C]93.915717822495[/C][C]-0.815717822494978[/C][/ROW]
[ROW][C]51[/C][C]107.4[/C][C]99.8282828319656[/C][C]7.57171716803441[/C][/ROW]
[ROW][C]52[/C][C]99.5[/C][C]96.8020757595196[/C][C]2.6979242404804[/C][/ROW]
[ROW][C]53[/C][C]105.6[/C][C]102.320044719274[/C][C]3.27995528072595[/C][/ROW]
[ROW][C]54[/C][C]108.3[/C][C]103.522343769639[/C][C]4.77765623036088[/C][/ROW]
[ROW][C]55[/C][C]99.2[/C][C]99.370624923742[/C][C]-0.170624923742072[/C][/ROW]
[ROW][C]56[/C][C]99.3[/C][C]100.666826526724[/C][C]-1.36682652672391[/C][/ROW]
[ROW][C]57[/C][C]107.1[/C][C]98.926523238115[/C][C]8.17347676188495[/C][/ROW]
[ROW][C]58[/C][C]106.9[/C][C]101.710968471215[/C][C]5.18903152878507[/C][/ROW]
[ROW][C]59[/C][C]115.4[/C][C]107.145794660031[/C][C]8.25420533996864[/C][/ROW]
[ROW][C]60[/C][C]99[/C][C]104.226731956699[/C][C]-5.22673195669872[/C][/ROW]
[ROW][C]61[/C][C]100.1[/C][C]91.0682011727952[/C][C]9.0317988272048[/C][/ROW]
[ROW][C]62[/C][C]96.2[/C][C]92.2703586188446[/C][C]3.92964138115538[/C][/ROW]
[ROW][C]63[/C][C]96.9[/C][C]102.944105141748[/C][C]-6.04410514174764[/C][/ROW]
[ROW][C]64[/C][C]96.2[/C][C]100.518379360402[/C][C]-4.31837936040241[/C][/ROW]
[ROW][C]65[/C][C]91[/C][C]100.644795436006[/C][C]-9.64479543600565[/C][/ROW]
[ROW][C]66[/C][C]99[/C][C]103.255535590416[/C][C]-4.25553559041568[/C][/ROW]
[ROW][C]67[/C][C]99[/C][C]99.1447210056433[/C][C]-0.144721005643339[/C][/ROW]
[ROW][C]68[/C][C]107.2[/C][C]97.601761589905[/C][C]9.5982384100951[/C][/ROW]
[ROW][C]69[/C][C]110.8[/C][C]98.3833481529008[/C][C]12.4166518470992[/C][/ROW]
[ROW][C]70[/C][C]111.1[/C][C]102.990273294270[/C][C]8.10972670572962[/C][/ROW]
[ROW][C]71[/C][C]104.6[/C][C]108.976751689670[/C][C]-4.37675168966958[/C][/ROW]
[ROW][C]72[/C][C]94.3[/C][C]104.060388315561[/C][C]-9.7603883155606[/C][/ROW]
[ROW][C]73[/C][C]90.7[/C][C]93.9071897597702[/C][C]-3.20718975977023[/C][/ROW]
[ROW][C]74[/C][C]88.8[/C][C]90.621553620537[/C][C]-1.82155362053702[/C][/ROW]
[ROW][C]75[/C][C]90.9[/C][C]104.357609455249[/C][C]-13.4576094552490[/C][/ROW]
[ROW][C]76[/C][C]90.5[/C][C]99.8964079309286[/C][C]-9.39640793092863[/C][/ROW]
[ROW][C]77[/C][C]95.5[/C][C]97.1431514373214[/C][C]-1.64315143732141[/C][/ROW]
[ROW][C]78[/C][C]103.1[/C][C]104.380549280486[/C][C]-1.28054928048642[/C][/ROW]
[ROW][C]79[/C][C]100.6[/C][C]99.1220861550829[/C][C]1.47791384491711[/C][/ROW]
[ROW][C]80[/C][C]103.1[/C][C]98.5562659874605[/C][C]4.54373401253946[/C][/ROW]
[/TABLE]
Source: https://freestatistics.org/blog/index.php?pk=2276&T=4

Globally Unique Identifier (entire table): ba.freestatistics.org/blog/index.php?pk=2276&T=4

As an alternative you can also use a QR Code:  

The GUIDs for individual cells are displayed in the table below:

Multiple Linear Regression - Actuals, Interpolation, and Residuals
Time or IndexActualsInterpolationForecastResidualsPrediction Error
1100.6101.338125987312-0.738125987312079
296.1100.011358192454-3.91135819245363
3110108.4725095426451.52749045735504
4108.2103.9943725943614.20562740563907
5106.9101.7984360282355.10156397176537
6117.2109.7077203396157.49227966038502
7105.2102.8869585938492.31304140615083
8106.3103.6327325173662.66726748263360
995.9104.5019397822-8.6019397822
10107.5108.377698313083-0.877698313083153
11113111.4057816816271.59421831837322
12111.4110.0131697829241.38683021707649
1395.599.6521463898699-4.15214638986986
1490.393.9287614473618-3.62876144736176
15110.8109.4218110600131.37818893998678
16107.1106.3268154234330.773184576566506
17101.4101.434420886486-0.0344208864855695
18112.9110.9549127176771.94508728232308
1998.5103.033328154429-4.53332815442889
20100.1100.693969739000-0.59396973899984
2193.4104.412816791274-11.0128167912738
22104.4107.524541191182-3.12454119118232
23101.8104.260791371512-2.46079137151222
24107.9110.610862907567-2.71086290756729
2591.396.5773551250182-5.27735512501821
2686.692.0783351846101-5.47833518461011
27111.4106.5942462078474.80575379215273
2898.499.8691427828248-1.46914278282476
29102.2101.416736492390.783263507609949
30103105.518227607463-2.51822760746306
3195.898.1403970405352-2.34039704053519
329698.4169416291672-2.41694162916718
3395.7106.36824259198-10.6682425919799
34106.4103.7643298488342.63567015116573
35112106.2873393602695.71266063973116
36116.2109.7883817256886.41161827431192
3793.995.7309046668434-1.83090466684338
38100.594.43947984027326.06052015972685
39112.5109.4866260165163.01337398348386
40101.298.89700188083842.30299811916159
41107.8100.4687064710157.33129352898504
42114.3106.5577352156067.7422647843935
4399.698.59118954063741.00881045936258
4498.695.79666905585252.80333094414747
4593.6104.899566127457-11.2995661274569
4699.6103.010996961142-3.41099696114175
47113.1110.2477835288002.8522164711996
48110.7109.8587549436070.841245056393281
4988.191.819561044893-3.71956104489298
5093.193.915717822495-0.815717822494978
51107.499.82828283196567.57171716803441
5299.596.80207575951962.6979242404804
53105.6102.3200447192743.27995528072595
54108.3103.5223437696394.77765623036088
5599.299.370624923742-0.170624923742072
5699.3100.666826526724-1.36682652672391
57107.198.9265232381158.17347676188495
58106.9101.7109684712155.18903152878507
59115.4107.1457946600318.25420533996864
6099104.226731956699-5.22673195669872
61100.191.06820117279529.0317988272048
6296.292.27035861884463.92964138115538
6396.9102.944105141748-6.04410514174764
6496.2100.518379360402-4.31837936040241
6591100.644795436006-9.64479543600565
6699103.255535590416-4.25553559041568
679999.1447210056433-0.144721005643339
68107.297.6017615899059.5982384100951
69110.898.383348152900812.4166518470992
70111.1102.9902732942708.10972670572962
71104.6108.976751689670-4.37675168966958
7294.3104.060388315561-9.7603883155606
7390.793.9071897597702-3.20718975977023
7488.890.621553620537-1.82155362053702
7590.9104.357609455249-13.4576094552490
7690.599.8964079309286-9.39640793092863
7795.597.1431514373214-1.64315143732141
78103.1104.380549280486-1.28054928048642
79100.699.12208615508291.47791384491711
80103.198.55626598746054.54373401253946


Parameters (Session):
par1 = 1 ; par2 = Do not include Seasonal Dummies ; par3 = Linear Trend ;
Parameters (R input):
par1 = 1 ; par2 = Do not include Seasonal Dummies ; par3 = Linear Trend ;
R code (references can be found in the software module):
library(lattice)
par1 <- as.numeric(par1)
x <- t(y)
k <- length(x[1,])
n <- length(x[,1])
x1 <- cbind(x[,par1], x[,1:k!=par1])
mycolnames <- c(colnames(x)[par1], colnames(x)[1:k!=par1])
colnames(x1) <- mycolnames #colnames(x)[par1]
x <- x1
if (par3 == 'First Differences'){
x2 <- array(0, dim=c(n-1,k), dimnames=list(1:(n-1), paste('(1-B)',colnames(x),sep='')))
for (i in 1:n-1) {
for (j in 1:k) {
x2[i,j] <- x[i+1,j] - x[i,j]
}
}
x <- x2
}
if (par2 == 'Include Monthly Dummies'){
x2 <- array(0, dim=c(n,11), dimnames=list(1:n, paste('M', seq(1:11), sep ='')))
for (i in 1:11){
x2[seq(i,n,12),i] <- 1
}
x <- cbind(x, x2)
}
if (par2 == 'Include Quarterly Dummies'){
x2 <- array(0, dim=c(n,3), dimnames=list(1:n, paste('Q', seq(1:3), sep ='')))
for (i in 1:3){
x2[seq(i,n,4),i] <- 1
}
x <- cbind(x, x2)
}
k <- length(x[1,])
if (par3 == 'Linear Trend'){
x <- cbind(x, c(1:n))
colnames(x)[k+1] <- 't'
}
x
k <- length(x[1,])
df <- as.data.frame(x)
(mylm <- lm(df))
(mysum <- summary(mylm))
bitmap(file='test0.png')
plot(x[,1], type='l', main='Actuals and Interpolation', ylab='value of Actuals and Interpolation (dots)', xlab='time or index')
points(x[,1]-mysum$resid)
grid()
dev.off()
bitmap(file='test1.png')
plot(mysum$resid, type='b', pch=19, main='Residuals', ylab='value of Residuals', xlab='time or index')
grid()
dev.off()
bitmap(file='test2.png')
hist(mysum$resid, main='Residual Histogram', xlab='values of Residuals')
grid()
dev.off()
bitmap(file='test3.png')
densityplot(~mysum$resid,col='black',main='Residual Density Plot', xlab='values of Residuals')
dev.off()
bitmap(file='test4.png')
qqnorm(mysum$resid, main='Residual Normal Q-Q Plot')
grid()
dev.off()
(myerror <- as.ts(mysum$resid))
bitmap(file='test5.png')
dum <- cbind(lag(myerror,k=1),myerror)
dum
dum1 <- dum[2:length(myerror),]
dum1
z <- as.data.frame(dum1)
z
plot(z,main=paste('Residual Lag plot, lowess, and regression line'), ylab='values of Residuals', xlab='lagged values of Residuals')
lines(lowess(z))
abline(lm(z))
grid()
dev.off()
bitmap(file='test6.png')
acf(mysum$resid, lag.max=length(mysum$resid)/2, main='Residual Autocorrelation Function')
grid()
dev.off()
bitmap(file='test7.png')
pacf(mysum$resid, lag.max=length(mysum$resid)/2, main='Residual Partial Autocorrelation Function')
grid()
dev.off()
bitmap(file='test8.png')
opar <- par(mfrow = c(2,2), oma = c(0, 0, 1.1, 0))
plot(mylm, las = 1, sub='Residual Diagnostics')
par(opar)
dev.off()
load(file='createtable')
a<-table.start()
a<-table.row.start(a)
a<-table.element(a, 'Multiple Linear Regression - Estimated Regression Equation', 1, TRUE)
a<-table.row.end(a)
myeq <- colnames(x)[1]
myeq <- paste(myeq, '[t] = ', sep='')
for (i in 1:k){
if (mysum$coefficients[i,1] > 0) myeq <- paste(myeq, '+', '')
myeq <- paste(myeq, mysum$coefficients[i,1], sep=' ')
if (rownames(mysum$coefficients)[i] != '(Intercept)') {
myeq <- paste(myeq, rownames(mysum$coefficients)[i], sep='')
if (rownames(mysum$coefficients)[i] != 't') myeq <- paste(myeq, '[t]', sep='')
}
}
myeq <- paste(myeq, ' + e[t]')
a<-table.row.start(a)
a<-table.element(a, myeq)
a<-table.row.end(a)
a<-table.end(a)
table.save(a,file='mytable1.tab')
a<-table.start()
a<-table.row.start(a)
a<-table.element(a,hyperlink('ols1.htm','Multiple Linear Regression - Ordinary Least Squares',''), 6, TRUE)
a<-table.row.end(a)
a<-table.row.start(a)
a<-table.element(a,'Variable',header=TRUE)
a<-table.element(a,'Parameter',header=TRUE)
a<-table.element(a,'S.D.',header=TRUE)
a<-table.element(a,'T-STAT
H0: parameter = 0',header=TRUE)
a<-table.element(a,'2-tail p-value',header=TRUE)
a<-table.element(a,'1-tail p-value',header=TRUE)
a<-table.row.end(a)
for (i in 1:k){
a<-table.row.start(a)
a<-table.element(a,rownames(mysum$coefficients)[i],header=TRUE)
a<-table.element(a,mysum$coefficients[i,1])
a<-table.element(a, round(mysum$coefficients[i,2],6))
a<-table.element(a, round(mysum$coefficients[i,3],4))
a<-table.element(a, round(mysum$coefficients[i,4],6))
a<-table.element(a, round(mysum$coefficients[i,4]/2,6))
a<-table.row.end(a)
}
a<-table.end(a)
table.save(a,file='mytable2.tab')
a<-table.start()
a<-table.row.start(a)
a<-table.element(a, 'Multiple Linear Regression - Regression Statistics', 2, TRUE)
a<-table.row.end(a)
a<-table.row.start(a)
a<-table.element(a, 'Multiple R',1,TRUE)
a<-table.element(a, sqrt(mysum$r.squared))
a<-table.row.end(a)
a<-table.row.start(a)
a<-table.element(a, 'R-squared',1,TRUE)
a<-table.element(a, mysum$r.squared)
a<-table.row.end(a)
a<-table.row.start(a)
a<-table.element(a, 'Adjusted R-squared',1,TRUE)
a<-table.element(a, mysum$adj.r.squared)
a<-table.row.end(a)
a<-table.row.start(a)
a<-table.element(a, 'F-TEST (value)',1,TRUE)
a<-table.element(a, mysum$fstatistic[1])
a<-table.row.end(a)
a<-table.row.start(a)
a<-table.element(a, 'F-TEST (DF numerator)',1,TRUE)
a<-table.element(a, mysum$fstatistic[2])
a<-table.row.end(a)
a<-table.row.start(a)
a<-table.element(a, 'F-TEST (DF denominator)',1,TRUE)
a<-table.element(a, mysum$fstatistic[3])
a<-table.row.end(a)
a<-table.row.start(a)
a<-table.element(a, 'p-value',1,TRUE)
a<-table.element(a, 1-pf(mysum$fstatistic[1],mysum$fstatistic[2],mysum$fstatistic[3]))
a<-table.row.end(a)
a<-table.row.start(a)
a<-table.element(a, 'Multiple Linear Regression - Residual Statistics', 2, TRUE)
a<-table.row.end(a)
a<-table.row.start(a)
a<-table.element(a, 'Residual Standard Deviation',1,TRUE)
a<-table.element(a, mysum$sigma)
a<-table.row.end(a)
a<-table.row.start(a)
a<-table.element(a, 'Sum Squared Residuals',1,TRUE)
a<-table.element(a, sum(myerror*myerror))
a<-table.row.end(a)
a<-table.end(a)
table.save(a,file='mytable3.tab')
a<-table.start()
a<-table.row.start(a)
a<-table.element(a, 'Multiple Linear Regression - Actuals, Interpolation, and Residuals', 4, TRUE)
a<-table.row.end(a)
a<-table.row.start(a)
a<-table.element(a, 'Time or Index', 1, TRUE)
a<-table.element(a, 'Actuals', 1, TRUE)
a<-table.element(a, 'Interpolation
Forecast', 1, TRUE)
a<-table.element(a, 'Residuals
Prediction Error', 1, TRUE)
a<-table.row.end(a)
for (i in 1:n) {
a<-table.row.start(a)
a<-table.element(a,i, 1, TRUE)
a<-table.element(a,x[i])
a<-table.element(a,x[i]-mysum$resid[i])
a<-table.element(a,mysum$resid[i])
a<-table.row.end(a)
}
a<-table.end(a)
table.save(a,file='mytable4.tab')