Free Statistics

of Irreproducible Research!

Author's title

Author*Unverified author*
R Software Modulerwasp_autocorrelation.wasp
Title produced by software(Partial) Autocorrelation Function
Date of computationSat, 01 Dec 2007 07:00:33 -0700
Cite this page as followsStatistical Computations at FreeStatistics.org, Office for Research Development and Education, URL https://freestatistics.org/blog/index.php?v=date/2007/Dec/01/t1196517000u406sel914tc3rg.htm/, Retrieved Sun, 19 May 2024 16:59:42 +0000
Statistical Computations at FreeStatistics.org, Office for Research Development and Education, URL https://freestatistics.org/blog/index.php?pk=2257, Retrieved Sun, 19 May 2024 16:59:42 +0000
QR Codes:

Original text written by user:
IsPrivate?No (this computation is public)
User-defined keywords
Estimated Impact188
Family? (F = Feedback message, R = changed R code, M = changed R Module, P = changed Parameters, D = changed Data)
-       [(Partial) Autocorrelation Function] [] [2007-12-01 14:00:33] [22d719c250b0837edaa2d173fd414084] [Current]
Feedback Forum

Post a new message
Dataseries X:
99.5
101.6
103.9
106.6
108.3
102
93.8
91.6
97.7
94.8
98
103.8
97.8
91.2
89.3
87.5
90.4
94.2
102.2
101.3
96
90.8
93.2
90.9
91.1
90.2
94.3
96
99
103.3
113.1
112.8
112.1
107.4
111
110.5
110.8
112.4
111.5
116.2
122.5
121.3
113.9
110.7
120.8
141.1
147.4
148
158.1
165
187
190.3
182.4
168.8
151.2
120.1
112.5
106.2
107.1
108.5
106.5
108.3
125.6
124
127.2
136.9
135.8
124.3
115.4
113.6
114.4
118.4
117
116.5
115.4
113.6
117.4
116.9
116.4
111.1
110.2
118.9
131.8
130.6
138.3
148.4
148.7
144.3
152.5
162.9
167.2
166.5
185.6


Summary of compuational transaction
Raw Inputview raw input (R code)
Raw Outputview raw output of R engine
Computing time2 seconds
R Server'Gwilym Jenkins' @ 72.249.127.135

\begin{tabular}{lllllllll}
\hline
Summary of compuational transaction \tabularnewline
Raw Input & view raw input (R code)  \tabularnewline
Raw Output & view raw output of R engine  \tabularnewline
Computing time & 2 seconds \tabularnewline
R Server & 'Gwilym Jenkins' @ 72.249.127.135 \tabularnewline
\hline
\end{tabular}
%Source: https://freestatistics.org/blog/index.php?pk=2257&T=0

[TABLE]
[ROW][C]Summary of compuational transaction[/C][/ROW]
[ROW][C]Raw Input[/C][C]view raw input (R code) [/C][/ROW]
[ROW][C]Raw Output[/C][C]view raw output of R engine [/C][/ROW]
[ROW][C]Computing time[/C][C]2 seconds[/C][/ROW]
[ROW][C]R Server[/C][C]'Gwilym Jenkins' @ 72.249.127.135[/C][/ROW]
[/TABLE]
Source: https://freestatistics.org/blog/index.php?pk=2257&T=0

Globally Unique Identifier (entire table): ba.freestatistics.org/blog/index.php?pk=2257&T=0

As an alternative you can also use a QR Code:  

The GUIDs for individual cells are displayed in the table below:

Summary of compuational transaction
Raw Inputview raw input (R code)
Raw Outputview raw output of R engine
Computing time2 seconds
R Server'Gwilym Jenkins' @ 72.249.127.135


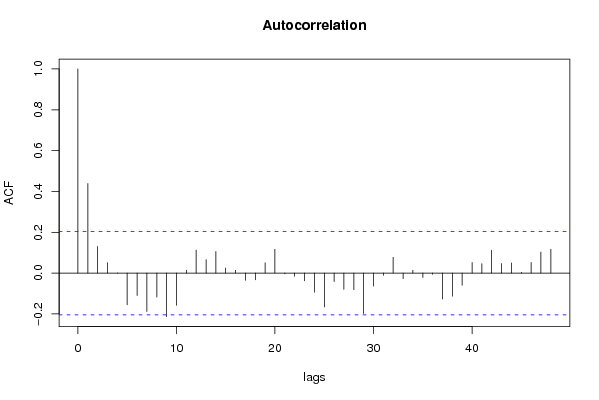
Autocorrelation Function
Time lag kACF(k)T-STATP-value
019.59170
10.4388224.2093e-05
20.1297321.24430.108267
30.0508360.48760.313497
4-0.001357-0.0130.505177
5-0.155528-1.49180.93041
6-0.109264-1.0480.851313
7-0.187642-1.79980.962415
8-0.117786-1.12980.869244
9-0.213469-2.04750.978271
10-0.158162-1.5170.933657
110.0140760.1350.446448
120.1125781.07980.141524
130.0653410.62670.266193
140.1055921.01280.156906
150.0248920.23880.405914
160.0133450.1280.449212
17-0.035438-0.33990.632652
18-0.033106-0.31750.624225
190.0506110.48540.31426
200.1166861.11920.132981
21-0.003461-0.03320.513206
22-0.015644-0.150.559473
23-0.038114-0.36560.642242
24-0.093327-0.89520.813481
25-0.165728-1.58960.942322
26-0.041855-0.40150.655492
27-0.07962-0.76370.776496
28-0.081123-0.77810.780748
29-0.19864-1.90530.970067
30-0.063468-0.60880.727908
31-0.011182-0.10730.542591
320.0772290.74080.230364
33-0.027591-0.26460.604062
340.0135890.13030.448292
35-0.021285-0.20420.580661
36-0.006063-0.05820.523124
37-0.127558-1.22350.887865
38-0.113279-1.08650.859959
39-0.059665-0.57230.715737
400.0515140.49410.311205
410.0459670.44090.330162
420.111851.07280.143077
430.046460.44560.328455
440.0496890.47660.317389
450.0039820.03820.484808
460.052090.49960.309264
470.1031640.98950.162503

\begin{tabular}{lllllllll}
\hline
Autocorrelation Function \tabularnewline
Time lag k & ACF(k) & T-STAT & P-value \tabularnewline
0 & 1 & 9.5917 & 0 \tabularnewline
1 & 0.438822 & 4.209 & 3e-05 \tabularnewline
2 & 0.129732 & 1.2443 & 0.108267 \tabularnewline
3 & 0.050836 & 0.4876 & 0.313497 \tabularnewline
4 & -0.001357 & -0.013 & 0.505177 \tabularnewline
5 & -0.155528 & -1.4918 & 0.93041 \tabularnewline
6 & -0.109264 & -1.048 & 0.851313 \tabularnewline
7 & -0.187642 & -1.7998 & 0.962415 \tabularnewline
8 & -0.117786 & -1.1298 & 0.869244 \tabularnewline
9 & -0.213469 & -2.0475 & 0.978271 \tabularnewline
10 & -0.158162 & -1.517 & 0.933657 \tabularnewline
11 & 0.014076 & 0.135 & 0.446448 \tabularnewline
12 & 0.112578 & 1.0798 & 0.141524 \tabularnewline
13 & 0.065341 & 0.6267 & 0.266193 \tabularnewline
14 & 0.105592 & 1.0128 & 0.156906 \tabularnewline
15 & 0.024892 & 0.2388 & 0.405914 \tabularnewline
16 & 0.013345 & 0.128 & 0.449212 \tabularnewline
17 & -0.035438 & -0.3399 & 0.632652 \tabularnewline
18 & -0.033106 & -0.3175 & 0.624225 \tabularnewline
19 & 0.050611 & 0.4854 & 0.31426 \tabularnewline
20 & 0.116686 & 1.1192 & 0.132981 \tabularnewline
21 & -0.003461 & -0.0332 & 0.513206 \tabularnewline
22 & -0.015644 & -0.15 & 0.559473 \tabularnewline
23 & -0.038114 & -0.3656 & 0.642242 \tabularnewline
24 & -0.093327 & -0.8952 & 0.813481 \tabularnewline
25 & -0.165728 & -1.5896 & 0.942322 \tabularnewline
26 & -0.041855 & -0.4015 & 0.655492 \tabularnewline
27 & -0.07962 & -0.7637 & 0.776496 \tabularnewline
28 & -0.081123 & -0.7781 & 0.780748 \tabularnewline
29 & -0.19864 & -1.9053 & 0.970067 \tabularnewline
30 & -0.063468 & -0.6088 & 0.727908 \tabularnewline
31 & -0.011182 & -0.1073 & 0.542591 \tabularnewline
32 & 0.077229 & 0.7408 & 0.230364 \tabularnewline
33 & -0.027591 & -0.2646 & 0.604062 \tabularnewline
34 & 0.013589 & 0.1303 & 0.448292 \tabularnewline
35 & -0.021285 & -0.2042 & 0.580661 \tabularnewline
36 & -0.006063 & -0.0582 & 0.523124 \tabularnewline
37 & -0.127558 & -1.2235 & 0.887865 \tabularnewline
38 & -0.113279 & -1.0865 & 0.859959 \tabularnewline
39 & -0.059665 & -0.5723 & 0.715737 \tabularnewline
40 & 0.051514 & 0.4941 & 0.311205 \tabularnewline
41 & 0.045967 & 0.4409 & 0.330162 \tabularnewline
42 & 0.11185 & 1.0728 & 0.143077 \tabularnewline
43 & 0.04646 & 0.4456 & 0.328455 \tabularnewline
44 & 0.049689 & 0.4766 & 0.317389 \tabularnewline
45 & 0.003982 & 0.0382 & 0.484808 \tabularnewline
46 & 0.05209 & 0.4996 & 0.309264 \tabularnewline
47 & 0.103164 & 0.9895 & 0.162503 \tabularnewline
\hline
\end{tabular}
%Source: https://freestatistics.org/blog/index.php?pk=2257&T=1

[TABLE]
[ROW][C]Autocorrelation Function[/C][/ROW]
[ROW][C]Time lag k[/C][C]ACF(k)[/C][C]T-STAT[/C][C]P-value[/C][/ROW]
[ROW][C]0[/C][C]1[/C][C]9.5917[/C][C]0[/C][/ROW]
[ROW][C]1[/C][C]0.438822[/C][C]4.209[/C][C]3e-05[/C][/ROW]
[ROW][C]2[/C][C]0.129732[/C][C]1.2443[/C][C]0.108267[/C][/ROW]
[ROW][C]3[/C][C]0.050836[/C][C]0.4876[/C][C]0.313497[/C][/ROW]
[ROW][C]4[/C][C]-0.001357[/C][C]-0.013[/C][C]0.505177[/C][/ROW]
[ROW][C]5[/C][C]-0.155528[/C][C]-1.4918[/C][C]0.93041[/C][/ROW]
[ROW][C]6[/C][C]-0.109264[/C][C]-1.048[/C][C]0.851313[/C][/ROW]
[ROW][C]7[/C][C]-0.187642[/C][C]-1.7998[/C][C]0.962415[/C][/ROW]
[ROW][C]8[/C][C]-0.117786[/C][C]-1.1298[/C][C]0.869244[/C][/ROW]
[ROW][C]9[/C][C]-0.213469[/C][C]-2.0475[/C][C]0.978271[/C][/ROW]
[ROW][C]10[/C][C]-0.158162[/C][C]-1.517[/C][C]0.933657[/C][/ROW]
[ROW][C]11[/C][C]0.014076[/C][C]0.135[/C][C]0.446448[/C][/ROW]
[ROW][C]12[/C][C]0.112578[/C][C]1.0798[/C][C]0.141524[/C][/ROW]
[ROW][C]13[/C][C]0.065341[/C][C]0.6267[/C][C]0.266193[/C][/ROW]
[ROW][C]14[/C][C]0.105592[/C][C]1.0128[/C][C]0.156906[/C][/ROW]
[ROW][C]15[/C][C]0.024892[/C][C]0.2388[/C][C]0.405914[/C][/ROW]
[ROW][C]16[/C][C]0.013345[/C][C]0.128[/C][C]0.449212[/C][/ROW]
[ROW][C]17[/C][C]-0.035438[/C][C]-0.3399[/C][C]0.632652[/C][/ROW]
[ROW][C]18[/C][C]-0.033106[/C][C]-0.3175[/C][C]0.624225[/C][/ROW]
[ROW][C]19[/C][C]0.050611[/C][C]0.4854[/C][C]0.31426[/C][/ROW]
[ROW][C]20[/C][C]0.116686[/C][C]1.1192[/C][C]0.132981[/C][/ROW]
[ROW][C]21[/C][C]-0.003461[/C][C]-0.0332[/C][C]0.513206[/C][/ROW]
[ROW][C]22[/C][C]-0.015644[/C][C]-0.15[/C][C]0.559473[/C][/ROW]
[ROW][C]23[/C][C]-0.038114[/C][C]-0.3656[/C][C]0.642242[/C][/ROW]
[ROW][C]24[/C][C]-0.093327[/C][C]-0.8952[/C][C]0.813481[/C][/ROW]
[ROW][C]25[/C][C]-0.165728[/C][C]-1.5896[/C][C]0.942322[/C][/ROW]
[ROW][C]26[/C][C]-0.041855[/C][C]-0.4015[/C][C]0.655492[/C][/ROW]
[ROW][C]27[/C][C]-0.07962[/C][C]-0.7637[/C][C]0.776496[/C][/ROW]
[ROW][C]28[/C][C]-0.081123[/C][C]-0.7781[/C][C]0.780748[/C][/ROW]
[ROW][C]29[/C][C]-0.19864[/C][C]-1.9053[/C][C]0.970067[/C][/ROW]
[ROW][C]30[/C][C]-0.063468[/C][C]-0.6088[/C][C]0.727908[/C][/ROW]
[ROW][C]31[/C][C]-0.011182[/C][C]-0.1073[/C][C]0.542591[/C][/ROW]
[ROW][C]32[/C][C]0.077229[/C][C]0.7408[/C][C]0.230364[/C][/ROW]
[ROW][C]33[/C][C]-0.027591[/C][C]-0.2646[/C][C]0.604062[/C][/ROW]
[ROW][C]34[/C][C]0.013589[/C][C]0.1303[/C][C]0.448292[/C][/ROW]
[ROW][C]35[/C][C]-0.021285[/C][C]-0.2042[/C][C]0.580661[/C][/ROW]
[ROW][C]36[/C][C]-0.006063[/C][C]-0.0582[/C][C]0.523124[/C][/ROW]
[ROW][C]37[/C][C]-0.127558[/C][C]-1.2235[/C][C]0.887865[/C][/ROW]
[ROW][C]38[/C][C]-0.113279[/C][C]-1.0865[/C][C]0.859959[/C][/ROW]
[ROW][C]39[/C][C]-0.059665[/C][C]-0.5723[/C][C]0.715737[/C][/ROW]
[ROW][C]40[/C][C]0.051514[/C][C]0.4941[/C][C]0.311205[/C][/ROW]
[ROW][C]41[/C][C]0.045967[/C][C]0.4409[/C][C]0.330162[/C][/ROW]
[ROW][C]42[/C][C]0.11185[/C][C]1.0728[/C][C]0.143077[/C][/ROW]
[ROW][C]43[/C][C]0.04646[/C][C]0.4456[/C][C]0.328455[/C][/ROW]
[ROW][C]44[/C][C]0.049689[/C][C]0.4766[/C][C]0.317389[/C][/ROW]
[ROW][C]45[/C][C]0.003982[/C][C]0.0382[/C][C]0.484808[/C][/ROW]
[ROW][C]46[/C][C]0.05209[/C][C]0.4996[/C][C]0.309264[/C][/ROW]
[ROW][C]47[/C][C]0.103164[/C][C]0.9895[/C][C]0.162503[/C][/ROW]
[/TABLE]
Source: https://freestatistics.org/blog/index.php?pk=2257&T=1

Globally Unique Identifier (entire table): ba.freestatistics.org/blog/index.php?pk=2257&T=1

As an alternative you can also use a QR Code:  

The GUIDs for individual cells are displayed in the table below:

Autocorrelation Function
Time lag kACF(k)T-STATP-value
019.59170
10.4388224.2093e-05
20.1297321.24430.108267
30.0508360.48760.313497
4-0.001357-0.0130.505177
5-0.155528-1.49180.93041
6-0.109264-1.0480.851313
7-0.187642-1.79980.962415
8-0.117786-1.12980.869244
9-0.213469-2.04750.978271
10-0.158162-1.5170.933657
110.0140760.1350.446448
120.1125781.07980.141524
130.0653410.62670.266193
140.1055921.01280.156906
150.0248920.23880.405914
160.0133450.1280.449212
17-0.035438-0.33990.632652
18-0.033106-0.31750.624225
190.0506110.48540.31426
200.1166861.11920.132981
21-0.003461-0.03320.513206
22-0.015644-0.150.559473
23-0.038114-0.36560.642242
24-0.093327-0.89520.813481
25-0.165728-1.58960.942322
26-0.041855-0.40150.655492
27-0.07962-0.76370.776496
28-0.081123-0.77810.780748
29-0.19864-1.90530.970067
30-0.063468-0.60880.727908
31-0.011182-0.10730.542591
320.0772290.74080.230364
33-0.027591-0.26460.604062
340.0135890.13030.448292
35-0.021285-0.20420.580661
36-0.006063-0.05820.523124
37-0.127558-1.22350.887865
38-0.113279-1.08650.859959
39-0.059665-0.57230.715737
400.0515140.49410.311205
410.0459670.44090.330162
420.111851.07280.143077
430.046460.44560.328455
440.0496890.47660.317389
450.0039820.03820.484808
460.052090.49960.309264
470.1031640.98950.162503


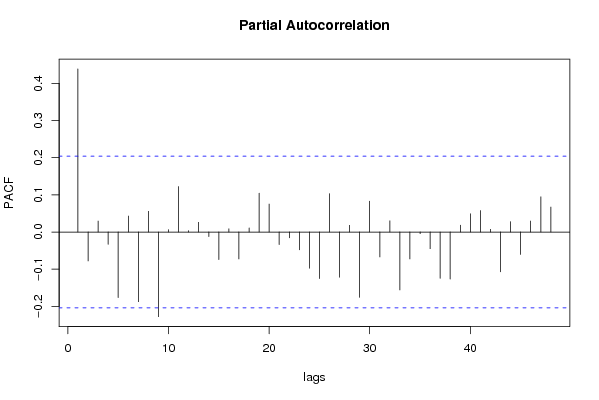
Partial Autocorrelation Function
Time lag kPACF(k)T-STATP-value
00.4388224.2093e-05
1-0.077818-0.74640.771336
20.0294370.28240.389155
3-0.033089-0.31740.624164
4-0.176539-1.69330.953109
50.0427660.41020.341306
6-0.187528-1.79870.962328
70.0555550.53290.297706
8-0.227842-2.18540.9843
90.0061280.05880.476628
100.1223071.17310.121887
110.0035650.03420.4864
120.0259950.24930.40183
13-0.012344-0.11840.546994
14-0.074226-0.71190.760851
150.0085470.0820.46742
16-0.072552-0.69590.755876
170.0107750.10340.458954
180.1045481.00280.159297
190.075080.72010.236633
20-0.033919-0.32530.627169
21-0.015539-0.1490.559077
22-0.047926-0.45970.676589
23-0.097448-0.93470.823803
24-0.125328-1.20210.883796
250.1032190.990.162374
26-0.121606-1.16640.876767
270.0180150.17280.431597
28-0.175744-1.68570.952376
290.082910.79520.21426
30-0.067066-0.64330.739178
310.0302280.28990.386257
32-0.1558-1.49440.930751
33-0.07264-0.69670.756138
34-0.004521-0.04340.517248
35-0.044782-0.42950.66573
36-0.124651-1.19560.882539
37-0.126665-1.21490.886249
380.0184620.17710.429915
390.0488560.46860.320228
400.0578060.55450.290307
410.0072360.06940.472407
42-0.107104-1.02730.846514
430.0275770.26450.395991
44-0.060517-0.58050.718486
450.0293380.28140.389516
460.0947830.90910.182829
470.0670040.64270.261017

\begin{tabular}{lllllllll}
\hline
Partial Autocorrelation Function \tabularnewline
Time lag k & PACF(k) & T-STAT & P-value \tabularnewline
0 & 0.438822 & 4.209 & 3e-05 \tabularnewline
1 & -0.077818 & -0.7464 & 0.771336 \tabularnewline
2 & 0.029437 & 0.2824 & 0.389155 \tabularnewline
3 & -0.033089 & -0.3174 & 0.624164 \tabularnewline
4 & -0.176539 & -1.6933 & 0.953109 \tabularnewline
5 & 0.042766 & 0.4102 & 0.341306 \tabularnewline
6 & -0.187528 & -1.7987 & 0.962328 \tabularnewline
7 & 0.055555 & 0.5329 & 0.297706 \tabularnewline
8 & -0.227842 & -2.1854 & 0.9843 \tabularnewline
9 & 0.006128 & 0.0588 & 0.476628 \tabularnewline
10 & 0.122307 & 1.1731 & 0.121887 \tabularnewline
11 & 0.003565 & 0.0342 & 0.4864 \tabularnewline
12 & 0.025995 & 0.2493 & 0.40183 \tabularnewline
13 & -0.012344 & -0.1184 & 0.546994 \tabularnewline
14 & -0.074226 & -0.7119 & 0.760851 \tabularnewline
15 & 0.008547 & 0.082 & 0.46742 \tabularnewline
16 & -0.072552 & -0.6959 & 0.755876 \tabularnewline
17 & 0.010775 & 0.1034 & 0.458954 \tabularnewline
18 & 0.104548 & 1.0028 & 0.159297 \tabularnewline
19 & 0.07508 & 0.7201 & 0.236633 \tabularnewline
20 & -0.033919 & -0.3253 & 0.627169 \tabularnewline
21 & -0.015539 & -0.149 & 0.559077 \tabularnewline
22 & -0.047926 & -0.4597 & 0.676589 \tabularnewline
23 & -0.097448 & -0.9347 & 0.823803 \tabularnewline
24 & -0.125328 & -1.2021 & 0.883796 \tabularnewline
25 & 0.103219 & 0.99 & 0.162374 \tabularnewline
26 & -0.121606 & -1.1664 & 0.876767 \tabularnewline
27 & 0.018015 & 0.1728 & 0.431597 \tabularnewline
28 & -0.175744 & -1.6857 & 0.952376 \tabularnewline
29 & 0.08291 & 0.7952 & 0.21426 \tabularnewline
30 & -0.067066 & -0.6433 & 0.739178 \tabularnewline
31 & 0.030228 & 0.2899 & 0.386257 \tabularnewline
32 & -0.1558 & -1.4944 & 0.930751 \tabularnewline
33 & -0.07264 & -0.6967 & 0.756138 \tabularnewline
34 & -0.004521 & -0.0434 & 0.517248 \tabularnewline
35 & -0.044782 & -0.4295 & 0.66573 \tabularnewline
36 & -0.124651 & -1.1956 & 0.882539 \tabularnewline
37 & -0.126665 & -1.2149 & 0.886249 \tabularnewline
38 & 0.018462 & 0.1771 & 0.429915 \tabularnewline
39 & 0.048856 & 0.4686 & 0.320228 \tabularnewline
40 & 0.057806 & 0.5545 & 0.290307 \tabularnewline
41 & 0.007236 & 0.0694 & 0.472407 \tabularnewline
42 & -0.107104 & -1.0273 & 0.846514 \tabularnewline
43 & 0.027577 & 0.2645 & 0.395991 \tabularnewline
44 & -0.060517 & -0.5805 & 0.718486 \tabularnewline
45 & 0.029338 & 0.2814 & 0.389516 \tabularnewline
46 & 0.094783 & 0.9091 & 0.182829 \tabularnewline
47 & 0.067004 & 0.6427 & 0.261017 \tabularnewline
\hline
\end{tabular}
%Source: https://freestatistics.org/blog/index.php?pk=2257&T=2

[TABLE]
[ROW][C]Partial Autocorrelation Function[/C][/ROW]
[ROW][C]Time lag k[/C][C]PACF(k)[/C][C]T-STAT[/C][C]P-value[/C][/ROW]
[ROW][C]0[/C][C]0.438822[/C][C]4.209[/C][C]3e-05[/C][/ROW]
[ROW][C]1[/C][C]-0.077818[/C][C]-0.7464[/C][C]0.771336[/C][/ROW]
[ROW][C]2[/C][C]0.029437[/C][C]0.2824[/C][C]0.389155[/C][/ROW]
[ROW][C]3[/C][C]-0.033089[/C][C]-0.3174[/C][C]0.624164[/C][/ROW]
[ROW][C]4[/C][C]-0.176539[/C][C]-1.6933[/C][C]0.953109[/C][/ROW]
[ROW][C]5[/C][C]0.042766[/C][C]0.4102[/C][C]0.341306[/C][/ROW]
[ROW][C]6[/C][C]-0.187528[/C][C]-1.7987[/C][C]0.962328[/C][/ROW]
[ROW][C]7[/C][C]0.055555[/C][C]0.5329[/C][C]0.297706[/C][/ROW]
[ROW][C]8[/C][C]-0.227842[/C][C]-2.1854[/C][C]0.9843[/C][/ROW]
[ROW][C]9[/C][C]0.006128[/C][C]0.0588[/C][C]0.476628[/C][/ROW]
[ROW][C]10[/C][C]0.122307[/C][C]1.1731[/C][C]0.121887[/C][/ROW]
[ROW][C]11[/C][C]0.003565[/C][C]0.0342[/C][C]0.4864[/C][/ROW]
[ROW][C]12[/C][C]0.025995[/C][C]0.2493[/C][C]0.40183[/C][/ROW]
[ROW][C]13[/C][C]-0.012344[/C][C]-0.1184[/C][C]0.546994[/C][/ROW]
[ROW][C]14[/C][C]-0.074226[/C][C]-0.7119[/C][C]0.760851[/C][/ROW]
[ROW][C]15[/C][C]0.008547[/C][C]0.082[/C][C]0.46742[/C][/ROW]
[ROW][C]16[/C][C]-0.072552[/C][C]-0.6959[/C][C]0.755876[/C][/ROW]
[ROW][C]17[/C][C]0.010775[/C][C]0.1034[/C][C]0.458954[/C][/ROW]
[ROW][C]18[/C][C]0.104548[/C][C]1.0028[/C][C]0.159297[/C][/ROW]
[ROW][C]19[/C][C]0.07508[/C][C]0.7201[/C][C]0.236633[/C][/ROW]
[ROW][C]20[/C][C]-0.033919[/C][C]-0.3253[/C][C]0.627169[/C][/ROW]
[ROW][C]21[/C][C]-0.015539[/C][C]-0.149[/C][C]0.559077[/C][/ROW]
[ROW][C]22[/C][C]-0.047926[/C][C]-0.4597[/C][C]0.676589[/C][/ROW]
[ROW][C]23[/C][C]-0.097448[/C][C]-0.9347[/C][C]0.823803[/C][/ROW]
[ROW][C]24[/C][C]-0.125328[/C][C]-1.2021[/C][C]0.883796[/C][/ROW]
[ROW][C]25[/C][C]0.103219[/C][C]0.99[/C][C]0.162374[/C][/ROW]
[ROW][C]26[/C][C]-0.121606[/C][C]-1.1664[/C][C]0.876767[/C][/ROW]
[ROW][C]27[/C][C]0.018015[/C][C]0.1728[/C][C]0.431597[/C][/ROW]
[ROW][C]28[/C][C]-0.175744[/C][C]-1.6857[/C][C]0.952376[/C][/ROW]
[ROW][C]29[/C][C]0.08291[/C][C]0.7952[/C][C]0.21426[/C][/ROW]
[ROW][C]30[/C][C]-0.067066[/C][C]-0.6433[/C][C]0.739178[/C][/ROW]
[ROW][C]31[/C][C]0.030228[/C][C]0.2899[/C][C]0.386257[/C][/ROW]
[ROW][C]32[/C][C]-0.1558[/C][C]-1.4944[/C][C]0.930751[/C][/ROW]
[ROW][C]33[/C][C]-0.07264[/C][C]-0.6967[/C][C]0.756138[/C][/ROW]
[ROW][C]34[/C][C]-0.004521[/C][C]-0.0434[/C][C]0.517248[/C][/ROW]
[ROW][C]35[/C][C]-0.044782[/C][C]-0.4295[/C][C]0.66573[/C][/ROW]
[ROW][C]36[/C][C]-0.124651[/C][C]-1.1956[/C][C]0.882539[/C][/ROW]
[ROW][C]37[/C][C]-0.126665[/C][C]-1.2149[/C][C]0.886249[/C][/ROW]
[ROW][C]38[/C][C]0.018462[/C][C]0.1771[/C][C]0.429915[/C][/ROW]
[ROW][C]39[/C][C]0.048856[/C][C]0.4686[/C][C]0.320228[/C][/ROW]
[ROW][C]40[/C][C]0.057806[/C][C]0.5545[/C][C]0.290307[/C][/ROW]
[ROW][C]41[/C][C]0.007236[/C][C]0.0694[/C][C]0.472407[/C][/ROW]
[ROW][C]42[/C][C]-0.107104[/C][C]-1.0273[/C][C]0.846514[/C][/ROW]
[ROW][C]43[/C][C]0.027577[/C][C]0.2645[/C][C]0.395991[/C][/ROW]
[ROW][C]44[/C][C]-0.060517[/C][C]-0.5805[/C][C]0.718486[/C][/ROW]
[ROW][C]45[/C][C]0.029338[/C][C]0.2814[/C][C]0.389516[/C][/ROW]
[ROW][C]46[/C][C]0.094783[/C][C]0.9091[/C][C]0.182829[/C][/ROW]
[ROW][C]47[/C][C]0.067004[/C][C]0.6427[/C][C]0.261017[/C][/ROW]
[/TABLE]
Source: https://freestatistics.org/blog/index.php?pk=2257&T=2

Globally Unique Identifier (entire table): ba.freestatistics.org/blog/index.php?pk=2257&T=2

As an alternative you can also use a QR Code:  

The GUIDs for individual cells are displayed in the table below:

Partial Autocorrelation Function
Time lag kPACF(k)T-STATP-value
00.4388224.2093e-05
1-0.077818-0.74640.771336
20.0294370.28240.389155
3-0.033089-0.31740.624164
4-0.176539-1.69330.953109
50.0427660.41020.341306
6-0.187528-1.79870.962328
70.0555550.53290.297706
8-0.227842-2.18540.9843
90.0061280.05880.476628
100.1223071.17310.121887
110.0035650.03420.4864
120.0259950.24930.40183
13-0.012344-0.11840.546994
14-0.074226-0.71190.760851
150.0085470.0820.46742
16-0.072552-0.69590.755876
170.0107750.10340.458954
180.1045481.00280.159297
190.075080.72010.236633
20-0.033919-0.32530.627169
21-0.015539-0.1490.559077
22-0.047926-0.45970.676589
23-0.097448-0.93470.823803
24-0.125328-1.20210.883796
250.1032190.990.162374
26-0.121606-1.16640.876767
270.0180150.17280.431597
28-0.175744-1.68570.952376
290.082910.79520.21426
30-0.067066-0.64330.739178
310.0302280.28990.386257
32-0.1558-1.49440.930751
33-0.07264-0.69670.756138
34-0.004521-0.04340.517248
35-0.044782-0.42950.66573
36-0.124651-1.19560.882539
37-0.126665-1.21490.886249
380.0184620.17710.429915
390.0488560.46860.320228
400.0578060.55450.290307
410.0072360.06940.472407
42-0.107104-1.02730.846514
430.0275770.26450.395991
44-0.060517-0.58050.718486
450.0293380.28140.389516
460.0947830.90910.182829
470.0670040.64270.261017


Parameters (Session):
par1 = 48 ; par2 = 1 ; par3 = 1 ; par4 = 0 ; par5 = 12 ;
Parameters (R input):
par1 = 48 ; par2 = 1 ; par3 = 1 ; par4 = 0 ; par5 = 12 ;
R code (references can be found in the software module):
if (par1 == 'Default') {
par1 = 10*log10(length(x))
} else {
par1 <- as.numeric(par1)
}
par2 <- as.numeric(par2)
par3 <- as.numeric(par3)
par4 <- as.numeric(par4)
par5 <- as.numeric(par5)
if (par2 == 0) {
x <- log(x)
} else {
x <- (x ^ par2 - 1) / par2
}
if (par3 > 0) x <- diff(x,lag=1,difference=par3)
if (par4 > 0) x <- diff(x,lag=par5,difference=par4)
bitmap(file='pic1.png')
racf <- acf(x,par1,main='Autocorrelation',xlab='lags',ylab='ACF')
dev.off()
bitmap(file='pic2.png')
rpacf <- pacf(x,par1,main='Partial Autocorrelation',xlab='lags',ylab='PACF')
dev.off()
(myacf <- c(racf$acf))
(mypacf <- c(rpacf$acf))
lengthx <- length(x)
sqrtn <- sqrt(lengthx)
load(file='createtable')
a<-table.start()
a<-table.row.start(a)
a<-table.element(a,'Autocorrelation Function',4,TRUE)
a<-table.row.end(a)
a<-table.row.start(a)
a<-table.element(a,'Time lag k',header=TRUE)
a<-table.element(a,hyperlink('basics.htm','ACF(k)','click here for more information about the Autocorrelation Function'),header=TRUE)
a<-table.element(a,'T-STAT',header=TRUE)
a<-table.element(a,'P-value',header=TRUE)
a<-table.row.end(a)
for (i in 1:par1) {
a<-table.row.start(a)
a<-table.element(a,i-1,header=TRUE)
a<-table.element(a,round(myacf[i],6))
mytstat <- myacf[i]*sqrtn
a<-table.element(a,round(mytstat,4))
a<-table.element(a,round(1-pt(mytstat,lengthx),6))
a<-table.row.end(a)
}
a<-table.end(a)
table.save(a,file='mytable.tab')
a<-table.start()
a<-table.row.start(a)
a<-table.element(a,'Partial Autocorrelation Function',4,TRUE)
a<-table.row.end(a)
a<-table.row.start(a)
a<-table.element(a,'Time lag k',header=TRUE)
a<-table.element(a,hyperlink('basics.htm','PACF(k)','click here for more information about the Partial Autocorrelation Function'),header=TRUE)
a<-table.element(a,'T-STAT',header=TRUE)
a<-table.element(a,'P-value',header=TRUE)
a<-table.row.end(a)
for (i in 1:par1) {
a<-table.row.start(a)
a<-table.element(a,i-1,header=TRUE)
a<-table.element(a,round(mypacf[i],6))
mytstat <- mypacf[i]*sqrtn
a<-table.element(a,round(mytstat,4))
a<-table.element(a,round(1-pt(mytstat,lengthx),6))
a<-table.row.end(a)
}
a<-table.end(a)
table.save(a,file='mytable1.tab')