Free Statistics

of Irreproducible Research!

Author's title

Author*Unverified author*
R Software Modulerwasp_arimabackwardselection.wasp
Title produced by softwareARIMA Backward Selection
Date of computationSat, 01 Dec 2007 06:59:14 -0700
Cite this page as followsStatistical Computations at FreeStatistics.org, Office for Research Development and Education, URL https://freestatistics.org/blog/index.php?v=date/2007/Dec/01/t11965169268vmllz7d7fi4v93.htm/, Retrieved Sun, 19 May 2024 17:44:57 +0000
Statistical Computations at FreeStatistics.org, Office for Research Development and Education, URL https://freestatistics.org/blog/index.php?pk=2256, Retrieved Sun, 19 May 2024 17:44:57 +0000
QR Codes:

Original text written by user:
IsPrivate?No (this computation is public)
User-defined keywords
Estimated Impact210
Family? (F = Feedback message, R = changed R code, M = changed R Module, P = changed Parameters, D = changed Data)
-       [ARIMA Backward Selection] [ARMA process] [2007-12-01 13:59:14] [bd02e85be52eb1cb060a2c60779eb820] [Current]
Feedback Forum

Post a new message
Dataseries X:
33259
33250
32875
32424
31867
31871
33140
33555
33324
32358
31857
32101
32810
32057
31663
31325
31103
31012
32511
33677
32213
31635
31043
31303
31899
31384
30650
30400
30003
29896
31557
31883
30830
30354
29756
29934
30599
30378
29925
29471
29567
29419
30796
31475
31708
31917
30871
31512
32362
31928
31699
30363
30386
30364
32806
33423
33071
33888
34805
35489
37259
37722
38764
39594
40004
40715
44028
45564
44277
44976
45406
47379
49200
50221
51573
53091
53337
54978
57885
67099
67169
69796
70600
71982
73957
75273
76322
77078
77954
79238
82179
83834
83744
84861
86478
88290
90287
91230
92380
92506
94172
94728
96581
97344
98346
98214
98366
98768


Summary of compuational transaction
Raw Inputview raw input (R code)
Raw Outputview raw output of R engine
Computing time5 seconds
R Server'Gwilym Jenkins' @ 72.249.127.135

\begin{tabular}{lllllllll}
\hline
Summary of compuational transaction \tabularnewline
Raw Input & view raw input (R code)  \tabularnewline
Raw Output & view raw output of R engine  \tabularnewline
Computing time & 5 seconds \tabularnewline
R Server & 'Gwilym Jenkins' @ 72.249.127.135 \tabularnewline
\hline
\end{tabular}
%Source: https://freestatistics.org/blog/index.php?pk=2256&T=0

[TABLE]
[ROW][C]Summary of compuational transaction[/C][/ROW]
[ROW][C]Raw Input[/C][C]view raw input (R code) [/C][/ROW]
[ROW][C]Raw Output[/C][C]view raw output of R engine [/C][/ROW]
[ROW][C]Computing time[/C][C]5 seconds[/C][/ROW]
[ROW][C]R Server[/C][C]'Gwilym Jenkins' @ 72.249.127.135[/C][/ROW]
[/TABLE]
Source: https://freestatistics.org/blog/index.php?pk=2256&T=0

Globally Unique Identifier (entire table): ba.freestatistics.org/blog/index.php?pk=2256&T=0

As an alternative you can also use a QR Code:  

The GUIDs for individual cells are displayed in the table below:

Summary of compuational transaction
Raw Inputview raw input (R code)
Raw Outputview raw output of R engine
Computing time5 seconds
R Server'Gwilym Jenkins' @ 72.249.127.135


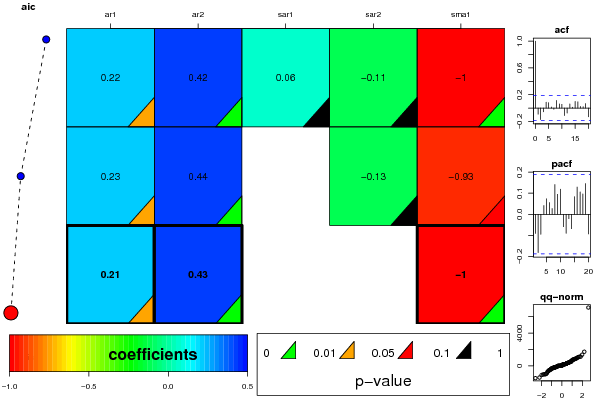
ARIMA Parameter Estimation and Backward Selection
Iterationar1ar2sar1sar2sma1
Estimates ( 1 )0.22060.42360.0597-0.1088-0.9999
(p-val)(0.025 )(0 )(0.6402 )(0.3313 )(0.0028 )
Estimates ( 2 )0.22880.43610-0.1281-0.9251
(p-val)(0.0221 )(0 )(NA )(0.2984 )(0.0707 )
Estimates ( 3 )0.20790.434900-0.9997
(p-val)(0.0252 )(0 )(NA )(NA )(1e-04 )
Estimates ( 4 )NANANANANA
(p-val)(NA )(NA )(NA )(NA )(NA )

\begin{tabular}{lllllllll}
\hline
ARIMA Parameter Estimation and Backward Selection \tabularnewline
Iteration & ar1 & ar2 & sar1 & sar2 & sma1 \tabularnewline
Estimates ( 1 ) & 0.2206 & 0.4236 & 0.0597 & -0.1088 & -0.9999 \tabularnewline
(p-val) & (0.025 ) & (0 ) & (0.6402 ) & (0.3313 ) & (0.0028 ) \tabularnewline
Estimates ( 2 ) & 0.2288 & 0.4361 & 0 & -0.1281 & -0.9251 \tabularnewline
(p-val) & (0.0221 ) & (0 ) & (NA ) & (0.2984 ) & (0.0707 ) \tabularnewline
Estimates ( 3 ) & 0.2079 & 0.4349 & 0 & 0 & -0.9997 \tabularnewline
(p-val) & (0.0252 ) & (0 ) & (NA ) & (NA ) & (1e-04 ) \tabularnewline
Estimates ( 4 ) & NA & NA & NA & NA & NA \tabularnewline
(p-val) & (NA ) & (NA ) & (NA ) & (NA ) & (NA ) \tabularnewline
\hline
\end{tabular}
%Source: https://freestatistics.org/blog/index.php?pk=2256&T=1

[TABLE]
[ROW][C]ARIMA Parameter Estimation and Backward Selection[/C][/ROW]
[ROW][C]Iteration[/C][C]ar1[/C][C]ar2[/C][C]sar1[/C][C]sar2[/C][C]sma1[/C][/ROW]
[ROW][C]Estimates ( 1 )[/C][C]0.2206[/C][C]0.4236[/C][C]0.0597[/C][C]-0.1088[/C][C]-0.9999[/C][/ROW]
[ROW][C](p-val)[/C][C](0.025 )[/C][C](0 )[/C][C](0.6402 )[/C][C](0.3313 )[/C][C](0.0028 )[/C][/ROW]
[ROW][C]Estimates ( 2 )[/C][C]0.2288[/C][C]0.4361[/C][C]0[/C][C]-0.1281[/C][C]-0.9251[/C][/ROW]
[ROW][C](p-val)[/C][C](0.0221 )[/C][C](0 )[/C][C](NA )[/C][C](0.2984 )[/C][C](0.0707 )[/C][/ROW]
[ROW][C]Estimates ( 3 )[/C][C]0.2079[/C][C]0.4349[/C][C]0[/C][C]0[/C][C]-0.9997[/C][/ROW]
[ROW][C](p-val)[/C][C](0.0252 )[/C][C](0 )[/C][C](NA )[/C][C](NA )[/C][C](1e-04 )[/C][/ROW]
[ROW][C]Estimates ( 4 )[/C][C]NA[/C][C]NA[/C][C]NA[/C][C]NA[/C][C]NA[/C][/ROW]
[ROW][C](p-val)[/C][C](NA )[/C][C](NA )[/C][C](NA )[/C][C](NA )[/C][C](NA )[/C][/ROW]
[/TABLE]
Source: https://freestatistics.org/blog/index.php?pk=2256&T=1

Globally Unique Identifier (entire table): ba.freestatistics.org/blog/index.php?pk=2256&T=1

As an alternative you can also use a QR Code:  

The GUIDs for individual cells are displayed in the table below:

ARIMA Parameter Estimation and Backward Selection
Iterationar1ar2sar1sar2sma1
Estimates ( 1 )0.22060.42360.0597-0.1088-0.9999
(p-val)(0.025 )(0 )(0.6402 )(0.3313 )(0.0028 )
Estimates ( 2 )0.22880.43610-0.1281-0.9251
(p-val)(0.0221 )(0 )(NA )(0.2984 )(0.0707 )
Estimates ( 3 )0.20790.434900-0.9997
(p-val)(0.0252 )(0 )(NA )(NA )(1e-04 )
Estimates ( 4 )NANANANANA
(p-val)(NA )(NA )(NA )(NA )(NA )


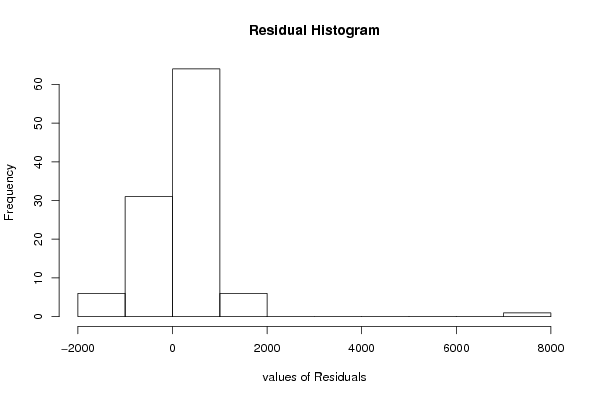
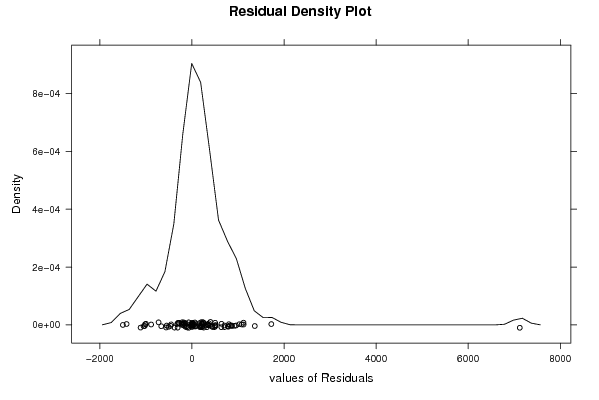
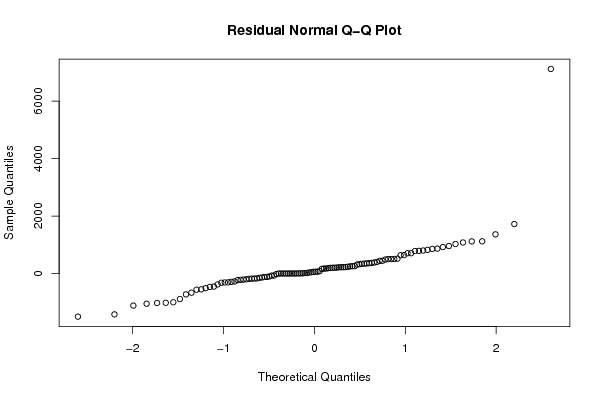
Estimated ARIMA Residuals
Value
-115.781974287175
-452.574213570022
176.207318885134
313.891741374439
222.294104270716
-173.454303740768
63.488604491799
517.756591029634
-1115.29863124841
206.915631670376
236.430786800491
-176.995534411793
-71.4341558931356
1.46636730689016
-209.213421334996
197.977836343243
64.9570454315748
-101.257357209257
219.376116959051
-464.091379867058
-119.389285554618
386.250068385148
-68.8181458435095
-218.121997643260
18.7160812140601
203.055751172708
45.6066568288656
-167.923798471215
445.383228705206
-147.314859944742
-273.09619122328
162.846317821167
922.693083032222
506.708770195484
-1024.29050011664
84.357559878133
250.343276133738
-229.517829293722
171.539017382223
-885.98528233262
353.846336210525
371.069439602056
802.645276040567
-310.232909129602
-198.669909262659
1122.13956954785
1119.87438633940
-561.566408202955
256.440617971389
488.143520556708
788.399481622289
642.341763361356
-287.723769142355
8.30760662981129
1081.82466685363
186.32334318727
-1419.65533834593
638.560587518492
707.003838743824
958.59145695100
225.436219498316
340.942457611563
825.535301247247
784.014851816982
-665.695262907471
708.589316629784
504.354947295749
7121.1007945741
-1499.67276781132
-1016.07441029066
219.841865227989
-724.526863989335
324.399360464007
868.54801251579
360.940956004746
57.5801118323293
256.901999733512
402.081018617517
341.862560726296
-1049.98744353581
38.5824651504146
857.697215341983
1364.58065412927
442.080408188929
-135.816482265515
202.353579819117
504.211681779538
-378.709025886448
1028.29814416432
-183.941578540697
-999.099062092812
-304.745902295099
1723.90715904092
-548.415271874644
-507.562898293036
-320.470041182403

\begin{tabular}{lllllllll}
\hline
Estimated ARIMA Residuals \tabularnewline
Value \tabularnewline
-115.781974287175 \tabularnewline
-452.574213570022 \tabularnewline
176.207318885134 \tabularnewline
313.891741374439 \tabularnewline
222.294104270716 \tabularnewline
-173.454303740768 \tabularnewline
63.488604491799 \tabularnewline
517.756591029634 \tabularnewline
-1115.29863124841 \tabularnewline
206.915631670376 \tabularnewline
236.430786800491 \tabularnewline
-176.995534411793 \tabularnewline
-71.4341558931356 \tabularnewline
1.46636730689016 \tabularnewline
-209.213421334996 \tabularnewline
197.977836343243 \tabularnewline
64.9570454315748 \tabularnewline
-101.257357209257 \tabularnewline
219.376116959051 \tabularnewline
-464.091379867058 \tabularnewline
-119.389285554618 \tabularnewline
386.250068385148 \tabularnewline
-68.8181458435095 \tabularnewline
-218.121997643260 \tabularnewline
18.7160812140601 \tabularnewline
203.055751172708 \tabularnewline
45.6066568288656 \tabularnewline
-167.923798471215 \tabularnewline
445.383228705206 \tabularnewline
-147.314859944742 \tabularnewline
-273.09619122328 \tabularnewline
162.846317821167 \tabularnewline
922.693083032222 \tabularnewline
506.708770195484 \tabularnewline
-1024.29050011664 \tabularnewline
84.357559878133 \tabularnewline
250.343276133738 \tabularnewline
-229.517829293722 \tabularnewline
171.539017382223 \tabularnewline
-885.98528233262 \tabularnewline
353.846336210525 \tabularnewline
371.069439602056 \tabularnewline
802.645276040567 \tabularnewline
-310.232909129602 \tabularnewline
-198.669909262659 \tabularnewline
1122.13956954785 \tabularnewline
1119.87438633940 \tabularnewline
-561.566408202955 \tabularnewline
256.440617971389 \tabularnewline
488.143520556708 \tabularnewline
788.399481622289 \tabularnewline
642.341763361356 \tabularnewline
-287.723769142355 \tabularnewline
8.30760662981129 \tabularnewline
1081.82466685363 \tabularnewline
186.32334318727 \tabularnewline
-1419.65533834593 \tabularnewline
638.560587518492 \tabularnewline
707.003838743824 \tabularnewline
958.59145695100 \tabularnewline
225.436219498316 \tabularnewline
340.942457611563 \tabularnewline
825.535301247247 \tabularnewline
784.014851816982 \tabularnewline
-665.695262907471 \tabularnewline
708.589316629784 \tabularnewline
504.354947295749 \tabularnewline
7121.1007945741 \tabularnewline
-1499.67276781132 \tabularnewline
-1016.07441029066 \tabularnewline
219.841865227989 \tabularnewline
-724.526863989335 \tabularnewline
324.399360464007 \tabularnewline
868.54801251579 \tabularnewline
360.940956004746 \tabularnewline
57.5801118323293 \tabularnewline
256.901999733512 \tabularnewline
402.081018617517 \tabularnewline
341.862560726296 \tabularnewline
-1049.98744353581 \tabularnewline
38.5824651504146 \tabularnewline
857.697215341983 \tabularnewline
1364.58065412927 \tabularnewline
442.080408188929 \tabularnewline
-135.816482265515 \tabularnewline
202.353579819117 \tabularnewline
504.211681779538 \tabularnewline
-378.709025886448 \tabularnewline
1028.29814416432 \tabularnewline
-183.941578540697 \tabularnewline
-999.099062092812 \tabularnewline
-304.745902295099 \tabularnewline
1723.90715904092 \tabularnewline
-548.415271874644 \tabularnewline
-507.562898293036 \tabularnewline
-320.470041182403 \tabularnewline
\hline
\end{tabular}
%Source: https://freestatistics.org/blog/index.php?pk=2256&T=2

[TABLE]
[ROW][C]Estimated ARIMA Residuals[/C][/ROW]
[ROW][C]Value[/C][/ROW]
[ROW][C]-115.781974287175[/C][/ROW]
[ROW][C]-452.574213570022[/C][/ROW]
[ROW][C]176.207318885134[/C][/ROW]
[ROW][C]313.891741374439[/C][/ROW]
[ROW][C]222.294104270716[/C][/ROW]
[ROW][C]-173.454303740768[/C][/ROW]
[ROW][C]63.488604491799[/C][/ROW]
[ROW][C]517.756591029634[/C][/ROW]
[ROW][C]-1115.29863124841[/C][/ROW]
[ROW][C]206.915631670376[/C][/ROW]
[ROW][C]236.430786800491[/C][/ROW]
[ROW][C]-176.995534411793[/C][/ROW]
[ROW][C]-71.4341558931356[/C][/ROW]
[ROW][C]1.46636730689016[/C][/ROW]
[ROW][C]-209.213421334996[/C][/ROW]
[ROW][C]197.977836343243[/C][/ROW]
[ROW][C]64.9570454315748[/C][/ROW]
[ROW][C]-101.257357209257[/C][/ROW]
[ROW][C]219.376116959051[/C][/ROW]
[ROW][C]-464.091379867058[/C][/ROW]
[ROW][C]-119.389285554618[/C][/ROW]
[ROW][C]386.250068385148[/C][/ROW]
[ROW][C]-68.8181458435095[/C][/ROW]
[ROW][C]-218.121997643260[/C][/ROW]
[ROW][C]18.7160812140601[/C][/ROW]
[ROW][C]203.055751172708[/C][/ROW]
[ROW][C]45.6066568288656[/C][/ROW]
[ROW][C]-167.923798471215[/C][/ROW]
[ROW][C]445.383228705206[/C][/ROW]
[ROW][C]-147.314859944742[/C][/ROW]
[ROW][C]-273.09619122328[/C][/ROW]
[ROW][C]162.846317821167[/C][/ROW]
[ROW][C]922.693083032222[/C][/ROW]
[ROW][C]506.708770195484[/C][/ROW]
[ROW][C]-1024.29050011664[/C][/ROW]
[ROW][C]84.357559878133[/C][/ROW]
[ROW][C]250.343276133738[/C][/ROW]
[ROW][C]-229.517829293722[/C][/ROW]
[ROW][C]171.539017382223[/C][/ROW]
[ROW][C]-885.98528233262[/C][/ROW]
[ROW][C]353.846336210525[/C][/ROW]
[ROW][C]371.069439602056[/C][/ROW]
[ROW][C]802.645276040567[/C][/ROW]
[ROW][C]-310.232909129602[/C][/ROW]
[ROW][C]-198.669909262659[/C][/ROW]
[ROW][C]1122.13956954785[/C][/ROW]
[ROW][C]1119.87438633940[/C][/ROW]
[ROW][C]-561.566408202955[/C][/ROW]
[ROW][C]256.440617971389[/C][/ROW]
[ROW][C]488.143520556708[/C][/ROW]
[ROW][C]788.399481622289[/C][/ROW]
[ROW][C]642.341763361356[/C][/ROW]
[ROW][C]-287.723769142355[/C][/ROW]
[ROW][C]8.30760662981129[/C][/ROW]
[ROW][C]1081.82466685363[/C][/ROW]
[ROW][C]186.32334318727[/C][/ROW]
[ROW][C]-1419.65533834593[/C][/ROW]
[ROW][C]638.560587518492[/C][/ROW]
[ROW][C]707.003838743824[/C][/ROW]
[ROW][C]958.59145695100[/C][/ROW]
[ROW][C]225.436219498316[/C][/ROW]
[ROW][C]340.942457611563[/C][/ROW]
[ROW][C]825.535301247247[/C][/ROW]
[ROW][C]784.014851816982[/C][/ROW]
[ROW][C]-665.695262907471[/C][/ROW]
[ROW][C]708.589316629784[/C][/ROW]
[ROW][C]504.354947295749[/C][/ROW]
[ROW][C]7121.1007945741[/C][/ROW]
[ROW][C]-1499.67276781132[/C][/ROW]
[ROW][C]-1016.07441029066[/C][/ROW]
[ROW][C]219.841865227989[/C][/ROW]
[ROW][C]-724.526863989335[/C][/ROW]
[ROW][C]324.399360464007[/C][/ROW]
[ROW][C]868.54801251579[/C][/ROW]
[ROW][C]360.940956004746[/C][/ROW]
[ROW][C]57.5801118323293[/C][/ROW]
[ROW][C]256.901999733512[/C][/ROW]
[ROW][C]402.081018617517[/C][/ROW]
[ROW][C]341.862560726296[/C][/ROW]
[ROW][C]-1049.98744353581[/C][/ROW]
[ROW][C]38.5824651504146[/C][/ROW]
[ROW][C]857.697215341983[/C][/ROW]
[ROW][C]1364.58065412927[/C][/ROW]
[ROW][C]442.080408188929[/C][/ROW]
[ROW][C]-135.816482265515[/C][/ROW]
[ROW][C]202.353579819117[/C][/ROW]
[ROW][C]504.211681779538[/C][/ROW]
[ROW][C]-378.709025886448[/C][/ROW]
[ROW][C]1028.29814416432[/C][/ROW]
[ROW][C]-183.941578540697[/C][/ROW]
[ROW][C]-999.099062092812[/C][/ROW]
[ROW][C]-304.745902295099[/C][/ROW]
[ROW][C]1723.90715904092[/C][/ROW]
[ROW][C]-548.415271874644[/C][/ROW]
[ROW][C]-507.562898293036[/C][/ROW]
[ROW][C]-320.470041182403[/C][/ROW]
[/TABLE]
Source: https://freestatistics.org/blog/index.php?pk=2256&T=2

Globally Unique Identifier (entire table): ba.freestatistics.org/blog/index.php?pk=2256&T=2

As an alternative you can also use a QR Code:  

The GUIDs for individual cells are displayed in the table below:

Estimated ARIMA Residuals
Value
-115.781974287175
-452.574213570022
176.207318885134
313.891741374439
222.294104270716
-173.454303740768
63.488604491799
517.756591029634
-1115.29863124841
206.915631670376
236.430786800491
-176.995534411793
-71.4341558931356
1.46636730689016
-209.213421334996
197.977836343243
64.9570454315748
-101.257357209257
219.376116959051
-464.091379867058
-119.389285554618
386.250068385148
-68.8181458435095
-218.121997643260
18.7160812140601
203.055751172708
45.6066568288656
-167.923798471215
445.383228705206
-147.314859944742
-273.09619122328
162.846317821167
922.693083032222
506.708770195484
-1024.29050011664
84.357559878133
250.343276133738
-229.517829293722
171.539017382223
-885.98528233262
353.846336210525
371.069439602056
802.645276040567
-310.232909129602
-198.669909262659
1122.13956954785
1119.87438633940
-561.566408202955
256.440617971389
488.143520556708
788.399481622289
642.341763361356
-287.723769142355
8.30760662981129
1081.82466685363
186.32334318727
-1419.65533834593
638.560587518492
707.003838743824
958.59145695100
225.436219498316
340.942457611563
825.535301247247
784.014851816982
-665.695262907471
708.589316629784
504.354947295749
7121.1007945741
-1499.67276781132
-1016.07441029066
219.841865227989
-724.526863989335
324.399360464007
868.54801251579
360.940956004746
57.5801118323293
256.901999733512
402.081018617517
341.862560726296
-1049.98744353581
38.5824651504146
857.697215341983
1364.58065412927
442.080408188929
-135.816482265515
202.353579819117
504.211681779538
-378.709025886448
1028.29814416432
-183.941578540697
-999.099062092812
-304.745902295099
1723.90715904092
-548.415271874644
-507.562898293036
-320.470041182403


Parameters (Session):
par1 = Default ; par2 = 1 ; par3 = 1 ; par4 = 0 ; par5 = 12 ;
Parameters (R input):
par1 = FALSE ; par2 = 1 ; par3 = 1 ; par4 = 1 ; par5 = 12 ; par6 = 2 ; par7 = 0 ; par8 = 2 ; par9 = 1 ;
R code (references can be found in the software module):
library(lattice)
if (par1 == 'TRUE') par1 <- TRUE
if (par1 == 'FALSE') par1 <- FALSE
par2 <- as.numeric(par2) #Box-Cox lambda transformation parameter
par3 <- as.numeric(par3) #degree of non-seasonal differencing
par4 <- as.numeric(par4) #degree of seasonal differencing
par5 <- as.numeric(par5) #seasonal period
par6 <- as.numeric(par6) #degree (p) of the non-seasonal AR(p) polynomial
par7 <- as.numeric(par7) #degree (q) of the non-seasonal MA(q) polynomial
par8 <- as.numeric(par8) #degree (P) of the seasonal AR(P) polynomial
par9 <- as.numeric(par9) #degree (Q) of the seasonal MA(Q) polynomial
armaGR <- function(arima.out, names, n){
try1 <- arima.out$coef
try2 <- sqrt(diag(arima.out$var.coef))
try.data.frame <- data.frame(matrix(NA,ncol=4,nrow=length(names)))
dimnames(try.data.frame) <- list(names,c('coef','std','tstat','pv'))
try.data.frame[,1] <- try1
for(i in 1:length(try2)) try.data.frame[which(rownames(try.data.frame)==names(try2)[i]),2] <- try2[i]
try.data.frame[,3] <- try.data.frame[,1] / try.data.frame[,2]
try.data.frame[,4] <- round((1-pt(abs(try.data.frame[,3]),df=n-(length(try2)+1)))*2,5)
vector <- rep(NA,length(names))
vector[is.na(try.data.frame[,4])] <- 0
maxi <- which.max(try.data.frame[,4])
continue <- max(try.data.frame[,4],na.rm=TRUE) > .05
vector[maxi] <- 0
list(summary=try.data.frame,next.vector=vector,continue=continue)
}
arimaSelect <- function(series, order=c(13,0,0), seasonal=list(order=c(2,0,0),period=12), include.mean=F){
nrc <- order[1]+order[3]+seasonal$order[1]+seasonal$order[3]
coeff <- matrix(NA, nrow=nrc, ncol=nrc)
pval <- matrix(NA, nrow=nrc, ncol=nrc)
mylist <- rep(list(NULL), nrc)
names <- NULL
if(order[1] > 0) names <- paste('ar',1:order[1],sep='')
if(order[3] > 0) names <- c( names , paste('ma',1:order[3],sep='') )
if(seasonal$order[1] > 0) names <- c(names, paste('sar',1:seasonal$order[1],sep=''))
if(seasonal$order[3] > 0) names <- c(names, paste('sma',1:seasonal$order[3],sep=''))
arima.out <- arima(series, order=order, seasonal=seasonal, include.mean=include.mean, method='ML')
mylist[[1]] <- arima.out
last.arma <- armaGR(arima.out, names, length(series))
mystop <- FALSE
i <- 1
coeff[i,] <- last.arma[[1]][,1]
pval [i,] <- last.arma[[1]][,4]
i <- 2
aic <- arima.out$aic
while(!mystop){
mylist[[i]] <- arima.out
arima.out <- arima(series, order=order, seasonal=seasonal, include.mean=include.mean, method='ML', fixed=last.arma$next.vector)
aic <- c(aic, arima.out$aic)
last.arma <- armaGR(arima.out, names, length(series))
mystop <- !last.arma$continue
coeff[i,] <- last.arma[[1]][,1]
pval [i,] <- last.arma[[1]][,4]
i <- i+1
}
list(coeff, pval, mylist, aic=aic)
}
arimaSelectplot <- function(arimaSelect.out,noms,choix){
noms <- names(arimaSelect.out[[3]][[1]]$coef)
coeff <- arimaSelect.out[[1]]
k <- min(which(is.na(coeff[,1])))-1
coeff <- coeff[1:k,]
pval <- arimaSelect.out[[2]][1:k,]
aic <- arimaSelect.out$aic[1:k]
coeff[coeff==0] <- NA
n <- ncol(coeff)
if(missing(choix)) choix <- k
layout(matrix(c(1,1,1,2,
3,3,3,2,
3,3,3,4,
5,6,7,7),nr=4),
widths=c(10,35,45,15),
heights=c(30,30,15,15))
couleurs <- rainbow(75)[1:50]#(50)
ticks <- pretty(coeff)
par(mar=c(1,1,3,1))
plot(aic,k:1-.5,type='o',pch=21,bg='blue',cex=2,axes=F,lty=2,xpd=NA)
points(aic[choix],k-choix+.5,pch=21,cex=4,bg=2,xpd=NA)
title('aic',line=2)
par(mar=c(3,0,0,0))
plot(0,axes=F,xlab='',ylab='',xlim=range(ticks),ylim=c(.1,1))
rect(xleft = min(ticks) + (0:49)/50*(max(ticks)-min(ticks)),
xright = min(ticks) + (1:50)/50*(max(ticks)-min(ticks)),
ytop = rep(1,50),
ybottom= rep(0,50),col=couleurs,border=NA)
axis(1,ticks)
rect(xleft=min(ticks),xright=max(ticks),ytop=1,ybottom=0)
text(mean(coeff,na.rm=T),.5,'coefficients',cex=2,font=2)
par(mar=c(1,1,3,1))
image(1:n,1:k,t(coeff[k:1,]),axes=F,col=couleurs,zlim=range(ticks))
for(i in 1:n) for(j in 1:k) if(!is.na(coeff[j,i])) {
if(pval[j,i]<.01) symb = 'green'
else if( (pval[j,i]<.05) & (pval[j,i]>=.01)) symb = 'orange'
else if( (pval[j,i]<.1) & (pval[j,i]>=.05)) symb = 'red'
else symb = 'black'
polygon(c(i+.5 ,i+.2 ,i+.5 ,i+.5),
c(k-j+0.5,k-j+0.5,k-j+0.8,k-j+0.5),
col=symb)
if(j==choix) {
rect(xleft=i-.5,
xright=i+.5,
ybottom=k-j+1.5,
ytop=k-j+.5,
lwd=4)
text(i,
k-j+1,
round(coeff[j,i],2),
cex=1.2,
font=2)
}
else{
rect(xleft=i-.5,xright=i+.5,ybottom=k-j+1.5,ytop=k-j+.5)
text(i,k-j+1,round(coeff[j,i],2),cex=1.2,font=1)
}
}
axis(3,1:n,noms)
par(mar=c(0.5,0,0,0.5))
plot(0,axes=F,xlab='',ylab='',type='n',xlim=c(0,8),ylim=c(-.2,.8))
cols <- c('green','orange','red','black')
niv <- c('0','0.01','0.05','0.1')
for(i in 0:3){
polygon(c(1+2*i ,1+2*i ,1+2*i-.5 ,1+2*i),
c(.4 ,.7 , .4 , .4),
col=cols[i+1])
text(2*i,0.5,niv[i+1],cex=1.5)
}
text(8,.5,1,cex=1.5)
text(4,0,'p-value',cex=2)
box()
residus <- arimaSelect.out[[3]][[choix]]$res
par(mar=c(1,2,4,1))
acf(residus,main='')
title('acf',line=.5)
par(mar=c(1,2,4,1))
pacf(residus,main='')
title('pacf',line=.5)
par(mar=c(2,2,4,1))
qqnorm(residus,main='')
title('qq-norm',line=.5)
residus
}
if (par2 == 0) x <- log(x)
if (par2 != 0) x <- x^par2
(selection <- arimaSelect(x, order=c(par6,par3,par7), seasonal=list(order=c(par8,par4,par9), period=par5)))
bitmap(file='test1.png')
resid <- arimaSelectplot(selection)
dev.off()
resid
bitmap(file='test2.png')
acf(resid,length(resid)/2, main='Residual Autocorrelation Function')
dev.off()
bitmap(file='test3.png')
pacf(resid,length(resid)/2, main='Residual Partial Autocorrelation Function')
dev.off()
bitmap(file='test4.png')
cpgram(resid, main='Residual Cumulative Periodogram')
dev.off()
bitmap(file='test5.png')
hist(resid, main='Residual Histogram', xlab='values of Residuals')
dev.off()
bitmap(file='test6.png')
densityplot(~resid,col='black',main='Residual Density Plot', xlab='values of Residuals')
dev.off()
bitmap(file='test7.png')
qqnorm(resid, main='Residual Normal Q-Q Plot')
dev.off()
ncols <- length(selection[[1]][1,])
nrows <- length(selection[[2]][,1])-1
load(file='createtable')
a<-table.start()
a<-table.row.start(a)
a<-table.element(a,'ARIMA Parameter Estimation and Backward Selection', ncols+1,TRUE)
a<-table.row.end(a)
a<-table.row.start(a)
a<-table.element(a,'Iteration', header=TRUE)
for (i in 1:ncols) {
a<-table.element(a,names(selection[[3]][[1]]$coef)[i],header=TRUE)
}
a<-table.row.end(a)
for (j in 1:nrows) {
a<-table.row.start(a)
mydum <- 'Estimates ('
mydum <- paste(mydum,j)
mydum <- paste(mydum,')')
a<-table.element(a,mydum, header=TRUE)
for (i in 1:ncols) {
a<-table.element(a,round(selection[[1]][j,i],4))
}
a<-table.row.end(a)
a<-table.row.start(a)
a<-table.element(a,'(p-val)', header=TRUE)
for (i in 1:ncols) {
mydum <- '('
mydum <- paste(mydum,round(selection[[2]][j,i],4),sep='')
mydum <- paste(mydum,')')
a<-table.element(a,mydum)
}
a<-table.row.end(a)
}
a<-table.end(a)
table.save(a,file='mytable.tab')
a<-table.start()
a<-table.row.start(a)
a<-table.element(a,'Estimated ARIMA Residuals', 1,TRUE)
a<-table.row.end(a)
a<-table.row.start(a)
a<-table.element(a,'Value', 1,TRUE)
a<-table.row.end(a)
for (i in (par4*par5+par3):length(resid)) {
a<-table.row.start(a)
a<-table.element(a,resid[i])
a<-table.row.end(a)
}
a<-table.end(a)
table.save(a,file='mytable1.tab')