Free Statistics

of Irreproducible Research!

Author's title

Author*Unverified author*
R Software Modulerwasp_autocorrelation.wasp
Title produced by software(Partial) Autocorrelation Function
Date of computationSat, 01 Dec 2007 06:14:05 -0700
Cite this page as followsStatistical Computations at FreeStatistics.org, Office for Research Development and Education, URL https://freestatistics.org/blog/index.php?v=date/2007/Dec/01/t119651419234z44bw98frca86.htm/, Retrieved Sun, 19 May 2024 20:22:34 +0000
Statistical Computations at FreeStatistics.org, Office for Research Development and Education, URL https://freestatistics.org/blog/index.php?pk=2249, Retrieved Sun, 19 May 2024 20:22:34 +0000
QR Codes:

Original text written by user:
IsPrivate?No (this computation is public)
User-defined keywords
Estimated Impact202
Family? (F = Feedback message, R = changed R code, M = changed R Module, P = changed Parameters, D = changed Data)
-       [(Partial) Autocorrelation Function] [autocorrelatie au...] [2007-12-01 13:14:05] [bd02e85be52eb1cb060a2c60779eb820] [Current]
Feedback Forum

Post a new message
Dataseries X:
27
-36
23
23
23
0
0
36
0
-22
-22
-50
0
0
-23
0
-23
-23
-23
-23
-23
0
-36
23
-13
23
0
59
23
0
0
0
0
0
36
36
-36
0
0
-36
0
-36
-36
-35
-34
-26
-59
-28
0
0
0
0
0
0
0
0
0
0
-42
-43
-45
-33
-34
-36
0
0
0
-40
0
-15
25
-15
-15
0
-62
-25
0
0
0
0
0
-22
-22
-22
0
0
-26
-27
-27
-30
-27
-39
-40
7
5
3
-10
-45
-34
-35
-36
-37
-38
-42
-42
-42
-44
-74


Summary of compuational transaction
Raw Inputview raw input (R code)
Raw Outputview raw output of R engine
Computing time3 seconds
R Server'Herman Ole Andreas Wold' @ 193.190.124.10:1001

\begin{tabular}{lllllllll}
\hline
Summary of compuational transaction \tabularnewline
Raw Input & view raw input (R code)  \tabularnewline
Raw Output & view raw output of R engine  \tabularnewline
Computing time & 3 seconds \tabularnewline
R Server & 'Herman Ole Andreas Wold' @ 193.190.124.10:1001 \tabularnewline
\hline
\end{tabular}
%Source: https://freestatistics.org/blog/index.php?pk=2249&T=0

[TABLE]
[ROW][C]Summary of compuational transaction[/C][/ROW]
[ROW][C]Raw Input[/C][C]view raw input (R code) [/C][/ROW]
[ROW][C]Raw Output[/C][C]view raw output of R engine [/C][/ROW]
[ROW][C]Computing time[/C][C]3 seconds[/C][/ROW]
[ROW][C]R Server[/C][C]'Herman Ole Andreas Wold' @ 193.190.124.10:1001[/C][/ROW]
[/TABLE]
Source: https://freestatistics.org/blog/index.php?pk=2249&T=0

Globally Unique Identifier (entire table): ba.freestatistics.org/blog/index.php?pk=2249&T=0

As an alternative you can also use a QR Code:  

The GUIDs for individual cells are displayed in the table below:

Summary of compuational transaction
Raw Inputview raw input (R code)
Raw Outputview raw output of R engine
Computing time3 seconds
R Server'Herman Ole Andreas Wold' @ 193.190.124.10:1001


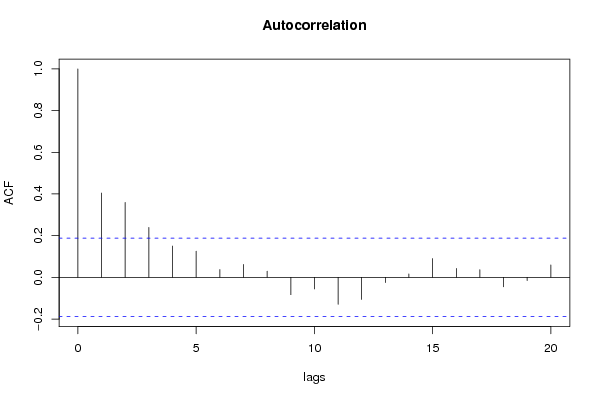
Autocorrelation Function
Time lag kACF(k)T-STATP-value
0110.39230
10.40434.20162.7e-05
20.3593993.7350.000151
30.2397212.49130.007125
40.1501851.56080.060752
50.1257721.30710.096984
60.0374420.38910.34898
70.0620540.64490.260184
80.0294260.30580.380172
9-0.083378-0.86650.805928
10-0.055488-0.57660.717311
11-0.129188-1.34260.908885
12-0.105735-1.09880.862857
13-0.025283-0.26270.603377
140.0164990.17150.432088
150.0901050.93640.175579
160.0427320.44410.328936
170.0365990.38030.352217
18-0.045307-0.47080.680648
19-0.015526-0.16140.563942

\begin{tabular}{lllllllll}
\hline
Autocorrelation Function \tabularnewline
Time lag k & ACF(k) & T-STAT & P-value \tabularnewline
0 & 1 & 10.3923 & 0 \tabularnewline
1 & 0.4043 & 4.2016 & 2.7e-05 \tabularnewline
2 & 0.359399 & 3.735 & 0.000151 \tabularnewline
3 & 0.239721 & 2.4913 & 0.007125 \tabularnewline
4 & 0.150185 & 1.5608 & 0.060752 \tabularnewline
5 & 0.125772 & 1.3071 & 0.096984 \tabularnewline
6 & 0.037442 & 0.3891 & 0.34898 \tabularnewline
7 & 0.062054 & 0.6449 & 0.260184 \tabularnewline
8 & 0.029426 & 0.3058 & 0.380172 \tabularnewline
9 & -0.083378 & -0.8665 & 0.805928 \tabularnewline
10 & -0.055488 & -0.5766 & 0.717311 \tabularnewline
11 & -0.129188 & -1.3426 & 0.908885 \tabularnewline
12 & -0.105735 & -1.0988 & 0.862857 \tabularnewline
13 & -0.025283 & -0.2627 & 0.603377 \tabularnewline
14 & 0.016499 & 0.1715 & 0.432088 \tabularnewline
15 & 0.090105 & 0.9364 & 0.175579 \tabularnewline
16 & 0.042732 & 0.4441 & 0.328936 \tabularnewline
17 & 0.036599 & 0.3803 & 0.352217 \tabularnewline
18 & -0.045307 & -0.4708 & 0.680648 \tabularnewline
19 & -0.015526 & -0.1614 & 0.563942 \tabularnewline
\hline
\end{tabular}
%Source: https://freestatistics.org/blog/index.php?pk=2249&T=1

[TABLE]
[ROW][C]Autocorrelation Function[/C][/ROW]
[ROW][C]Time lag k[/C][C]ACF(k)[/C][C]T-STAT[/C][C]P-value[/C][/ROW]
[ROW][C]0[/C][C]1[/C][C]10.3923[/C][C]0[/C][/ROW]
[ROW][C]1[/C][C]0.4043[/C][C]4.2016[/C][C]2.7e-05[/C][/ROW]
[ROW][C]2[/C][C]0.359399[/C][C]3.735[/C][C]0.000151[/C][/ROW]
[ROW][C]3[/C][C]0.239721[/C][C]2.4913[/C][C]0.007125[/C][/ROW]
[ROW][C]4[/C][C]0.150185[/C][C]1.5608[/C][C]0.060752[/C][/ROW]
[ROW][C]5[/C][C]0.125772[/C][C]1.3071[/C][C]0.096984[/C][/ROW]
[ROW][C]6[/C][C]0.037442[/C][C]0.3891[/C][C]0.34898[/C][/ROW]
[ROW][C]7[/C][C]0.062054[/C][C]0.6449[/C][C]0.260184[/C][/ROW]
[ROW][C]8[/C][C]0.029426[/C][C]0.3058[/C][C]0.380172[/C][/ROW]
[ROW][C]9[/C][C]-0.083378[/C][C]-0.8665[/C][C]0.805928[/C][/ROW]
[ROW][C]10[/C][C]-0.055488[/C][C]-0.5766[/C][C]0.717311[/C][/ROW]
[ROW][C]11[/C][C]-0.129188[/C][C]-1.3426[/C][C]0.908885[/C][/ROW]
[ROW][C]12[/C][C]-0.105735[/C][C]-1.0988[/C][C]0.862857[/C][/ROW]
[ROW][C]13[/C][C]-0.025283[/C][C]-0.2627[/C][C]0.603377[/C][/ROW]
[ROW][C]14[/C][C]0.016499[/C][C]0.1715[/C][C]0.432088[/C][/ROW]
[ROW][C]15[/C][C]0.090105[/C][C]0.9364[/C][C]0.175579[/C][/ROW]
[ROW][C]16[/C][C]0.042732[/C][C]0.4441[/C][C]0.328936[/C][/ROW]
[ROW][C]17[/C][C]0.036599[/C][C]0.3803[/C][C]0.352217[/C][/ROW]
[ROW][C]18[/C][C]-0.045307[/C][C]-0.4708[/C][C]0.680648[/C][/ROW]
[ROW][C]19[/C][C]-0.015526[/C][C]-0.1614[/C][C]0.563942[/C][/ROW]
[/TABLE]
Source: https://freestatistics.org/blog/index.php?pk=2249&T=1

Globally Unique Identifier (entire table): ba.freestatistics.org/blog/index.php?pk=2249&T=1

As an alternative you can also use a QR Code:  

The GUIDs for individual cells are displayed in the table below:

Autocorrelation Function
Time lag kACF(k)T-STATP-value
0110.39230
10.40434.20162.7e-05
20.3593993.7350.000151
30.2397212.49130.007125
40.1501851.56080.060752
50.1257721.30710.096984
60.0374420.38910.34898
70.0620540.64490.260184
80.0294260.30580.380172
9-0.083378-0.86650.805928
10-0.055488-0.57660.717311
11-0.129188-1.34260.908885
12-0.105735-1.09880.862857
13-0.025283-0.26270.603377
140.0164990.17150.432088
150.0901050.93640.175579
160.0427320.44410.328936
170.0365990.38030.352217
18-0.045307-0.47080.680648
19-0.015526-0.16140.563942


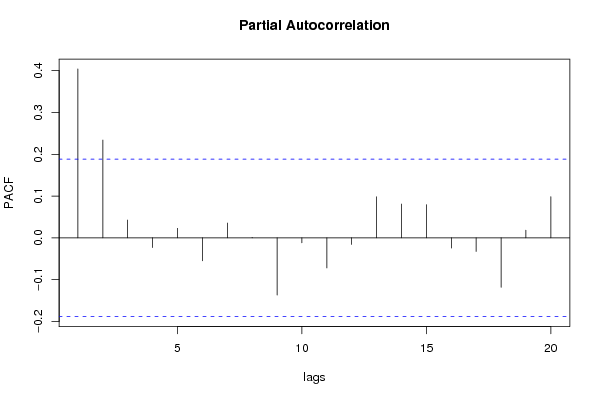
Partial Autocorrelation Function
Time lag kPACF(k)T-STATP-value
00.40434.20162.7e-05
10.2342282.43420.008283
20.0426890.44360.329095
3-0.023222-0.24130.595121
40.0227720.23660.406689
5-0.054912-0.57070.715295
60.035510.3690.356415
70.0011140.01160.495394
8-0.136883-1.42250.921122
9-0.011733-0.12190.548409
10-0.071864-0.74680.771607
11-0.015746-0.16360.56484
120.0981511.020.155
130.0810260.8420.200811
140.0794130.82530.205515
15-0.024458-0.25420.60008
16-0.032558-0.33840.632123
17-0.118288-1.22930.889182
180.0184730.1920.424059
190.0985241.02390.154087

\begin{tabular}{lllllllll}
\hline
Partial Autocorrelation Function \tabularnewline
Time lag k & PACF(k) & T-STAT & P-value \tabularnewline
0 & 0.4043 & 4.2016 & 2.7e-05 \tabularnewline
1 & 0.234228 & 2.4342 & 0.008283 \tabularnewline
2 & 0.042689 & 0.4436 & 0.329095 \tabularnewline
3 & -0.023222 & -0.2413 & 0.595121 \tabularnewline
4 & 0.022772 & 0.2366 & 0.406689 \tabularnewline
5 & -0.054912 & -0.5707 & 0.715295 \tabularnewline
6 & 0.03551 & 0.369 & 0.356415 \tabularnewline
7 & 0.001114 & 0.0116 & 0.495394 \tabularnewline
8 & -0.136883 & -1.4225 & 0.921122 \tabularnewline
9 & -0.011733 & -0.1219 & 0.548409 \tabularnewline
10 & -0.071864 & -0.7468 & 0.771607 \tabularnewline
11 & -0.015746 & -0.1636 & 0.56484 \tabularnewline
12 & 0.098151 & 1.02 & 0.155 \tabularnewline
13 & 0.081026 & 0.842 & 0.200811 \tabularnewline
14 & 0.079413 & 0.8253 & 0.205515 \tabularnewline
15 & -0.024458 & -0.2542 & 0.60008 \tabularnewline
16 & -0.032558 & -0.3384 & 0.632123 \tabularnewline
17 & -0.118288 & -1.2293 & 0.889182 \tabularnewline
18 & 0.018473 & 0.192 & 0.424059 \tabularnewline
19 & 0.098524 & 1.0239 & 0.154087 \tabularnewline
\hline
\end{tabular}
%Source: https://freestatistics.org/blog/index.php?pk=2249&T=2

[TABLE]
[ROW][C]Partial Autocorrelation Function[/C][/ROW]
[ROW][C]Time lag k[/C][C]PACF(k)[/C][C]T-STAT[/C][C]P-value[/C][/ROW]
[ROW][C]0[/C][C]0.4043[/C][C]4.2016[/C][C]2.7e-05[/C][/ROW]
[ROW][C]1[/C][C]0.234228[/C][C]2.4342[/C][C]0.008283[/C][/ROW]
[ROW][C]2[/C][C]0.042689[/C][C]0.4436[/C][C]0.329095[/C][/ROW]
[ROW][C]3[/C][C]-0.023222[/C][C]-0.2413[/C][C]0.595121[/C][/ROW]
[ROW][C]4[/C][C]0.022772[/C][C]0.2366[/C][C]0.406689[/C][/ROW]
[ROW][C]5[/C][C]-0.054912[/C][C]-0.5707[/C][C]0.715295[/C][/ROW]
[ROW][C]6[/C][C]0.03551[/C][C]0.369[/C][C]0.356415[/C][/ROW]
[ROW][C]7[/C][C]0.001114[/C][C]0.0116[/C][C]0.495394[/C][/ROW]
[ROW][C]8[/C][C]-0.136883[/C][C]-1.4225[/C][C]0.921122[/C][/ROW]
[ROW][C]9[/C][C]-0.011733[/C][C]-0.1219[/C][C]0.548409[/C][/ROW]
[ROW][C]10[/C][C]-0.071864[/C][C]-0.7468[/C][C]0.771607[/C][/ROW]
[ROW][C]11[/C][C]-0.015746[/C][C]-0.1636[/C][C]0.56484[/C][/ROW]
[ROW][C]12[/C][C]0.098151[/C][C]1.02[/C][C]0.155[/C][/ROW]
[ROW][C]13[/C][C]0.081026[/C][C]0.842[/C][C]0.200811[/C][/ROW]
[ROW][C]14[/C][C]0.079413[/C][C]0.8253[/C][C]0.205515[/C][/ROW]
[ROW][C]15[/C][C]-0.024458[/C][C]-0.2542[/C][C]0.60008[/C][/ROW]
[ROW][C]16[/C][C]-0.032558[/C][C]-0.3384[/C][C]0.632123[/C][/ROW]
[ROW][C]17[/C][C]-0.118288[/C][C]-1.2293[/C][C]0.889182[/C][/ROW]
[ROW][C]18[/C][C]0.018473[/C][C]0.192[/C][C]0.424059[/C][/ROW]
[ROW][C]19[/C][C]0.098524[/C][C]1.0239[/C][C]0.154087[/C][/ROW]
[/TABLE]
Source: https://freestatistics.org/blog/index.php?pk=2249&T=2

Globally Unique Identifier (entire table): ba.freestatistics.org/blog/index.php?pk=2249&T=2

As an alternative you can also use a QR Code:  

The GUIDs for individual cells are displayed in the table below:

Partial Autocorrelation Function
Time lag kPACF(k)T-STATP-value
00.40434.20162.7e-05
10.2342282.43420.008283
20.0426890.44360.329095
3-0.023222-0.24130.595121
40.0227720.23660.406689
5-0.054912-0.57070.715295
60.035510.3690.356415
70.0011140.01160.495394
8-0.136883-1.42250.921122
9-0.011733-0.12190.548409
10-0.071864-0.74680.771607
11-0.015746-0.16360.56484
120.0981511.020.155
130.0810260.8420.200811
140.0794130.82530.205515
15-0.024458-0.25420.60008
16-0.032558-0.33840.632123
17-0.118288-1.22930.889182
180.0184730.1920.424059
190.0985241.02390.154087


Parameters (Session):
par1 = Default ; par2 = 1 ; par3 = 1 ; par4 = 0 ; par5 = 12 ;
Parameters (R input):
par1 = Default ; par2 = 1 ; par3 = 0 ; par4 = 0 ; par5 = 12 ;
R code (references can be found in the software module):
if (par1 == 'Default') {
par1 = 10*log10(length(x))
} else {
par1 <- as.numeric(par1)
}
par2 <- as.numeric(par2)
par3 <- as.numeric(par3)
par4 <- as.numeric(par4)
par5 <- as.numeric(par5)
if (par2 == 0) {
x <- log(x)
} else {
x <- (x ^ par2 - 1) / par2
}
if (par3 > 0) x <- diff(x,lag=1,difference=par3)
if (par4 > 0) x <- diff(x,lag=par5,difference=par4)
bitmap(file='pic1.png')
racf <- acf(x,par1,main='Autocorrelation',xlab='lags',ylab='ACF')
dev.off()
bitmap(file='pic2.png')
rpacf <- pacf(x,par1,main='Partial Autocorrelation',xlab='lags',ylab='PACF')
dev.off()
(myacf <- c(racf$acf))
(mypacf <- c(rpacf$acf))
lengthx <- length(x)
sqrtn <- sqrt(lengthx)
load(file='createtable')
a<-table.start()
a<-table.row.start(a)
a<-table.element(a,'Autocorrelation Function',4,TRUE)
a<-table.row.end(a)
a<-table.row.start(a)
a<-table.element(a,'Time lag k',header=TRUE)
a<-table.element(a,hyperlink('basics.htm','ACF(k)','click here for more information about the Autocorrelation Function'),header=TRUE)
a<-table.element(a,'T-STAT',header=TRUE)
a<-table.element(a,'P-value',header=TRUE)
a<-table.row.end(a)
for (i in 1:par1) {
a<-table.row.start(a)
a<-table.element(a,i-1,header=TRUE)
a<-table.element(a,round(myacf[i],6))
mytstat <- myacf[i]*sqrtn
a<-table.element(a,round(mytstat,4))
a<-table.element(a,round(1-pt(mytstat,lengthx),6))
a<-table.row.end(a)
}
a<-table.end(a)
table.save(a,file='mytable.tab')
a<-table.start()
a<-table.row.start(a)
a<-table.element(a,'Partial Autocorrelation Function',4,TRUE)
a<-table.row.end(a)
a<-table.row.start(a)
a<-table.element(a,'Time lag k',header=TRUE)
a<-table.element(a,hyperlink('basics.htm','PACF(k)','click here for more information about the Partial Autocorrelation Function'),header=TRUE)
a<-table.element(a,'T-STAT',header=TRUE)
a<-table.element(a,'P-value',header=TRUE)
a<-table.row.end(a)
for (i in 1:par1) {
a<-table.row.start(a)
a<-table.element(a,i-1,header=TRUE)
a<-table.element(a,round(mypacf[i],6))
mytstat <- mypacf[i]*sqrtn
a<-table.element(a,round(mytstat,4))
a<-table.element(a,round(1-pt(mytstat,lengthx),6))
a<-table.row.end(a)
}
a<-table.end(a)
table.save(a,file='mytable1.tab')