Free Statistics

of Irreproducible Research!

Author's title

Author*Unverified author*
R Software Modulerwasp_autocorrelation.wasp
Title produced by software(Partial) Autocorrelation Function
Date of computationSat, 01 Dec 2007 05:35:10 -0700
Cite this page as followsStatistical Computations at FreeStatistics.org, Office for Research Development and Education, URL https://freestatistics.org/blog/index.php?v=date/2007/Dec/01/t1196511901x7hxud4g4pus8y2.htm/, Retrieved Sun, 19 May 2024 18:05:44 +0000
Statistical Computations at FreeStatistics.org, Office for Research Development and Education, URL https://freestatistics.org/blog/index.php?pk=2235, Retrieved Sun, 19 May 2024 18:05:44 +0000
QR Codes:

Original text written by user:
IsPrivate?No (this computation is public)
User-defined keywords
Estimated Impact241
Family? (F = Feedback message, R = changed R code, M = changed R Module, P = changed Parameters, D = changed Data)
-       [(Partial) Autocorrelation Function] [paper auto 5] [2007-12-01 12:35:10] [fef19078983b9fa83d10cb717d6f9786] [Current]
- RMPD    [Standard Deviation-Mean Plot] [SDM Plot Energieg...] [2008-12-22 07:38:48] [74be16979710d4c4e7c6647856088456]
Feedback Forum

Post a new message
Dataseries X:
105,1
113,3
99,1
100,3
93,5
98,8
106,2
98,3
102,1
117,1
101,5
80,5
105,9
109,5
97,2
114,5
93,5
100,9
121,1
116,5
109,3
118,1
108,3
105,4
116,2
111,2
105,8
122,7
99,5
107,9
124,6
115
110,3
132,7
99,7
96,5
118,7
112,9
130,5
137,9
115
116,8
140,9
120,7
134,2
147,3
112,4
107,1
128,4
137,7
135
151
137,4
132,4
161,3
139,8
146
154,6
142,1
120,5


Summary of compuational transaction
Raw Inputview raw input (R code)
Raw Outputview raw output of R engine
Computing time2 seconds
R Server'Gwilym Jenkins' @ 72.249.127.135

\begin{tabular}{lllllllll}
\hline
Summary of compuational transaction \tabularnewline
Raw Input & view raw input (R code)  \tabularnewline
Raw Output & view raw output of R engine  \tabularnewline
Computing time & 2 seconds \tabularnewline
R Server & 'Gwilym Jenkins' @ 72.249.127.135 \tabularnewline
\hline
\end{tabular}
%Source: https://freestatistics.org/blog/index.php?pk=2235&T=0

[TABLE]
[ROW][C]Summary of compuational transaction[/C][/ROW]
[ROW][C]Raw Input[/C][C]view raw input (R code) [/C][/ROW]
[ROW][C]Raw Output[/C][C]view raw output of R engine [/C][/ROW]
[ROW][C]Computing time[/C][C]2 seconds[/C][/ROW]
[ROW][C]R Server[/C][C]'Gwilym Jenkins' @ 72.249.127.135[/C][/ROW]
[/TABLE]
Source: https://freestatistics.org/blog/index.php?pk=2235&T=0

Globally Unique Identifier (entire table): ba.freestatistics.org/blog/index.php?pk=2235&T=0

As an alternative you can also use a QR Code:  

The GUIDs for individual cells are displayed in the table below:

Summary of compuational transaction
Raw Inputview raw input (R code)
Raw Outputview raw output of R engine
Computing time2 seconds
R Server'Gwilym Jenkins' @ 72.249.127.135


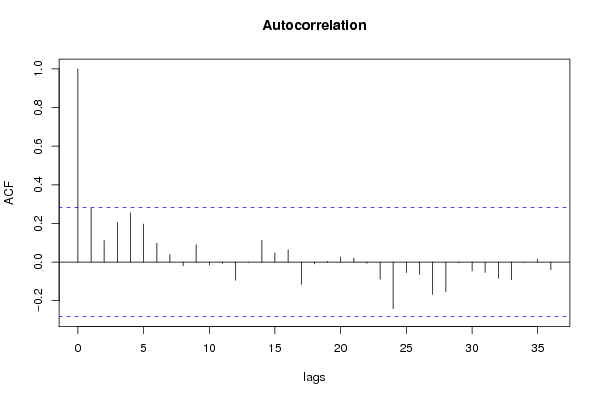
Autocorrelation Function
Time lag kACF(k)T-STATP-value
016.92820
10.2802281.94150.029042
20.1120310.77620.220727
30.2051321.42120.080863
40.2554261.76960.041569
50.1968751.3640.089467
60.0976710.67670.250927
70.0388130.26890.394578
8-0.018833-0.13050.551634
90.0888660.61570.270507
10-0.014911-0.10330.540924
11-0.007262-0.05030.51996
12-0.093814-0.650.740593
13-0.000457-0.00320.501255
140.1119680.77570.220855
150.0470230.32580.373003
160.0636070.44070.33071
17-0.11551-0.80030.786253
18-0.009907-0.06860.527219
190.00350.02420.490377
200.0265970.18430.42729
210.0207090.14350.443257
22-0.006058-0.0420.516653
23-0.089212-0.61810.730278
24-0.241381-1.67230.949518
25-0.054776-0.37950.647004
26-0.065111-0.45110.673025
27-0.167615-1.16130.874362
28-0.154202-1.06830.854646
29-0.003841-0.02660.51056
30-0.045991-0.31860.624308
31-0.053582-0.37120.643949
32-0.083954-0.58170.718239
33-0.091511-0.6340.735456
34-0.000698-0.00480.501919
350.0138030.09560.462105

\begin{tabular}{lllllllll}
\hline
Autocorrelation Function \tabularnewline
Time lag k & ACF(k) & T-STAT & P-value \tabularnewline
0 & 1 & 6.9282 & 0 \tabularnewline
1 & 0.280228 & 1.9415 & 0.029042 \tabularnewline
2 & 0.112031 & 0.7762 & 0.220727 \tabularnewline
3 & 0.205132 & 1.4212 & 0.080863 \tabularnewline
4 & 0.255426 & 1.7696 & 0.041569 \tabularnewline
5 & 0.196875 & 1.364 & 0.089467 \tabularnewline
6 & 0.097671 & 0.6767 & 0.250927 \tabularnewline
7 & 0.038813 & 0.2689 & 0.394578 \tabularnewline
8 & -0.018833 & -0.1305 & 0.551634 \tabularnewline
9 & 0.088866 & 0.6157 & 0.270507 \tabularnewline
10 & -0.014911 & -0.1033 & 0.540924 \tabularnewline
11 & -0.007262 & -0.0503 & 0.51996 \tabularnewline
12 & -0.093814 & -0.65 & 0.740593 \tabularnewline
13 & -0.000457 & -0.0032 & 0.501255 \tabularnewline
14 & 0.111968 & 0.7757 & 0.220855 \tabularnewline
15 & 0.047023 & 0.3258 & 0.373003 \tabularnewline
16 & 0.063607 & 0.4407 & 0.33071 \tabularnewline
17 & -0.11551 & -0.8003 & 0.786253 \tabularnewline
18 & -0.009907 & -0.0686 & 0.527219 \tabularnewline
19 & 0.0035 & 0.0242 & 0.490377 \tabularnewline
20 & 0.026597 & 0.1843 & 0.42729 \tabularnewline
21 & 0.020709 & 0.1435 & 0.443257 \tabularnewline
22 & -0.006058 & -0.042 & 0.516653 \tabularnewline
23 & -0.089212 & -0.6181 & 0.730278 \tabularnewline
24 & -0.241381 & -1.6723 & 0.949518 \tabularnewline
25 & -0.054776 & -0.3795 & 0.647004 \tabularnewline
26 & -0.065111 & -0.4511 & 0.673025 \tabularnewline
27 & -0.167615 & -1.1613 & 0.874362 \tabularnewline
28 & -0.154202 & -1.0683 & 0.854646 \tabularnewline
29 & -0.003841 & -0.0266 & 0.51056 \tabularnewline
30 & -0.045991 & -0.3186 & 0.624308 \tabularnewline
31 & -0.053582 & -0.3712 & 0.643949 \tabularnewline
32 & -0.083954 & -0.5817 & 0.718239 \tabularnewline
33 & -0.091511 & -0.634 & 0.735456 \tabularnewline
34 & -0.000698 & -0.0048 & 0.501919 \tabularnewline
35 & 0.013803 & 0.0956 & 0.462105 \tabularnewline
\hline
\end{tabular}
%Source: https://freestatistics.org/blog/index.php?pk=2235&T=1

[TABLE]
[ROW][C]Autocorrelation Function[/C][/ROW]
[ROW][C]Time lag k[/C][C]ACF(k)[/C][C]T-STAT[/C][C]P-value[/C][/ROW]
[ROW][C]0[/C][C]1[/C][C]6.9282[/C][C]0[/C][/ROW]
[ROW][C]1[/C][C]0.280228[/C][C]1.9415[/C][C]0.029042[/C][/ROW]
[ROW][C]2[/C][C]0.112031[/C][C]0.7762[/C][C]0.220727[/C][/ROW]
[ROW][C]3[/C][C]0.205132[/C][C]1.4212[/C][C]0.080863[/C][/ROW]
[ROW][C]4[/C][C]0.255426[/C][C]1.7696[/C][C]0.041569[/C][/ROW]
[ROW][C]5[/C][C]0.196875[/C][C]1.364[/C][C]0.089467[/C][/ROW]
[ROW][C]6[/C][C]0.097671[/C][C]0.6767[/C][C]0.250927[/C][/ROW]
[ROW][C]7[/C][C]0.038813[/C][C]0.2689[/C][C]0.394578[/C][/ROW]
[ROW][C]8[/C][C]-0.018833[/C][C]-0.1305[/C][C]0.551634[/C][/ROW]
[ROW][C]9[/C][C]0.088866[/C][C]0.6157[/C][C]0.270507[/C][/ROW]
[ROW][C]10[/C][C]-0.014911[/C][C]-0.1033[/C][C]0.540924[/C][/ROW]
[ROW][C]11[/C][C]-0.007262[/C][C]-0.0503[/C][C]0.51996[/C][/ROW]
[ROW][C]12[/C][C]-0.093814[/C][C]-0.65[/C][C]0.740593[/C][/ROW]
[ROW][C]13[/C][C]-0.000457[/C][C]-0.0032[/C][C]0.501255[/C][/ROW]
[ROW][C]14[/C][C]0.111968[/C][C]0.7757[/C][C]0.220855[/C][/ROW]
[ROW][C]15[/C][C]0.047023[/C][C]0.3258[/C][C]0.373003[/C][/ROW]
[ROW][C]16[/C][C]0.063607[/C][C]0.4407[/C][C]0.33071[/C][/ROW]
[ROW][C]17[/C][C]-0.11551[/C][C]-0.8003[/C][C]0.786253[/C][/ROW]
[ROW][C]18[/C][C]-0.009907[/C][C]-0.0686[/C][C]0.527219[/C][/ROW]
[ROW][C]19[/C][C]0.0035[/C][C]0.0242[/C][C]0.490377[/C][/ROW]
[ROW][C]20[/C][C]0.026597[/C][C]0.1843[/C][C]0.42729[/C][/ROW]
[ROW][C]21[/C][C]0.020709[/C][C]0.1435[/C][C]0.443257[/C][/ROW]
[ROW][C]22[/C][C]-0.006058[/C][C]-0.042[/C][C]0.516653[/C][/ROW]
[ROW][C]23[/C][C]-0.089212[/C][C]-0.6181[/C][C]0.730278[/C][/ROW]
[ROW][C]24[/C][C]-0.241381[/C][C]-1.6723[/C][C]0.949518[/C][/ROW]
[ROW][C]25[/C][C]-0.054776[/C][C]-0.3795[/C][C]0.647004[/C][/ROW]
[ROW][C]26[/C][C]-0.065111[/C][C]-0.4511[/C][C]0.673025[/C][/ROW]
[ROW][C]27[/C][C]-0.167615[/C][C]-1.1613[/C][C]0.874362[/C][/ROW]
[ROW][C]28[/C][C]-0.154202[/C][C]-1.0683[/C][C]0.854646[/C][/ROW]
[ROW][C]29[/C][C]-0.003841[/C][C]-0.0266[/C][C]0.51056[/C][/ROW]
[ROW][C]30[/C][C]-0.045991[/C][C]-0.3186[/C][C]0.624308[/C][/ROW]
[ROW][C]31[/C][C]-0.053582[/C][C]-0.3712[/C][C]0.643949[/C][/ROW]
[ROW][C]32[/C][C]-0.083954[/C][C]-0.5817[/C][C]0.718239[/C][/ROW]
[ROW][C]33[/C][C]-0.091511[/C][C]-0.634[/C][C]0.735456[/C][/ROW]
[ROW][C]34[/C][C]-0.000698[/C][C]-0.0048[/C][C]0.501919[/C][/ROW]
[ROW][C]35[/C][C]0.013803[/C][C]0.0956[/C][C]0.462105[/C][/ROW]
[/TABLE]
Source: https://freestatistics.org/blog/index.php?pk=2235&T=1

Globally Unique Identifier (entire table): ba.freestatistics.org/blog/index.php?pk=2235&T=1

As an alternative you can also use a QR Code:  

The GUIDs for individual cells are displayed in the table below:

Autocorrelation Function
Time lag kACF(k)T-STATP-value
016.92820
10.2802281.94150.029042
20.1120310.77620.220727
30.2051321.42120.080863
40.2554261.76960.041569
50.1968751.3640.089467
60.0976710.67670.250927
70.0388130.26890.394578
8-0.018833-0.13050.551634
90.0888660.61570.270507
10-0.014911-0.10330.540924
11-0.007262-0.05030.51996
12-0.093814-0.650.740593
13-0.000457-0.00320.501255
140.1119680.77570.220855
150.0470230.32580.373003
160.0636070.44070.33071
17-0.11551-0.80030.786253
18-0.009907-0.06860.527219
190.00350.02420.490377
200.0265970.18430.42729
210.0207090.14350.443257
22-0.006058-0.0420.516653
23-0.089212-0.61810.730278
24-0.241381-1.67230.949518
25-0.054776-0.37950.647004
26-0.065111-0.45110.673025
27-0.167615-1.16130.874362
28-0.154202-1.06830.854646
29-0.003841-0.02660.51056
30-0.045991-0.31860.624308
31-0.053582-0.37120.643949
32-0.083954-0.58170.718239
33-0.091511-0.6340.735456
34-0.000698-0.00480.501919
350.0138030.09560.462105


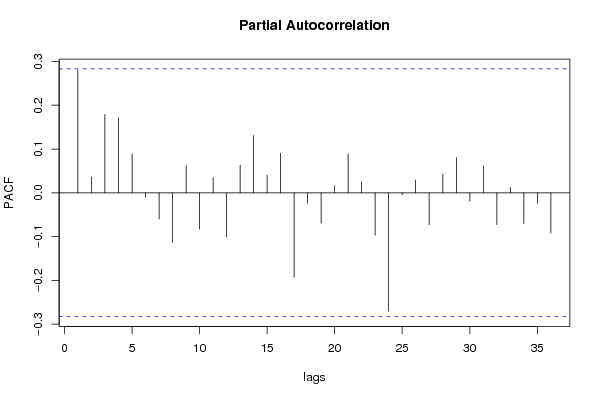
Partial Autocorrelation Function
Time lag kPACF(k)T-STATP-value
00.2802281.94150.029042
10.0363580.25190.401098
20.1789621.23990.110523
30.1712631.18650.120623
40.0884050.61250.271554
5-0.010406-0.07210.528587
6-0.059967-0.41550.660172
7-0.113243-0.78460.78172
80.0615140.42620.335941
9-0.082972-0.57480.71596
100.0349320.2420.4049
11-0.101127-0.70060.756541
120.0629850.43640.332262
130.1308230.90640.184634
140.0398630.27620.391798
150.090070.6240.267783
16-0.193045-1.33750.906312
17-0.023726-0.16440.564938
18-0.069733-0.48310.684398
190.0161220.11170.455764
200.0884990.61310.271339
210.025210.17470.431042
22-0.096785-0.67050.747139
23-0.270473-1.87390.96648
24-0.004033-0.02790.511088
250.0292160.20240.420223
26-0.072995-0.50570.692318
270.0425650.29490.384672
280.080470.55750.289884
29-0.018902-0.1310.551822
300.0610480.4230.33711
31-0.072565-0.50270.691278
320.0121710.08430.466574
33-0.070329-0.48730.685852
34-0.02396-0.1660.565573
35-0.091752-0.63570.735997

\begin{tabular}{lllllllll}
\hline
Partial Autocorrelation Function \tabularnewline
Time lag k & PACF(k) & T-STAT & P-value \tabularnewline
0 & 0.280228 & 1.9415 & 0.029042 \tabularnewline
1 & 0.036358 & 0.2519 & 0.401098 \tabularnewline
2 & 0.178962 & 1.2399 & 0.110523 \tabularnewline
3 & 0.171263 & 1.1865 & 0.120623 \tabularnewline
4 & 0.088405 & 0.6125 & 0.271554 \tabularnewline
5 & -0.010406 & -0.0721 & 0.528587 \tabularnewline
6 & -0.059967 & -0.4155 & 0.660172 \tabularnewline
7 & -0.113243 & -0.7846 & 0.78172 \tabularnewline
8 & 0.061514 & 0.4262 & 0.335941 \tabularnewline
9 & -0.082972 & -0.5748 & 0.71596 \tabularnewline
10 & 0.034932 & 0.242 & 0.4049 \tabularnewline
11 & -0.101127 & -0.7006 & 0.756541 \tabularnewline
12 & 0.062985 & 0.4364 & 0.332262 \tabularnewline
13 & 0.130823 & 0.9064 & 0.184634 \tabularnewline
14 & 0.039863 & 0.2762 & 0.391798 \tabularnewline
15 & 0.09007 & 0.624 & 0.267783 \tabularnewline
16 & -0.193045 & -1.3375 & 0.906312 \tabularnewline
17 & -0.023726 & -0.1644 & 0.564938 \tabularnewline
18 & -0.069733 & -0.4831 & 0.684398 \tabularnewline
19 & 0.016122 & 0.1117 & 0.455764 \tabularnewline
20 & 0.088499 & 0.6131 & 0.271339 \tabularnewline
21 & 0.02521 & 0.1747 & 0.431042 \tabularnewline
22 & -0.096785 & -0.6705 & 0.747139 \tabularnewline
23 & -0.270473 & -1.8739 & 0.96648 \tabularnewline
24 & -0.004033 & -0.0279 & 0.511088 \tabularnewline
25 & 0.029216 & 0.2024 & 0.420223 \tabularnewline
26 & -0.072995 & -0.5057 & 0.692318 \tabularnewline
27 & 0.042565 & 0.2949 & 0.384672 \tabularnewline
28 & 0.08047 & 0.5575 & 0.289884 \tabularnewline
29 & -0.018902 & -0.131 & 0.551822 \tabularnewline
30 & 0.061048 & 0.423 & 0.33711 \tabularnewline
31 & -0.072565 & -0.5027 & 0.691278 \tabularnewline
32 & 0.012171 & 0.0843 & 0.466574 \tabularnewline
33 & -0.070329 & -0.4873 & 0.685852 \tabularnewline
34 & -0.02396 & -0.166 & 0.565573 \tabularnewline
35 & -0.091752 & -0.6357 & 0.735997 \tabularnewline
\hline
\end{tabular}
%Source: https://freestatistics.org/blog/index.php?pk=2235&T=2

[TABLE]
[ROW][C]Partial Autocorrelation Function[/C][/ROW]
[ROW][C]Time lag k[/C][C]PACF(k)[/C][C]T-STAT[/C][C]P-value[/C][/ROW]
[ROW][C]0[/C][C]0.280228[/C][C]1.9415[/C][C]0.029042[/C][/ROW]
[ROW][C]1[/C][C]0.036358[/C][C]0.2519[/C][C]0.401098[/C][/ROW]
[ROW][C]2[/C][C]0.178962[/C][C]1.2399[/C][C]0.110523[/C][/ROW]
[ROW][C]3[/C][C]0.171263[/C][C]1.1865[/C][C]0.120623[/C][/ROW]
[ROW][C]4[/C][C]0.088405[/C][C]0.6125[/C][C]0.271554[/C][/ROW]
[ROW][C]5[/C][C]-0.010406[/C][C]-0.0721[/C][C]0.528587[/C][/ROW]
[ROW][C]6[/C][C]-0.059967[/C][C]-0.4155[/C][C]0.660172[/C][/ROW]
[ROW][C]7[/C][C]-0.113243[/C][C]-0.7846[/C][C]0.78172[/C][/ROW]
[ROW][C]8[/C][C]0.061514[/C][C]0.4262[/C][C]0.335941[/C][/ROW]
[ROW][C]9[/C][C]-0.082972[/C][C]-0.5748[/C][C]0.71596[/C][/ROW]
[ROW][C]10[/C][C]0.034932[/C][C]0.242[/C][C]0.4049[/C][/ROW]
[ROW][C]11[/C][C]-0.101127[/C][C]-0.7006[/C][C]0.756541[/C][/ROW]
[ROW][C]12[/C][C]0.062985[/C][C]0.4364[/C][C]0.332262[/C][/ROW]
[ROW][C]13[/C][C]0.130823[/C][C]0.9064[/C][C]0.184634[/C][/ROW]
[ROW][C]14[/C][C]0.039863[/C][C]0.2762[/C][C]0.391798[/C][/ROW]
[ROW][C]15[/C][C]0.09007[/C][C]0.624[/C][C]0.267783[/C][/ROW]
[ROW][C]16[/C][C]-0.193045[/C][C]-1.3375[/C][C]0.906312[/C][/ROW]
[ROW][C]17[/C][C]-0.023726[/C][C]-0.1644[/C][C]0.564938[/C][/ROW]
[ROW][C]18[/C][C]-0.069733[/C][C]-0.4831[/C][C]0.684398[/C][/ROW]
[ROW][C]19[/C][C]0.016122[/C][C]0.1117[/C][C]0.455764[/C][/ROW]
[ROW][C]20[/C][C]0.088499[/C][C]0.6131[/C][C]0.271339[/C][/ROW]
[ROW][C]21[/C][C]0.02521[/C][C]0.1747[/C][C]0.431042[/C][/ROW]
[ROW][C]22[/C][C]-0.096785[/C][C]-0.6705[/C][C]0.747139[/C][/ROW]
[ROW][C]23[/C][C]-0.270473[/C][C]-1.8739[/C][C]0.96648[/C][/ROW]
[ROW][C]24[/C][C]-0.004033[/C][C]-0.0279[/C][C]0.511088[/C][/ROW]
[ROW][C]25[/C][C]0.029216[/C][C]0.2024[/C][C]0.420223[/C][/ROW]
[ROW][C]26[/C][C]-0.072995[/C][C]-0.5057[/C][C]0.692318[/C][/ROW]
[ROW][C]27[/C][C]0.042565[/C][C]0.2949[/C][C]0.384672[/C][/ROW]
[ROW][C]28[/C][C]0.08047[/C][C]0.5575[/C][C]0.289884[/C][/ROW]
[ROW][C]29[/C][C]-0.018902[/C][C]-0.131[/C][C]0.551822[/C][/ROW]
[ROW][C]30[/C][C]0.061048[/C][C]0.423[/C][C]0.33711[/C][/ROW]
[ROW][C]31[/C][C]-0.072565[/C][C]-0.5027[/C][C]0.691278[/C][/ROW]
[ROW][C]32[/C][C]0.012171[/C][C]0.0843[/C][C]0.466574[/C][/ROW]
[ROW][C]33[/C][C]-0.070329[/C][C]-0.4873[/C][C]0.685852[/C][/ROW]
[ROW][C]34[/C][C]-0.02396[/C][C]-0.166[/C][C]0.565573[/C][/ROW]
[ROW][C]35[/C][C]-0.091752[/C][C]-0.6357[/C][C]0.735997[/C][/ROW]
[/TABLE]
Source: https://freestatistics.org/blog/index.php?pk=2235&T=2

Globally Unique Identifier (entire table): ba.freestatistics.org/blog/index.php?pk=2235&T=2

As an alternative you can also use a QR Code:  

The GUIDs for individual cells are displayed in the table below:

Partial Autocorrelation Function
Time lag kPACF(k)T-STATP-value
00.2802281.94150.029042
10.0363580.25190.401098
20.1789621.23990.110523
30.1712631.18650.120623
40.0884050.61250.271554
5-0.010406-0.07210.528587
6-0.059967-0.41550.660172
7-0.113243-0.78460.78172
80.0615140.42620.335941
9-0.082972-0.57480.71596
100.0349320.2420.4049
11-0.101127-0.70060.756541
120.0629850.43640.332262
130.1308230.90640.184634
140.0398630.27620.391798
150.090070.6240.267783
16-0.193045-1.33750.906312
17-0.023726-0.16440.564938
18-0.069733-0.48310.684398
190.0161220.11170.455764
200.0884990.61310.271339
210.025210.17470.431042
22-0.096785-0.67050.747139
23-0.270473-1.87390.96648
24-0.004033-0.02790.511088
250.0292160.20240.420223
26-0.072995-0.50570.692318
270.0425650.29490.384672
280.080470.55750.289884
29-0.018902-0.1310.551822
300.0610480.4230.33711
31-0.072565-0.50270.691278
320.0121710.08430.466574
33-0.070329-0.48730.685852
34-0.02396-0.1660.565573
35-0.091752-0.63570.735997


Parameters (Session):
par1 = 36 ; par2 = 1 ; par3 = 0 ; par4 = 1 ; par5 = 12 ;
Parameters (R input):
par1 = 36 ; par2 = 1 ; par3 = 0 ; par4 = 1 ; par5 = 12 ;
R code (references can be found in the software module):
if (par1 == 'Default') {
par1 = 10*log10(length(x))
} else {
par1 <- as.numeric(par1)
}
par2 <- as.numeric(par2)
par3 <- as.numeric(par3)
par4 <- as.numeric(par4)
par5 <- as.numeric(par5)
if (par2 == 0) {
x <- log(x)
} else {
x <- (x ^ par2 - 1) / par2
}
if (par3 > 0) x <- diff(x,lag=1,difference=par3)
if (par4 > 0) x <- diff(x,lag=par5,difference=par4)
bitmap(file='pic1.png')
racf <- acf(x,par1,main='Autocorrelation',xlab='lags',ylab='ACF')
dev.off()
bitmap(file='pic2.png')
rpacf <- pacf(x,par1,main='Partial Autocorrelation',xlab='lags',ylab='PACF')
dev.off()
(myacf <- c(racf$acf))
(mypacf <- c(rpacf$acf))
lengthx <- length(x)
sqrtn <- sqrt(lengthx)
load(file='createtable')
a<-table.start()
a<-table.row.start(a)
a<-table.element(a,'Autocorrelation Function',4,TRUE)
a<-table.row.end(a)
a<-table.row.start(a)
a<-table.element(a,'Time lag k',header=TRUE)
a<-table.element(a,hyperlink('basics.htm','ACF(k)','click here for more information about the Autocorrelation Function'),header=TRUE)
a<-table.element(a,'T-STAT',header=TRUE)
a<-table.element(a,'P-value',header=TRUE)
a<-table.row.end(a)
for (i in 1:par1) {
a<-table.row.start(a)
a<-table.element(a,i-1,header=TRUE)
a<-table.element(a,round(myacf[i],6))
mytstat <- myacf[i]*sqrtn
a<-table.element(a,round(mytstat,4))
a<-table.element(a,round(1-pt(mytstat,lengthx),6))
a<-table.row.end(a)
}
a<-table.end(a)
table.save(a,file='mytable.tab')
a<-table.start()
a<-table.row.start(a)
a<-table.element(a,'Partial Autocorrelation Function',4,TRUE)
a<-table.row.end(a)
a<-table.row.start(a)
a<-table.element(a,'Time lag k',header=TRUE)
a<-table.element(a,hyperlink('basics.htm','PACF(k)','click here for more information about the Partial Autocorrelation Function'),header=TRUE)
a<-table.element(a,'T-STAT',header=TRUE)
a<-table.element(a,'P-value',header=TRUE)
a<-table.row.end(a)
for (i in 1:par1) {
a<-table.row.start(a)
a<-table.element(a,i-1,header=TRUE)
a<-table.element(a,round(mypacf[i],6))
mytstat <- mypacf[i]*sqrtn
a<-table.element(a,round(mytstat,4))
a<-table.element(a,round(1-pt(mytstat,lengthx),6))
a<-table.row.end(a)
}
a<-table.end(a)
table.save(a,file='mytable1.tab')