Free Statistics

of Irreproducible Research!

Author's title

Author*Unverified author*
R Software Modulerwasp_autocorrelation.wasp
Title produced by software(Partial) Autocorrelation Function
Date of computationSat, 01 Dec 2007 05:30:22 -0700
Cite this page as followsStatistical Computations at FreeStatistics.org, Office for Research Development and Education, URL https://freestatistics.org/blog/index.php?v=date/2007/Dec/01/t11965116236olbpbfh299ruhu.htm/, Retrieved Sun, 19 May 2024 18:46:47 +0000
Statistical Computations at FreeStatistics.org, Office for Research Development and Education, URL https://freestatistics.org/blog/index.php?pk=2233, Retrieved Sun, 19 May 2024 18:46:47 +0000
QR Codes:

Original text written by user:
IsPrivate?No (this computation is public)
User-defined keywords
Estimated Impact248
Family? (F = Feedback message, R = changed R code, M = changed R Module, P = changed Parameters, D = changed Data)
-       [(Partial) Autocorrelation Function] [paper auto 5] [2007-12-01 12:30:22] [fef19078983b9fa83d10cb717d6f9786] [Current]
-    D    [(Partial) Autocorrelation Function] [autocorrelation m...] [2008-12-16 19:14:05] [4ddbf81f78ea7c738951638c7e93f6ee]
-    D      [(Partial) Autocorrelation Function] [autocorrelation m...] [2008-12-16 19:16:48] [4ddbf81f78ea7c738951638c7e93f6ee]
-    D        [(Partial) Autocorrelation Function] [autocorrelation m...] [2008-12-16 19:19:27] [4ddbf81f78ea7c738951638c7e93f6ee]
Feedback Forum

Post a new message
Dataseries X:
112,6
113,8
107,8
103,2
103,3
101,2
107,7
110,4
101,9
115,9
89,9
88,6
117,2
123,9
100
103,6
94,1
98,7
119,5
112,7
104,4
124,7
89,1
97
121,6
118,8
114
111,5
97,2
102,5
113,4
109,8
104,9
126,1
80
96,8
117,2
112,3
117,3
111,1
102,2
104,3
122,9
107,6
121,3
131,5
89
104,4
128,9
135,9
133,3
121,3
120,5
120,4
137,9
126,1
133,2
146,6
103,4
117,2


Summary of compuational transaction
Raw Inputview raw input (R code)
Raw Outputview raw output of R engine
Computing time1 seconds
R Server'Gwilym Jenkins' @ 72.249.127.135

\begin{tabular}{lllllllll}
\hline
Summary of compuational transaction \tabularnewline
Raw Input & view raw input (R code)  \tabularnewline
Raw Output & view raw output of R engine  \tabularnewline
Computing time & 1 seconds \tabularnewline
R Server & 'Gwilym Jenkins' @ 72.249.127.135 \tabularnewline
\hline
\end{tabular}
%Source: https://freestatistics.org/blog/index.php?pk=2233&T=0

[TABLE]
[ROW][C]Summary of compuational transaction[/C][/ROW]
[ROW][C]Raw Input[/C][C]view raw input (R code) [/C][/ROW]
[ROW][C]Raw Output[/C][C]view raw output of R engine [/C][/ROW]
[ROW][C]Computing time[/C][C]1 seconds[/C][/ROW]
[ROW][C]R Server[/C][C]'Gwilym Jenkins' @ 72.249.127.135[/C][/ROW]
[/TABLE]
Source: https://freestatistics.org/blog/index.php?pk=2233&T=0

Globally Unique Identifier (entire table): ba.freestatistics.org/blog/index.php?pk=2233&T=0

As an alternative you can also use a QR Code:  

The GUIDs for individual cells are displayed in the table below:

Summary of compuational transaction
Raw Inputview raw input (R code)
Raw Outputview raw output of R engine
Computing time1 seconds
R Server'Gwilym Jenkins' @ 72.249.127.135


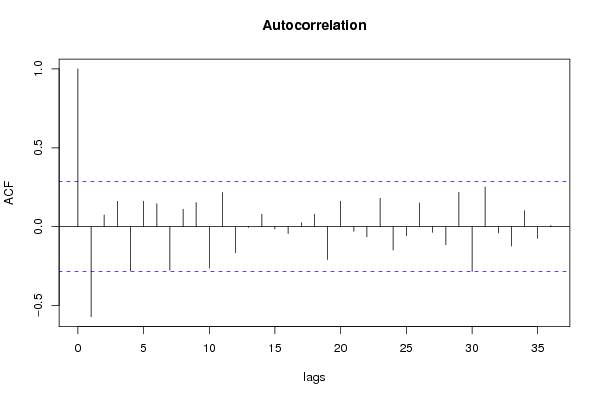
Autocorrelation Function
Time lag kACF(k)T-STATP-value
016.85570
1-0.570817-3.91330.999854
20.0744910.51070.305982
30.1602361.09850.138785
4-0.279488-1.91610.969275
50.1612451.10540.137298
60.1453520.99650.16206
7-0.276491-1.89550.967909
80.1105690.7580.226111
90.1525451.04580.150503
10-0.262614-1.80040.960891
110.2167971.48630.071941
12-0.165776-1.13650.869247
13-0.005198-0.03560.514138
140.0792830.54350.294664
15-0.015074-0.10330.540934
16-0.044009-0.30170.617897
170.0249290.17090.432517
180.0788890.54080.295587
19-0.208641-1.43040.920387
200.1612521.10550.137287
21-0.029306-0.20090.579183
22-0.064864-0.44470.670705
230.1799321.23350.111752
24-0.148681-1.01930.843362
25-0.057358-0.39320.652036
260.1492461.02320.155731
27-0.036189-0.24810.597431
28-0.114751-0.78670.782296
290.218211.4960.070673
30-0.284132-1.94790.971294
310.2519541.72730.045339
32-0.040112-0.2750.607736
33-0.123145-0.84420.798594
340.1021380.70020.243621
35-0.075-0.51420.695231

\begin{tabular}{lllllllll}
\hline
Autocorrelation Function \tabularnewline
Time lag k & ACF(k) & T-STAT & P-value \tabularnewline
0 & 1 & 6.8557 & 0 \tabularnewline
1 & -0.570817 & -3.9133 & 0.999854 \tabularnewline
2 & 0.074491 & 0.5107 & 0.305982 \tabularnewline
3 & 0.160236 & 1.0985 & 0.138785 \tabularnewline
4 & -0.279488 & -1.9161 & 0.969275 \tabularnewline
5 & 0.161245 & 1.1054 & 0.137298 \tabularnewline
6 & 0.145352 & 0.9965 & 0.16206 \tabularnewline
7 & -0.276491 & -1.8955 & 0.967909 \tabularnewline
8 & 0.110569 & 0.758 & 0.226111 \tabularnewline
9 & 0.152545 & 1.0458 & 0.150503 \tabularnewline
10 & -0.262614 & -1.8004 & 0.960891 \tabularnewline
11 & 0.216797 & 1.4863 & 0.071941 \tabularnewline
12 & -0.165776 & -1.1365 & 0.869247 \tabularnewline
13 & -0.005198 & -0.0356 & 0.514138 \tabularnewline
14 & 0.079283 & 0.5435 & 0.294664 \tabularnewline
15 & -0.015074 & -0.1033 & 0.540934 \tabularnewline
16 & -0.044009 & -0.3017 & 0.617897 \tabularnewline
17 & 0.024929 & 0.1709 & 0.432517 \tabularnewline
18 & 0.078889 & 0.5408 & 0.295587 \tabularnewline
19 & -0.208641 & -1.4304 & 0.920387 \tabularnewline
20 & 0.161252 & 1.1055 & 0.137287 \tabularnewline
21 & -0.029306 & -0.2009 & 0.579183 \tabularnewline
22 & -0.064864 & -0.4447 & 0.670705 \tabularnewline
23 & 0.179932 & 1.2335 & 0.111752 \tabularnewline
24 & -0.148681 & -1.0193 & 0.843362 \tabularnewline
25 & -0.057358 & -0.3932 & 0.652036 \tabularnewline
26 & 0.149246 & 1.0232 & 0.155731 \tabularnewline
27 & -0.036189 & -0.2481 & 0.597431 \tabularnewline
28 & -0.114751 & -0.7867 & 0.782296 \tabularnewline
29 & 0.21821 & 1.496 & 0.070673 \tabularnewline
30 & -0.284132 & -1.9479 & 0.971294 \tabularnewline
31 & 0.251954 & 1.7273 & 0.045339 \tabularnewline
32 & -0.040112 & -0.275 & 0.607736 \tabularnewline
33 & -0.123145 & -0.8442 & 0.798594 \tabularnewline
34 & 0.102138 & 0.7002 & 0.243621 \tabularnewline
35 & -0.075 & -0.5142 & 0.695231 \tabularnewline
\hline
\end{tabular}
%Source: https://freestatistics.org/blog/index.php?pk=2233&T=1

[TABLE]
[ROW][C]Autocorrelation Function[/C][/ROW]
[ROW][C]Time lag k[/C][C]ACF(k)[/C][C]T-STAT[/C][C]P-value[/C][/ROW]
[ROW][C]0[/C][C]1[/C][C]6.8557[/C][C]0[/C][/ROW]
[ROW][C]1[/C][C]-0.570817[/C][C]-3.9133[/C][C]0.999854[/C][/ROW]
[ROW][C]2[/C][C]0.074491[/C][C]0.5107[/C][C]0.305982[/C][/ROW]
[ROW][C]3[/C][C]0.160236[/C][C]1.0985[/C][C]0.138785[/C][/ROW]
[ROW][C]4[/C][C]-0.279488[/C][C]-1.9161[/C][C]0.969275[/C][/ROW]
[ROW][C]5[/C][C]0.161245[/C][C]1.1054[/C][C]0.137298[/C][/ROW]
[ROW][C]6[/C][C]0.145352[/C][C]0.9965[/C][C]0.16206[/C][/ROW]
[ROW][C]7[/C][C]-0.276491[/C][C]-1.8955[/C][C]0.967909[/C][/ROW]
[ROW][C]8[/C][C]0.110569[/C][C]0.758[/C][C]0.226111[/C][/ROW]
[ROW][C]9[/C][C]0.152545[/C][C]1.0458[/C][C]0.150503[/C][/ROW]
[ROW][C]10[/C][C]-0.262614[/C][C]-1.8004[/C][C]0.960891[/C][/ROW]
[ROW][C]11[/C][C]0.216797[/C][C]1.4863[/C][C]0.071941[/C][/ROW]
[ROW][C]12[/C][C]-0.165776[/C][C]-1.1365[/C][C]0.869247[/C][/ROW]
[ROW][C]13[/C][C]-0.005198[/C][C]-0.0356[/C][C]0.514138[/C][/ROW]
[ROW][C]14[/C][C]0.079283[/C][C]0.5435[/C][C]0.294664[/C][/ROW]
[ROW][C]15[/C][C]-0.015074[/C][C]-0.1033[/C][C]0.540934[/C][/ROW]
[ROW][C]16[/C][C]-0.044009[/C][C]-0.3017[/C][C]0.617897[/C][/ROW]
[ROW][C]17[/C][C]0.024929[/C][C]0.1709[/C][C]0.432517[/C][/ROW]
[ROW][C]18[/C][C]0.078889[/C][C]0.5408[/C][C]0.295587[/C][/ROW]
[ROW][C]19[/C][C]-0.208641[/C][C]-1.4304[/C][C]0.920387[/C][/ROW]
[ROW][C]20[/C][C]0.161252[/C][C]1.1055[/C][C]0.137287[/C][/ROW]
[ROW][C]21[/C][C]-0.029306[/C][C]-0.2009[/C][C]0.579183[/C][/ROW]
[ROW][C]22[/C][C]-0.064864[/C][C]-0.4447[/C][C]0.670705[/C][/ROW]
[ROW][C]23[/C][C]0.179932[/C][C]1.2335[/C][C]0.111752[/C][/ROW]
[ROW][C]24[/C][C]-0.148681[/C][C]-1.0193[/C][C]0.843362[/C][/ROW]
[ROW][C]25[/C][C]-0.057358[/C][C]-0.3932[/C][C]0.652036[/C][/ROW]
[ROW][C]26[/C][C]0.149246[/C][C]1.0232[/C][C]0.155731[/C][/ROW]
[ROW][C]27[/C][C]-0.036189[/C][C]-0.2481[/C][C]0.597431[/C][/ROW]
[ROW][C]28[/C][C]-0.114751[/C][C]-0.7867[/C][C]0.782296[/C][/ROW]
[ROW][C]29[/C][C]0.21821[/C][C]1.496[/C][C]0.070673[/C][/ROW]
[ROW][C]30[/C][C]-0.284132[/C][C]-1.9479[/C][C]0.971294[/C][/ROW]
[ROW][C]31[/C][C]0.251954[/C][C]1.7273[/C][C]0.045339[/C][/ROW]
[ROW][C]32[/C][C]-0.040112[/C][C]-0.275[/C][C]0.607736[/C][/ROW]
[ROW][C]33[/C][C]-0.123145[/C][C]-0.8442[/C][C]0.798594[/C][/ROW]
[ROW][C]34[/C][C]0.102138[/C][C]0.7002[/C][C]0.243621[/C][/ROW]
[ROW][C]35[/C][C]-0.075[/C][C]-0.5142[/C][C]0.695231[/C][/ROW]
[/TABLE]
Source: https://freestatistics.org/blog/index.php?pk=2233&T=1

Globally Unique Identifier (entire table): ba.freestatistics.org/blog/index.php?pk=2233&T=1

As an alternative you can also use a QR Code:  

The GUIDs for individual cells are displayed in the table below:

Autocorrelation Function
Time lag kACF(k)T-STATP-value
016.85570
1-0.570817-3.91330.999854
20.0744910.51070.305982
30.1602361.09850.138785
4-0.279488-1.91610.969275
50.1612451.10540.137298
60.1453520.99650.16206
7-0.276491-1.89550.967909
80.1105690.7580.226111
90.1525451.04580.150503
10-0.262614-1.80040.960891
110.2167971.48630.071941
12-0.165776-1.13650.869247
13-0.005198-0.03560.514138
140.0792830.54350.294664
15-0.015074-0.10330.540934
16-0.044009-0.30170.617897
170.0249290.17090.432517
180.0788890.54080.295587
19-0.208641-1.43040.920387
200.1612521.10550.137287
21-0.029306-0.20090.579183
22-0.064864-0.44470.670705
230.1799321.23350.111752
24-0.148681-1.01930.843362
25-0.057358-0.39320.652036
260.1492461.02320.155731
27-0.036189-0.24810.597431
28-0.114751-0.78670.782296
290.218211.4960.070673
30-0.284132-1.94790.971294
310.2519541.72730.045339
32-0.040112-0.2750.607736
33-0.123145-0.84420.798594
340.1021380.70020.243621
35-0.075-0.51420.695231


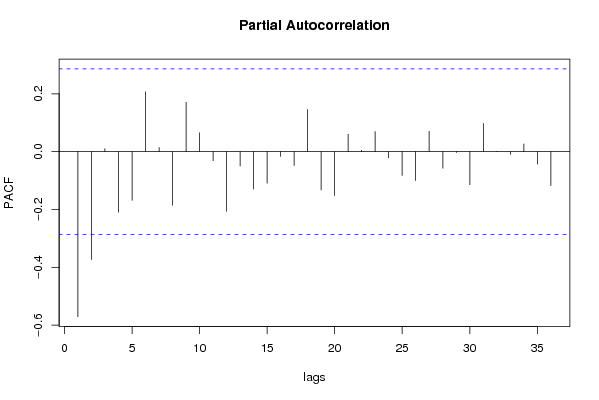
Partial Autocorrelation Function
Time lag kPACF(k)T-STATP-value
0-0.570817-3.91330.999854
1-0.372818-2.55590.993058
20.0099890.06850.472846
3-0.209557-1.43670.92128
4-0.168659-1.15630.873293
50.2067681.41750.081462
60.014120.09680.461648
7-0.185335-1.27060.894937
80.1704521.16860.124238
90.0648840.44480.329245
10-0.031503-0.2160.58503
11-0.206507-1.41570.918277
12-0.04941-0.33870.631842
13-0.129488-0.88770.810396
14-0.109265-0.74910.77123
15-0.016471-0.11290.544712
16-0.047708-0.32710.627467
170.1457660.99930.161378
18-0.132514-0.90850.815868
19-0.152209-1.04350.848972
200.0600870.41190.34113
210.0043120.02960.488272
220.0692780.47490.318512
23-0.020963-0.14370.55683
24-0.082444-0.56520.712691
25-0.100295-0.68760.752455
260.0700360.48010.316676
27-0.057341-0.39310.651993
28-0.003308-0.02270.508999
29-0.114486-0.78490.781767
300.0975370.66870.253484
310.0008840.00610.497596
32-0.009726-0.06670.526439
330.0265030.18170.428303
34-0.043028-0.2950.615348
35-0.117271-0.8040.787269

\begin{tabular}{lllllllll}
\hline
Partial Autocorrelation Function \tabularnewline
Time lag k & PACF(k) & T-STAT & P-value \tabularnewline
0 & -0.570817 & -3.9133 & 0.999854 \tabularnewline
1 & -0.372818 & -2.5559 & 0.993058 \tabularnewline
2 & 0.009989 & 0.0685 & 0.472846 \tabularnewline
3 & -0.209557 & -1.4367 & 0.92128 \tabularnewline
4 & -0.168659 & -1.1563 & 0.873293 \tabularnewline
5 & 0.206768 & 1.4175 & 0.081462 \tabularnewline
6 & 0.01412 & 0.0968 & 0.461648 \tabularnewline
7 & -0.185335 & -1.2706 & 0.894937 \tabularnewline
8 & 0.170452 & 1.1686 & 0.124238 \tabularnewline
9 & 0.064884 & 0.4448 & 0.329245 \tabularnewline
10 & -0.031503 & -0.216 & 0.58503 \tabularnewline
11 & -0.206507 & -1.4157 & 0.918277 \tabularnewline
12 & -0.04941 & -0.3387 & 0.631842 \tabularnewline
13 & -0.129488 & -0.8877 & 0.810396 \tabularnewline
14 & -0.109265 & -0.7491 & 0.77123 \tabularnewline
15 & -0.016471 & -0.1129 & 0.544712 \tabularnewline
16 & -0.047708 & -0.3271 & 0.627467 \tabularnewline
17 & 0.145766 & 0.9993 & 0.161378 \tabularnewline
18 & -0.132514 & -0.9085 & 0.815868 \tabularnewline
19 & -0.152209 & -1.0435 & 0.848972 \tabularnewline
20 & 0.060087 & 0.4119 & 0.34113 \tabularnewline
21 & 0.004312 & 0.0296 & 0.488272 \tabularnewline
22 & 0.069278 & 0.4749 & 0.318512 \tabularnewline
23 & -0.020963 & -0.1437 & 0.55683 \tabularnewline
24 & -0.082444 & -0.5652 & 0.712691 \tabularnewline
25 & -0.100295 & -0.6876 & 0.752455 \tabularnewline
26 & 0.070036 & 0.4801 & 0.316676 \tabularnewline
27 & -0.057341 & -0.3931 & 0.651993 \tabularnewline
28 & -0.003308 & -0.0227 & 0.508999 \tabularnewline
29 & -0.114486 & -0.7849 & 0.781767 \tabularnewline
30 & 0.097537 & 0.6687 & 0.253484 \tabularnewline
31 & 0.000884 & 0.0061 & 0.497596 \tabularnewline
32 & -0.009726 & -0.0667 & 0.526439 \tabularnewline
33 & 0.026503 & 0.1817 & 0.428303 \tabularnewline
34 & -0.043028 & -0.295 & 0.615348 \tabularnewline
35 & -0.117271 & -0.804 & 0.787269 \tabularnewline
\hline
\end{tabular}
%Source: https://freestatistics.org/blog/index.php?pk=2233&T=2

[TABLE]
[ROW][C]Partial Autocorrelation Function[/C][/ROW]
[ROW][C]Time lag k[/C][C]PACF(k)[/C][C]T-STAT[/C][C]P-value[/C][/ROW]
[ROW][C]0[/C][C]-0.570817[/C][C]-3.9133[/C][C]0.999854[/C][/ROW]
[ROW][C]1[/C][C]-0.372818[/C][C]-2.5559[/C][C]0.993058[/C][/ROW]
[ROW][C]2[/C][C]0.009989[/C][C]0.0685[/C][C]0.472846[/C][/ROW]
[ROW][C]3[/C][C]-0.209557[/C][C]-1.4367[/C][C]0.92128[/C][/ROW]
[ROW][C]4[/C][C]-0.168659[/C][C]-1.1563[/C][C]0.873293[/C][/ROW]
[ROW][C]5[/C][C]0.206768[/C][C]1.4175[/C][C]0.081462[/C][/ROW]
[ROW][C]6[/C][C]0.01412[/C][C]0.0968[/C][C]0.461648[/C][/ROW]
[ROW][C]7[/C][C]-0.185335[/C][C]-1.2706[/C][C]0.894937[/C][/ROW]
[ROW][C]8[/C][C]0.170452[/C][C]1.1686[/C][C]0.124238[/C][/ROW]
[ROW][C]9[/C][C]0.064884[/C][C]0.4448[/C][C]0.329245[/C][/ROW]
[ROW][C]10[/C][C]-0.031503[/C][C]-0.216[/C][C]0.58503[/C][/ROW]
[ROW][C]11[/C][C]-0.206507[/C][C]-1.4157[/C][C]0.918277[/C][/ROW]
[ROW][C]12[/C][C]-0.04941[/C][C]-0.3387[/C][C]0.631842[/C][/ROW]
[ROW][C]13[/C][C]-0.129488[/C][C]-0.8877[/C][C]0.810396[/C][/ROW]
[ROW][C]14[/C][C]-0.109265[/C][C]-0.7491[/C][C]0.77123[/C][/ROW]
[ROW][C]15[/C][C]-0.016471[/C][C]-0.1129[/C][C]0.544712[/C][/ROW]
[ROW][C]16[/C][C]-0.047708[/C][C]-0.3271[/C][C]0.627467[/C][/ROW]
[ROW][C]17[/C][C]0.145766[/C][C]0.9993[/C][C]0.161378[/C][/ROW]
[ROW][C]18[/C][C]-0.132514[/C][C]-0.9085[/C][C]0.815868[/C][/ROW]
[ROW][C]19[/C][C]-0.152209[/C][C]-1.0435[/C][C]0.848972[/C][/ROW]
[ROW][C]20[/C][C]0.060087[/C][C]0.4119[/C][C]0.34113[/C][/ROW]
[ROW][C]21[/C][C]0.004312[/C][C]0.0296[/C][C]0.488272[/C][/ROW]
[ROW][C]22[/C][C]0.069278[/C][C]0.4749[/C][C]0.318512[/C][/ROW]
[ROW][C]23[/C][C]-0.020963[/C][C]-0.1437[/C][C]0.55683[/C][/ROW]
[ROW][C]24[/C][C]-0.082444[/C][C]-0.5652[/C][C]0.712691[/C][/ROW]
[ROW][C]25[/C][C]-0.100295[/C][C]-0.6876[/C][C]0.752455[/C][/ROW]
[ROW][C]26[/C][C]0.070036[/C][C]0.4801[/C][C]0.316676[/C][/ROW]
[ROW][C]27[/C][C]-0.057341[/C][C]-0.3931[/C][C]0.651993[/C][/ROW]
[ROW][C]28[/C][C]-0.003308[/C][C]-0.0227[/C][C]0.508999[/C][/ROW]
[ROW][C]29[/C][C]-0.114486[/C][C]-0.7849[/C][C]0.781767[/C][/ROW]
[ROW][C]30[/C][C]0.097537[/C][C]0.6687[/C][C]0.253484[/C][/ROW]
[ROW][C]31[/C][C]0.000884[/C][C]0.0061[/C][C]0.497596[/C][/ROW]
[ROW][C]32[/C][C]-0.009726[/C][C]-0.0667[/C][C]0.526439[/C][/ROW]
[ROW][C]33[/C][C]0.026503[/C][C]0.1817[/C][C]0.428303[/C][/ROW]
[ROW][C]34[/C][C]-0.043028[/C][C]-0.295[/C][C]0.615348[/C][/ROW]
[ROW][C]35[/C][C]-0.117271[/C][C]-0.804[/C][C]0.787269[/C][/ROW]
[/TABLE]
Source: https://freestatistics.org/blog/index.php?pk=2233&T=2

Globally Unique Identifier (entire table): ba.freestatistics.org/blog/index.php?pk=2233&T=2

As an alternative you can also use a QR Code:  

The GUIDs for individual cells are displayed in the table below:

Partial Autocorrelation Function
Time lag kPACF(k)T-STATP-value
0-0.570817-3.91330.999854
1-0.372818-2.55590.993058
20.0099890.06850.472846
3-0.209557-1.43670.92128
4-0.168659-1.15630.873293
50.2067681.41750.081462
60.014120.09680.461648
7-0.185335-1.27060.894937
80.1704521.16860.124238
90.0648840.44480.329245
10-0.031503-0.2160.58503
11-0.206507-1.41570.918277
12-0.04941-0.33870.631842
13-0.129488-0.88770.810396
14-0.109265-0.74910.77123
15-0.016471-0.11290.544712
16-0.047708-0.32710.627467
170.1457660.99930.161378
18-0.132514-0.90850.815868
19-0.152209-1.04350.848972
200.0600870.41190.34113
210.0043120.02960.488272
220.0692780.47490.318512
23-0.020963-0.14370.55683
24-0.082444-0.56520.712691
25-0.100295-0.68760.752455
260.0700360.48010.316676
27-0.057341-0.39310.651993
28-0.003308-0.02270.508999
29-0.114486-0.78490.781767
300.0975370.66870.253484
310.0008840.00610.497596
32-0.009726-0.06670.526439
330.0265030.18170.428303
34-0.043028-0.2950.615348
35-0.117271-0.8040.787269


Parameters (Session):
par1 = 36 ; par2 = 1 ; par3 = 1 ; par4 = 1 ; par5 = 12 ;
Parameters (R input):
par1 = 36 ; par2 = 1 ; par3 = 1 ; par4 = 1 ; par5 = 12 ;
R code (references can be found in the software module):
if (par1 == 'Default') {
par1 = 10*log10(length(x))
} else {
par1 <- as.numeric(par1)
}
par2 <- as.numeric(par2)
par3 <- as.numeric(par3)
par4 <- as.numeric(par4)
par5 <- as.numeric(par5)
if (par2 == 0) {
x <- log(x)
} else {
x <- (x ^ par2 - 1) / par2
}
if (par3 > 0) x <- diff(x,lag=1,difference=par3)
if (par4 > 0) x <- diff(x,lag=par5,difference=par4)
bitmap(file='pic1.png')
racf <- acf(x,par1,main='Autocorrelation',xlab='lags',ylab='ACF')
dev.off()
bitmap(file='pic2.png')
rpacf <- pacf(x,par1,main='Partial Autocorrelation',xlab='lags',ylab='PACF')
dev.off()
(myacf <- c(racf$acf))
(mypacf <- c(rpacf$acf))
lengthx <- length(x)
sqrtn <- sqrt(lengthx)
load(file='createtable')
a<-table.start()
a<-table.row.start(a)
a<-table.element(a,'Autocorrelation Function',4,TRUE)
a<-table.row.end(a)
a<-table.row.start(a)
a<-table.element(a,'Time lag k',header=TRUE)
a<-table.element(a,hyperlink('basics.htm','ACF(k)','click here for more information about the Autocorrelation Function'),header=TRUE)
a<-table.element(a,'T-STAT',header=TRUE)
a<-table.element(a,'P-value',header=TRUE)
a<-table.row.end(a)
for (i in 1:par1) {
a<-table.row.start(a)
a<-table.element(a,i-1,header=TRUE)
a<-table.element(a,round(myacf[i],6))
mytstat <- myacf[i]*sqrtn
a<-table.element(a,round(mytstat,4))
a<-table.element(a,round(1-pt(mytstat,lengthx),6))
a<-table.row.end(a)
}
a<-table.end(a)
table.save(a,file='mytable.tab')
a<-table.start()
a<-table.row.start(a)
a<-table.element(a,'Partial Autocorrelation Function',4,TRUE)
a<-table.row.end(a)
a<-table.row.start(a)
a<-table.element(a,'Time lag k',header=TRUE)
a<-table.element(a,hyperlink('basics.htm','PACF(k)','click here for more information about the Partial Autocorrelation Function'),header=TRUE)
a<-table.element(a,'T-STAT',header=TRUE)
a<-table.element(a,'P-value',header=TRUE)
a<-table.row.end(a)
for (i in 1:par1) {
a<-table.row.start(a)
a<-table.element(a,i-1,header=TRUE)
a<-table.element(a,round(mypacf[i],6))
mytstat <- mypacf[i]*sqrtn
a<-table.element(a,round(mytstat,4))
a<-table.element(a,round(1-pt(mytstat,lengthx),6))
a<-table.row.end(a)
}
a<-table.end(a)
table.save(a,file='mytable1.tab')