Free Statistics

of Irreproducible Research!

Author's title

Author*Unverified author*
R Software Modulerwasp_autocorrelation.wasp
Title produced by software(Partial) Autocorrelation Function
Date of computationSat, 01 Dec 2007 05:23:26 -0700
Cite this page as followsStatistical Computations at FreeStatistics.org, Office for Research Development and Education, URL https://freestatistics.org/blog/index.php?v=date/2007/Dec/01/t1196511152rbgkseratv0ong0.htm/, Retrieved Sun, 19 May 2024 19:18:56 +0000
Statistical Computations at FreeStatistics.org, Office for Research Development and Education, URL https://freestatistics.org/blog/index.php?pk=2230, Retrieved Sun, 19 May 2024 19:18:56 +0000
QR Codes:

Original text written by user:
IsPrivate?No (this computation is public)
User-defined keywords
Estimated Impact228
Family? (F = Feedback message, R = changed R code, M = changed R Module, P = changed Parameters, D = changed Data)
-       [(Partial) Autocorrelation Function] [autocorrelatie in...] [2007-12-01 12:23:26] [bd02e85be52eb1cb060a2c60779eb820] [Current]
Feedback Forum

Post a new message
Dataseries X:
9.1
11.2
7.7
7.9
-2.4
-2.8
-4.9
2.3
7.9
6.7
6
3.8
4.7
6.4
9.3
11
8.5
8.8
10
16.8
11.6
11.5
6
2.9
2.1
2.7
11.2
7.3
11.6
4.6
6
-0.5
1.8
3.7
8.3
8.3
12
7.8
5.3
1
-0.3
2.4
2.7
5.7
3.5
0.6
5.2
2.9
1
-5.5
-7.1
-7.9
-8.8
-7
-5.5
-7.3
-7.5
-3.5
2.2
3.1
4.1
4.2
6
5.5
5.1
5.5
1
1.5
1.2
1.7
-8.6
-11.2
-12.7
-3.1
-1
0.3
-2.9
-2.2
3.2
5.9
13.3
7.3
6.9
8.3
11.8
9.2
5.8
8.8
14.6
28.1
19.7
16.5
-5.3
-2.4
1.9
1.6
-0.1
-1.9
3.4
3.3
3.3
-9.8
-4.6
-6.1
10.6
8.8
10.7
11.7


Summary of compuational transaction
Raw Inputview raw input (R code)
Raw Outputview raw output of R engine
Computing time3 seconds
R Server'Herman Ole Andreas Wold' @ 193.190.124.10:1001

\begin{tabular}{lllllllll}
\hline
Summary of compuational transaction \tabularnewline
Raw Input & view raw input (R code)  \tabularnewline
Raw Output & view raw output of R engine  \tabularnewline
Computing time & 3 seconds \tabularnewline
R Server & 'Herman Ole Andreas Wold' @ 193.190.124.10:1001 \tabularnewline
\hline
\end{tabular}
%Source: https://freestatistics.org/blog/index.php?pk=2230&T=0

[TABLE]
[ROW][C]Summary of compuational transaction[/C][/ROW]
[ROW][C]Raw Input[/C][C]view raw input (R code) [/C][/ROW]
[ROW][C]Raw Output[/C][C]view raw output of R engine [/C][/ROW]
[ROW][C]Computing time[/C][C]3 seconds[/C][/ROW]
[ROW][C]R Server[/C][C]'Herman Ole Andreas Wold' @ 193.190.124.10:1001[/C][/ROW]
[/TABLE]
Source: https://freestatistics.org/blog/index.php?pk=2230&T=0

Globally Unique Identifier (entire table): ba.freestatistics.org/blog/index.php?pk=2230&T=0

As an alternative you can also use a QR Code:  

The GUIDs for individual cells are displayed in the table below:

Summary of compuational transaction
Raw Inputview raw input (R code)
Raw Outputview raw output of R engine
Computing time3 seconds
R Server'Herman Ole Andreas Wold' @ 193.190.124.10:1001


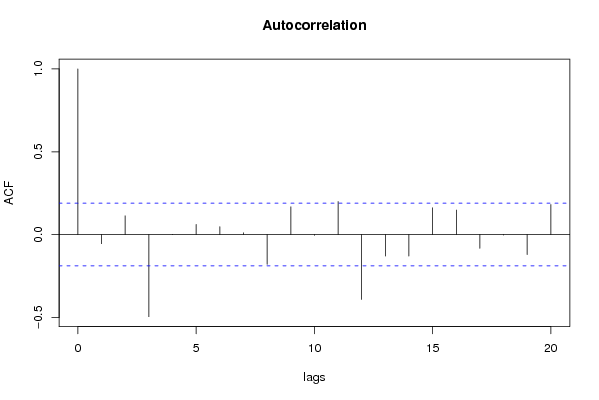
Autocorrelation Function
Time lag kACF(k)T-STATP-value
0110.34410
1-0.055111-0.57010.71509
20.1129721.16860.122583
3-0.495575-5.12630.999999
4-0.000913-0.00940.503758
50.06140.63510.263351
60.0476870.49330.311414
70.0110240.1140.454713
8-0.179748-1.85930.967136
90.1673341.73090.043174
10-0.004816-0.04980.519818
110.199362.06220.020806
12-0.391558-4.05030.999951
13-0.129417-1.33870.908246
14-0.129494-1.33950.908376
150.1617431.67310.048616
160.1483851.53490.063879
17-0.082984-0.85840.803704
18-0.002727-0.02820.511228
19-0.121034-1.2520.893348

\begin{tabular}{lllllllll}
\hline
Autocorrelation Function \tabularnewline
Time lag k & ACF(k) & T-STAT & P-value \tabularnewline
0 & 1 & 10.3441 & 0 \tabularnewline
1 & -0.055111 & -0.5701 & 0.71509 \tabularnewline
2 & 0.112972 & 1.1686 & 0.122583 \tabularnewline
3 & -0.495575 & -5.1263 & 0.999999 \tabularnewline
4 & -0.000913 & -0.0094 & 0.503758 \tabularnewline
5 & 0.0614 & 0.6351 & 0.263351 \tabularnewline
6 & 0.047687 & 0.4933 & 0.311414 \tabularnewline
7 & 0.011024 & 0.114 & 0.454713 \tabularnewline
8 & -0.179748 & -1.8593 & 0.967136 \tabularnewline
9 & 0.167334 & 1.7309 & 0.043174 \tabularnewline
10 & -0.004816 & -0.0498 & 0.519818 \tabularnewline
11 & 0.19936 & 2.0622 & 0.020806 \tabularnewline
12 & -0.391558 & -4.0503 & 0.999951 \tabularnewline
13 & -0.129417 & -1.3387 & 0.908246 \tabularnewline
14 & -0.129494 & -1.3395 & 0.908376 \tabularnewline
15 & 0.161743 & 1.6731 & 0.048616 \tabularnewline
16 & 0.148385 & 1.5349 & 0.063879 \tabularnewline
17 & -0.082984 & -0.8584 & 0.803704 \tabularnewline
18 & -0.002727 & -0.0282 & 0.511228 \tabularnewline
19 & -0.121034 & -1.252 & 0.893348 \tabularnewline
\hline
\end{tabular}
%Source: https://freestatistics.org/blog/index.php?pk=2230&T=1

[TABLE]
[ROW][C]Autocorrelation Function[/C][/ROW]
[ROW][C]Time lag k[/C][C]ACF(k)[/C][C]T-STAT[/C][C]P-value[/C][/ROW]
[ROW][C]0[/C][C]1[/C][C]10.3441[/C][C]0[/C][/ROW]
[ROW][C]1[/C][C]-0.055111[/C][C]-0.5701[/C][C]0.71509[/C][/ROW]
[ROW][C]2[/C][C]0.112972[/C][C]1.1686[/C][C]0.122583[/C][/ROW]
[ROW][C]3[/C][C]-0.495575[/C][C]-5.1263[/C][C]0.999999[/C][/ROW]
[ROW][C]4[/C][C]-0.000913[/C][C]-0.0094[/C][C]0.503758[/C][/ROW]
[ROW][C]5[/C][C]0.0614[/C][C]0.6351[/C][C]0.263351[/C][/ROW]
[ROW][C]6[/C][C]0.047687[/C][C]0.4933[/C][C]0.311414[/C][/ROW]
[ROW][C]7[/C][C]0.011024[/C][C]0.114[/C][C]0.454713[/C][/ROW]
[ROW][C]8[/C][C]-0.179748[/C][C]-1.8593[/C][C]0.967136[/C][/ROW]
[ROW][C]9[/C][C]0.167334[/C][C]1.7309[/C][C]0.043174[/C][/ROW]
[ROW][C]10[/C][C]-0.004816[/C][C]-0.0498[/C][C]0.519818[/C][/ROW]
[ROW][C]11[/C][C]0.19936[/C][C]2.0622[/C][C]0.020806[/C][/ROW]
[ROW][C]12[/C][C]-0.391558[/C][C]-4.0503[/C][C]0.999951[/C][/ROW]
[ROW][C]13[/C][C]-0.129417[/C][C]-1.3387[/C][C]0.908246[/C][/ROW]
[ROW][C]14[/C][C]-0.129494[/C][C]-1.3395[/C][C]0.908376[/C][/ROW]
[ROW][C]15[/C][C]0.161743[/C][C]1.6731[/C][C]0.048616[/C][/ROW]
[ROW][C]16[/C][C]0.148385[/C][C]1.5349[/C][C]0.063879[/C][/ROW]
[ROW][C]17[/C][C]-0.082984[/C][C]-0.8584[/C][C]0.803704[/C][/ROW]
[ROW][C]18[/C][C]-0.002727[/C][C]-0.0282[/C][C]0.511228[/C][/ROW]
[ROW][C]19[/C][C]-0.121034[/C][C]-1.252[/C][C]0.893348[/C][/ROW]
[/TABLE]
Source: https://freestatistics.org/blog/index.php?pk=2230&T=1

Globally Unique Identifier (entire table): ba.freestatistics.org/blog/index.php?pk=2230&T=1

As an alternative you can also use a QR Code:  

The GUIDs for individual cells are displayed in the table below:

Autocorrelation Function
Time lag kACF(k)T-STATP-value
0110.34410
1-0.055111-0.57010.71509
20.1129721.16860.122583
3-0.495575-5.12630.999999
4-0.000913-0.00940.503758
50.06140.63510.263351
60.0476870.49330.311414
70.0110240.1140.454713
8-0.179748-1.85930.967136
90.1673341.73090.043174
10-0.004816-0.04980.519818
110.199362.06220.020806
12-0.391558-4.05030.999951
13-0.129417-1.33870.908246
14-0.129494-1.33950.908376
150.1617431.67310.048616
160.1483851.53490.063879
17-0.082984-0.85840.803704
18-0.002727-0.02820.511228
19-0.121034-1.2520.893348


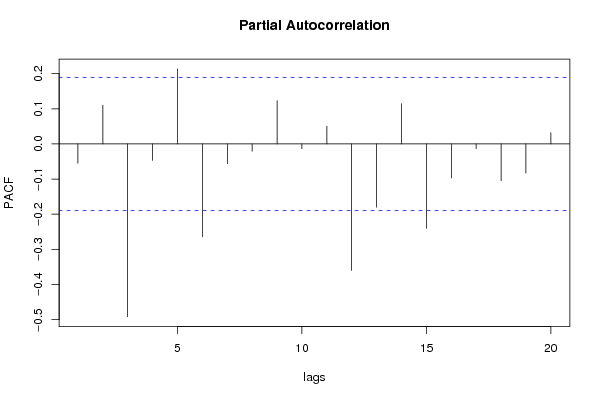
Partial Autocorrelation Function
Time lag kPACF(k)T-STATP-value
0-0.055111-0.57010.71509
10.1102691.14060.128284
2-0.491408-5.08320.999999
3-0.047089-0.48710.686405
40.2133092.20650.014744
5-0.264183-2.73270.996325
6-0.056619-0.58570.720335
7-0.020677-0.21390.584478
80.1230681.2730.102884
9-0.01361-0.14080.555846
100.0504820.52220.30131
11-0.359808-3.72190.999841
12-0.180049-1.86240.967358
130.1146411.18590.119154
14-0.240036-2.4830.992709
15-0.09685-1.00180.840655
16-0.013033-0.13480.553494
17-0.104429-1.08020.858765
18-0.083012-0.85870.803782
190.032020.33120.370566

\begin{tabular}{lllllllll}
\hline
Partial Autocorrelation Function \tabularnewline
Time lag k & PACF(k) & T-STAT & P-value \tabularnewline
0 & -0.055111 & -0.5701 & 0.71509 \tabularnewline
1 & 0.110269 & 1.1406 & 0.128284 \tabularnewline
2 & -0.491408 & -5.0832 & 0.999999 \tabularnewline
3 & -0.047089 & -0.4871 & 0.686405 \tabularnewline
4 & 0.213309 & 2.2065 & 0.014744 \tabularnewline
5 & -0.264183 & -2.7327 & 0.996325 \tabularnewline
6 & -0.056619 & -0.5857 & 0.720335 \tabularnewline
7 & -0.020677 & -0.2139 & 0.584478 \tabularnewline
8 & 0.123068 & 1.273 & 0.102884 \tabularnewline
9 & -0.01361 & -0.1408 & 0.555846 \tabularnewline
10 & 0.050482 & 0.5222 & 0.30131 \tabularnewline
11 & -0.359808 & -3.7219 & 0.999841 \tabularnewline
12 & -0.180049 & -1.8624 & 0.967358 \tabularnewline
13 & 0.114641 & 1.1859 & 0.119154 \tabularnewline
14 & -0.240036 & -2.483 & 0.992709 \tabularnewline
15 & -0.09685 & -1.0018 & 0.840655 \tabularnewline
16 & -0.013033 & -0.1348 & 0.553494 \tabularnewline
17 & -0.104429 & -1.0802 & 0.858765 \tabularnewline
18 & -0.083012 & -0.8587 & 0.803782 \tabularnewline
19 & 0.03202 & 0.3312 & 0.370566 \tabularnewline
\hline
\end{tabular}
%Source: https://freestatistics.org/blog/index.php?pk=2230&T=2

[TABLE]
[ROW][C]Partial Autocorrelation Function[/C][/ROW]
[ROW][C]Time lag k[/C][C]PACF(k)[/C][C]T-STAT[/C][C]P-value[/C][/ROW]
[ROW][C]0[/C][C]-0.055111[/C][C]-0.5701[/C][C]0.71509[/C][/ROW]
[ROW][C]1[/C][C]0.110269[/C][C]1.1406[/C][C]0.128284[/C][/ROW]
[ROW][C]2[/C][C]-0.491408[/C][C]-5.0832[/C][C]0.999999[/C][/ROW]
[ROW][C]3[/C][C]-0.047089[/C][C]-0.4871[/C][C]0.686405[/C][/ROW]
[ROW][C]4[/C][C]0.213309[/C][C]2.2065[/C][C]0.014744[/C][/ROW]
[ROW][C]5[/C][C]-0.264183[/C][C]-2.7327[/C][C]0.996325[/C][/ROW]
[ROW][C]6[/C][C]-0.056619[/C][C]-0.5857[/C][C]0.720335[/C][/ROW]
[ROW][C]7[/C][C]-0.020677[/C][C]-0.2139[/C][C]0.584478[/C][/ROW]
[ROW][C]8[/C][C]0.123068[/C][C]1.273[/C][C]0.102884[/C][/ROW]
[ROW][C]9[/C][C]-0.01361[/C][C]-0.1408[/C][C]0.555846[/C][/ROW]
[ROW][C]10[/C][C]0.050482[/C][C]0.5222[/C][C]0.30131[/C][/ROW]
[ROW][C]11[/C][C]-0.359808[/C][C]-3.7219[/C][C]0.999841[/C][/ROW]
[ROW][C]12[/C][C]-0.180049[/C][C]-1.8624[/C][C]0.967358[/C][/ROW]
[ROW][C]13[/C][C]0.114641[/C][C]1.1859[/C][C]0.119154[/C][/ROW]
[ROW][C]14[/C][C]-0.240036[/C][C]-2.483[/C][C]0.992709[/C][/ROW]
[ROW][C]15[/C][C]-0.09685[/C][C]-1.0018[/C][C]0.840655[/C][/ROW]
[ROW][C]16[/C][C]-0.013033[/C][C]-0.1348[/C][C]0.553494[/C][/ROW]
[ROW][C]17[/C][C]-0.104429[/C][C]-1.0802[/C][C]0.858765[/C][/ROW]
[ROW][C]18[/C][C]-0.083012[/C][C]-0.8587[/C][C]0.803782[/C][/ROW]
[ROW][C]19[/C][C]0.03202[/C][C]0.3312[/C][C]0.370566[/C][/ROW]
[/TABLE]
Source: https://freestatistics.org/blog/index.php?pk=2230&T=2

Globally Unique Identifier (entire table): ba.freestatistics.org/blog/index.php?pk=2230&T=2

As an alternative you can also use a QR Code:  

The GUIDs for individual cells are displayed in the table below:

Partial Autocorrelation Function
Time lag kPACF(k)T-STATP-value
0-0.055111-0.57010.71509
10.1102691.14060.128284
2-0.491408-5.08320.999999
3-0.047089-0.48710.686405
40.2133092.20650.014744
5-0.264183-2.73270.996325
6-0.056619-0.58570.720335
7-0.020677-0.21390.584478
80.1230681.2730.102884
9-0.01361-0.14080.555846
100.0504820.52220.30131
11-0.359808-3.72190.999841
12-0.180049-1.86240.967358
130.1146411.18590.119154
14-0.240036-2.4830.992709
15-0.09685-1.00180.840655
16-0.013033-0.13480.553494
17-0.104429-1.08020.858765
18-0.083012-0.85870.803782
190.032020.33120.370566


Parameters (Session):
par1 = Default ; par2 = 1 ; par3 = 1 ; par4 = 0 ; par5 = 12 ;
Parameters (R input):
par1 = Default ; par2 = 1 ; par3 = 1 ; par4 = 0 ; par5 = 12 ;
R code (references can be found in the software module):
if (par1 == 'Default') {
par1 = 10*log10(length(x))
} else {
par1 <- as.numeric(par1)
}
par2 <- as.numeric(par2)
par3 <- as.numeric(par3)
par4 <- as.numeric(par4)
par5 <- as.numeric(par5)
if (par2 == 0) {
x <- log(x)
} else {
x <- (x ^ par2 - 1) / par2
}
if (par3 > 0) x <- diff(x,lag=1,difference=par3)
if (par4 > 0) x <- diff(x,lag=par5,difference=par4)
bitmap(file='pic1.png')
racf <- acf(x,par1,main='Autocorrelation',xlab='lags',ylab='ACF')
dev.off()
bitmap(file='pic2.png')
rpacf <- pacf(x,par1,main='Partial Autocorrelation',xlab='lags',ylab='PACF')
dev.off()
(myacf <- c(racf$acf))
(mypacf <- c(rpacf$acf))
lengthx <- length(x)
sqrtn <- sqrt(lengthx)
load(file='createtable')
a<-table.start()
a<-table.row.start(a)
a<-table.element(a,'Autocorrelation Function',4,TRUE)
a<-table.row.end(a)
a<-table.row.start(a)
a<-table.element(a,'Time lag k',header=TRUE)
a<-table.element(a,hyperlink('basics.htm','ACF(k)','click here for more information about the Autocorrelation Function'),header=TRUE)
a<-table.element(a,'T-STAT',header=TRUE)
a<-table.element(a,'P-value',header=TRUE)
a<-table.row.end(a)
for (i in 1:par1) {
a<-table.row.start(a)
a<-table.element(a,i-1,header=TRUE)
a<-table.element(a,round(myacf[i],6))
mytstat <- myacf[i]*sqrtn
a<-table.element(a,round(mytstat,4))
a<-table.element(a,round(1-pt(mytstat,lengthx),6))
a<-table.row.end(a)
}
a<-table.end(a)
table.save(a,file='mytable.tab')
a<-table.start()
a<-table.row.start(a)
a<-table.element(a,'Partial Autocorrelation Function',4,TRUE)
a<-table.row.end(a)
a<-table.row.start(a)
a<-table.element(a,'Time lag k',header=TRUE)
a<-table.element(a,hyperlink('basics.htm','PACF(k)','click here for more information about the Partial Autocorrelation Function'),header=TRUE)
a<-table.element(a,'T-STAT',header=TRUE)
a<-table.element(a,'P-value',header=TRUE)
a<-table.row.end(a)
for (i in 1:par1) {
a<-table.row.start(a)
a<-table.element(a,i-1,header=TRUE)
a<-table.element(a,round(mypacf[i],6))
mytstat <- mypacf[i]*sqrtn
a<-table.element(a,round(mytstat,4))
a<-table.element(a,round(1-pt(mytstat,lengthx),6))
a<-table.row.end(a)
}
a<-table.end(a)
table.save(a,file='mytable1.tab')