Free Statistics

of Irreproducible Research!

Author's title

Author*Unverified author*
R Software Modulerwasp_autocorrelation.wasp
Title produced by software(Partial) Autocorrelation Function
Date of computationSat, 01 Dec 2007 05:11:50 -0700
Cite this page as followsStatistical Computations at FreeStatistics.org, Office for Research Development and Education, URL https://freestatistics.org/blog/index.php?v=date/2007/Dec/01/t1196510464o17cvx90vvod487.htm/, Retrieved Sun, 19 May 2024 21:14:56 +0000
Statistical Computations at FreeStatistics.org, Office for Research Development and Education, URL https://freestatistics.org/blog/index.php?pk=2224, Retrieved Sun, 19 May 2024 21:14:56 +0000
QR Codes:

Original text written by user:
IsPrivate?No (this computation is public)
User-defined keywords
Estimated Impact216
Family? (F = Feedback message, R = changed R code, M = changed R Module, P = changed Parameters, D = changed Data)
-       [(Partial) Autocorrelation Function] [paper auto 2] [2007-12-01 12:11:50] [fef19078983b9fa83d10cb717d6f9786] [Current]
Feedback Forum

Post a new message
Dataseries X:
105,1
113,3
99,1
100,3
93,5
98,8
106,2
98,3
102,1
117,1
101,5
80,5
105,9
109,5
97,2
114,5
93,5
100,9
121,1
116,5
109,3
118,1
108,3
105,4
116,2
111,2
105,8
122,7
99,5
107,9
124,6
115
110,3
132,7
99,7
96,5
118,7
112,9
130,5
137,9
115
116,8
140,9
120,7
134,2
147,3
112,4
107,1
128,4
137,7
135
151
137,4
132,4
161,3
139,8
146
154,6
142,1
120,5


Summary of compuational transaction
Raw Inputview raw input (R code)
Raw Outputview raw output of R engine
Computing time2 seconds
R Server'Gwilym Jenkins' @ 72.249.127.135

\begin{tabular}{lllllllll}
\hline
Summary of compuational transaction \tabularnewline
Raw Input & view raw input (R code)  \tabularnewline
Raw Output & view raw output of R engine  \tabularnewline
Computing time & 2 seconds \tabularnewline
R Server & 'Gwilym Jenkins' @ 72.249.127.135 \tabularnewline
\hline
\end{tabular}
%Source: https://freestatistics.org/blog/index.php?pk=2224&T=0

[TABLE]
[ROW][C]Summary of compuational transaction[/C][/ROW]
[ROW][C]Raw Input[/C][C]view raw input (R code) [/C][/ROW]
[ROW][C]Raw Output[/C][C]view raw output of R engine [/C][/ROW]
[ROW][C]Computing time[/C][C]2 seconds[/C][/ROW]
[ROW][C]R Server[/C][C]'Gwilym Jenkins' @ 72.249.127.135[/C][/ROW]
[/TABLE]
Source: https://freestatistics.org/blog/index.php?pk=2224&T=0

Globally Unique Identifier (entire table): ba.freestatistics.org/blog/index.php?pk=2224&T=0

As an alternative you can also use a QR Code:  

The GUIDs for individual cells are displayed in the table below:

Summary of compuational transaction
Raw Inputview raw input (R code)
Raw Outputview raw output of R engine
Computing time2 seconds
R Server'Gwilym Jenkins' @ 72.249.127.135


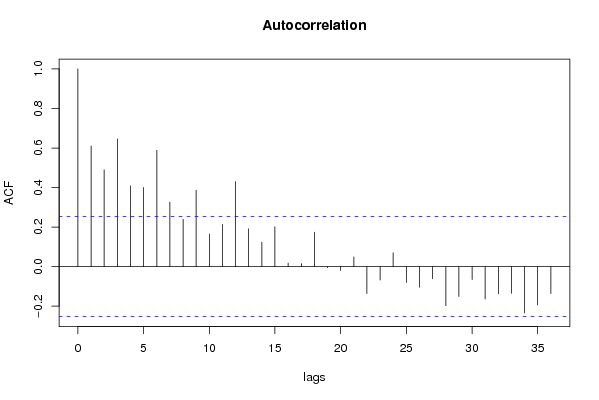
Autocorrelation Function
Time lag kACF(k)T-STATP-value
017.7460
10.6100694.72567e-06
20.489913.79480.000173
30.646075.00443e-06
40.4090833.16870.001205
50.4005783.10290.001461
60.5884614.55821.3e-05
70.3266092.52990.007027
80.2396631.85640.034153
90.3864492.99340.002001
100.1649081.27740.103197
110.2132051.65150.051933
120.4305813.33530.000733
130.1913581.48220.071754
140.1239460.96010.170434
150.2015791.56140.061842
160.0181330.14050.444385
170.0156530.12120.451949
180.1740681.34830.091311
19-0.005858-0.04540.51802
20-0.019197-0.14870.558857
210.0491740.38090.352312
22-0.13634-1.05610.852418
23-0.068075-0.52730.700037
240.0697050.53990.29562
25-0.080109-0.62050.731368
26-0.103844-0.80440.787821
27-0.061049-0.47290.680993
28-0.197765-1.53190.934596
29-0.150997-1.16960.87661
30-0.065136-0.50450.692135
31-0.164187-1.27180.895821
32-0.137369-1.06410.854217
33-0.135114-1.04660.850257
34-0.234155-1.81380.962642
35-0.194153-1.50390.931074

\begin{tabular}{lllllllll}
\hline
Autocorrelation Function \tabularnewline
Time lag k & ACF(k) & T-STAT & P-value \tabularnewline
0 & 1 & 7.746 & 0 \tabularnewline
1 & 0.610069 & 4.7256 & 7e-06 \tabularnewline
2 & 0.48991 & 3.7948 & 0.000173 \tabularnewline
3 & 0.64607 & 5.0044 & 3e-06 \tabularnewline
4 & 0.409083 & 3.1687 & 0.001205 \tabularnewline
5 & 0.400578 & 3.1029 & 0.001461 \tabularnewline
6 & 0.588461 & 4.5582 & 1.3e-05 \tabularnewline
7 & 0.326609 & 2.5299 & 0.007027 \tabularnewline
8 & 0.239663 & 1.8564 & 0.034153 \tabularnewline
9 & 0.386449 & 2.9934 & 0.002001 \tabularnewline
10 & 0.164908 & 1.2774 & 0.103197 \tabularnewline
11 & 0.213205 & 1.6515 & 0.051933 \tabularnewline
12 & 0.430581 & 3.3353 & 0.000733 \tabularnewline
13 & 0.191358 & 1.4822 & 0.071754 \tabularnewline
14 & 0.123946 & 0.9601 & 0.170434 \tabularnewline
15 & 0.201579 & 1.5614 & 0.061842 \tabularnewline
16 & 0.018133 & 0.1405 & 0.444385 \tabularnewline
17 & 0.015653 & 0.1212 & 0.451949 \tabularnewline
18 & 0.174068 & 1.3483 & 0.091311 \tabularnewline
19 & -0.005858 & -0.0454 & 0.51802 \tabularnewline
20 & -0.019197 & -0.1487 & 0.558857 \tabularnewline
21 & 0.049174 & 0.3809 & 0.352312 \tabularnewline
22 & -0.13634 & -1.0561 & 0.852418 \tabularnewline
23 & -0.068075 & -0.5273 & 0.700037 \tabularnewline
24 & 0.069705 & 0.5399 & 0.29562 \tabularnewline
25 & -0.080109 & -0.6205 & 0.731368 \tabularnewline
26 & -0.103844 & -0.8044 & 0.787821 \tabularnewline
27 & -0.061049 & -0.4729 & 0.680993 \tabularnewline
28 & -0.197765 & -1.5319 & 0.934596 \tabularnewline
29 & -0.150997 & -1.1696 & 0.87661 \tabularnewline
30 & -0.065136 & -0.5045 & 0.692135 \tabularnewline
31 & -0.164187 & -1.2718 & 0.895821 \tabularnewline
32 & -0.137369 & -1.0641 & 0.854217 \tabularnewline
33 & -0.135114 & -1.0466 & 0.850257 \tabularnewline
34 & -0.234155 & -1.8138 & 0.962642 \tabularnewline
35 & -0.194153 & -1.5039 & 0.931074 \tabularnewline
\hline
\end{tabular}
%Source: https://freestatistics.org/blog/index.php?pk=2224&T=1

[TABLE]
[ROW][C]Autocorrelation Function[/C][/ROW]
[ROW][C]Time lag k[/C][C]ACF(k)[/C][C]T-STAT[/C][C]P-value[/C][/ROW]
[ROW][C]0[/C][C]1[/C][C]7.746[/C][C]0[/C][/ROW]
[ROW][C]1[/C][C]0.610069[/C][C]4.7256[/C][C]7e-06[/C][/ROW]
[ROW][C]2[/C][C]0.48991[/C][C]3.7948[/C][C]0.000173[/C][/ROW]
[ROW][C]3[/C][C]0.64607[/C][C]5.0044[/C][C]3e-06[/C][/ROW]
[ROW][C]4[/C][C]0.409083[/C][C]3.1687[/C][C]0.001205[/C][/ROW]
[ROW][C]5[/C][C]0.400578[/C][C]3.1029[/C][C]0.001461[/C][/ROW]
[ROW][C]6[/C][C]0.588461[/C][C]4.5582[/C][C]1.3e-05[/C][/ROW]
[ROW][C]7[/C][C]0.326609[/C][C]2.5299[/C][C]0.007027[/C][/ROW]
[ROW][C]8[/C][C]0.239663[/C][C]1.8564[/C][C]0.034153[/C][/ROW]
[ROW][C]9[/C][C]0.386449[/C][C]2.9934[/C][C]0.002001[/C][/ROW]
[ROW][C]10[/C][C]0.164908[/C][C]1.2774[/C][C]0.103197[/C][/ROW]
[ROW][C]11[/C][C]0.213205[/C][C]1.6515[/C][C]0.051933[/C][/ROW]
[ROW][C]12[/C][C]0.430581[/C][C]3.3353[/C][C]0.000733[/C][/ROW]
[ROW][C]13[/C][C]0.191358[/C][C]1.4822[/C][C]0.071754[/C][/ROW]
[ROW][C]14[/C][C]0.123946[/C][C]0.9601[/C][C]0.170434[/C][/ROW]
[ROW][C]15[/C][C]0.201579[/C][C]1.5614[/C][C]0.061842[/C][/ROW]
[ROW][C]16[/C][C]0.018133[/C][C]0.1405[/C][C]0.444385[/C][/ROW]
[ROW][C]17[/C][C]0.015653[/C][C]0.1212[/C][C]0.451949[/C][/ROW]
[ROW][C]18[/C][C]0.174068[/C][C]1.3483[/C][C]0.091311[/C][/ROW]
[ROW][C]19[/C][C]-0.005858[/C][C]-0.0454[/C][C]0.51802[/C][/ROW]
[ROW][C]20[/C][C]-0.019197[/C][C]-0.1487[/C][C]0.558857[/C][/ROW]
[ROW][C]21[/C][C]0.049174[/C][C]0.3809[/C][C]0.352312[/C][/ROW]
[ROW][C]22[/C][C]-0.13634[/C][C]-1.0561[/C][C]0.852418[/C][/ROW]
[ROW][C]23[/C][C]-0.068075[/C][C]-0.5273[/C][C]0.700037[/C][/ROW]
[ROW][C]24[/C][C]0.069705[/C][C]0.5399[/C][C]0.29562[/C][/ROW]
[ROW][C]25[/C][C]-0.080109[/C][C]-0.6205[/C][C]0.731368[/C][/ROW]
[ROW][C]26[/C][C]-0.103844[/C][C]-0.8044[/C][C]0.787821[/C][/ROW]
[ROW][C]27[/C][C]-0.061049[/C][C]-0.4729[/C][C]0.680993[/C][/ROW]
[ROW][C]28[/C][C]-0.197765[/C][C]-1.5319[/C][C]0.934596[/C][/ROW]
[ROW][C]29[/C][C]-0.150997[/C][C]-1.1696[/C][C]0.87661[/C][/ROW]
[ROW][C]30[/C][C]-0.065136[/C][C]-0.5045[/C][C]0.692135[/C][/ROW]
[ROW][C]31[/C][C]-0.164187[/C][C]-1.2718[/C][C]0.895821[/C][/ROW]
[ROW][C]32[/C][C]-0.137369[/C][C]-1.0641[/C][C]0.854217[/C][/ROW]
[ROW][C]33[/C][C]-0.135114[/C][C]-1.0466[/C][C]0.850257[/C][/ROW]
[ROW][C]34[/C][C]-0.234155[/C][C]-1.8138[/C][C]0.962642[/C][/ROW]
[ROW][C]35[/C][C]-0.194153[/C][C]-1.5039[/C][C]0.931074[/C][/ROW]
[/TABLE]
Source: https://freestatistics.org/blog/index.php?pk=2224&T=1

Globally Unique Identifier (entire table): ba.freestatistics.org/blog/index.php?pk=2224&T=1

As an alternative you can also use a QR Code:  

The GUIDs for individual cells are displayed in the table below:

Autocorrelation Function
Time lag kACF(k)T-STATP-value
017.7460
10.6100694.72567e-06
20.489913.79480.000173
30.646075.00443e-06
40.4090833.16870.001205
50.4005783.10290.001461
60.5884614.55821.3e-05
70.3266092.52990.007027
80.2396631.85640.034153
90.3864492.99340.002001
100.1649081.27740.103197
110.2132051.65150.051933
120.4305813.33530.000733
130.1913581.48220.071754
140.1239460.96010.170434
150.2015791.56140.061842
160.0181330.14050.444385
170.0156530.12120.451949
180.1740681.34830.091311
19-0.005858-0.04540.51802
20-0.019197-0.14870.558857
210.0491740.38090.352312
22-0.13634-1.05610.852418
23-0.068075-0.52730.700037
240.0697050.53990.29562
25-0.080109-0.62050.731368
26-0.103844-0.80440.787821
27-0.061049-0.47290.680993
28-0.197765-1.53190.934596
29-0.150997-1.16960.87661
30-0.065136-0.50450.692135
31-0.164187-1.27180.895821
32-0.137369-1.06410.854217
33-0.135114-1.04660.850257
34-0.234155-1.81380.962642
35-0.194153-1.50390.931074


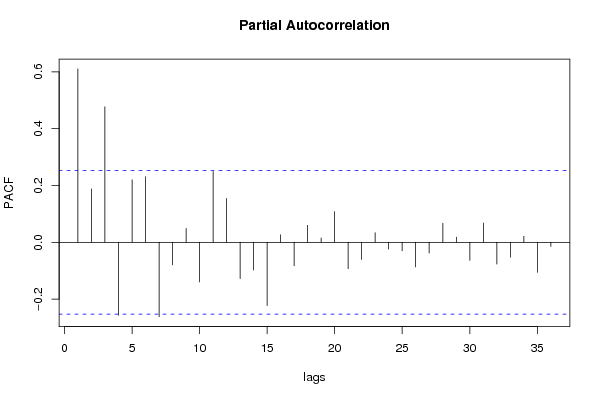
Partial Autocorrelation Function
Time lag kPACF(k)T-STATP-value
00.6100694.72567e-06
10.1875171.45250.075787
20.4768353.69350.00024
3-0.257181-1.99210.974543
40.2196271.70120.047039
50.2306651.78670.039517
6-0.261899-2.02870.976531
7-0.079309-0.61430.729339
80.0487080.37730.353646
9-0.139656-1.08180.858158
100.2492171.93040.029142
110.1543431.19550.118291
12-0.127672-0.98890.836669
13-0.097852-0.7580.774278
14-0.222957-1.7270.955345
150.026280.20360.419691
16-0.083146-0.6440.739
170.0596380.4620.322893
180.0149360.11570.454141
190.1081290.83760.202799
20-0.09294-0.71990.762812
21-0.060309-0.46720.678958
220.0337020.26110.397472
23-0.023981-0.18580.573368
24-0.030098-0.23310.591777
25-0.086804-0.67240.748039
26-0.038219-0.2960.615889
270.0670610.51940.302679
280.0178230.13810.44533
29-0.063701-0.49340.688244
300.0673680.52180.301855
31-0.076859-0.59530.723074
32-0.052458-0.40630.657029
330.0208110.16120.436237
34-0.105839-0.81980.792219
35-0.014779-0.11450.545381

\begin{tabular}{lllllllll}
\hline
Partial Autocorrelation Function \tabularnewline
Time lag k & PACF(k) & T-STAT & P-value \tabularnewline
0 & 0.610069 & 4.7256 & 7e-06 \tabularnewline
1 & 0.187517 & 1.4525 & 0.075787 \tabularnewline
2 & 0.476835 & 3.6935 & 0.00024 \tabularnewline
3 & -0.257181 & -1.9921 & 0.974543 \tabularnewline
4 & 0.219627 & 1.7012 & 0.047039 \tabularnewline
5 & 0.230665 & 1.7867 & 0.039517 \tabularnewline
6 & -0.261899 & -2.0287 & 0.976531 \tabularnewline
7 & -0.079309 & -0.6143 & 0.729339 \tabularnewline
8 & 0.048708 & 0.3773 & 0.353646 \tabularnewline
9 & -0.139656 & -1.0818 & 0.858158 \tabularnewline
10 & 0.249217 & 1.9304 & 0.029142 \tabularnewline
11 & 0.154343 & 1.1955 & 0.118291 \tabularnewline
12 & -0.127672 & -0.9889 & 0.836669 \tabularnewline
13 & -0.097852 & -0.758 & 0.774278 \tabularnewline
14 & -0.222957 & -1.727 & 0.955345 \tabularnewline
15 & 0.02628 & 0.2036 & 0.419691 \tabularnewline
16 & -0.083146 & -0.644 & 0.739 \tabularnewline
17 & 0.059638 & 0.462 & 0.322893 \tabularnewline
18 & 0.014936 & 0.1157 & 0.454141 \tabularnewline
19 & 0.108129 & 0.8376 & 0.202799 \tabularnewline
20 & -0.09294 & -0.7199 & 0.762812 \tabularnewline
21 & -0.060309 & -0.4672 & 0.678958 \tabularnewline
22 & 0.033702 & 0.2611 & 0.397472 \tabularnewline
23 & -0.023981 & -0.1858 & 0.573368 \tabularnewline
24 & -0.030098 & -0.2331 & 0.591777 \tabularnewline
25 & -0.086804 & -0.6724 & 0.748039 \tabularnewline
26 & -0.038219 & -0.296 & 0.615889 \tabularnewline
27 & 0.067061 & 0.5194 & 0.302679 \tabularnewline
28 & 0.017823 & 0.1381 & 0.44533 \tabularnewline
29 & -0.063701 & -0.4934 & 0.688244 \tabularnewline
30 & 0.067368 & 0.5218 & 0.301855 \tabularnewline
31 & -0.076859 & -0.5953 & 0.723074 \tabularnewline
32 & -0.052458 & -0.4063 & 0.657029 \tabularnewline
33 & 0.020811 & 0.1612 & 0.436237 \tabularnewline
34 & -0.105839 & -0.8198 & 0.792219 \tabularnewline
35 & -0.014779 & -0.1145 & 0.545381 \tabularnewline
\hline
\end{tabular}
%Source: https://freestatistics.org/blog/index.php?pk=2224&T=2

[TABLE]
[ROW][C]Partial Autocorrelation Function[/C][/ROW]
[ROW][C]Time lag k[/C][C]PACF(k)[/C][C]T-STAT[/C][C]P-value[/C][/ROW]
[ROW][C]0[/C][C]0.610069[/C][C]4.7256[/C][C]7e-06[/C][/ROW]
[ROW][C]1[/C][C]0.187517[/C][C]1.4525[/C][C]0.075787[/C][/ROW]
[ROW][C]2[/C][C]0.476835[/C][C]3.6935[/C][C]0.00024[/C][/ROW]
[ROW][C]3[/C][C]-0.257181[/C][C]-1.9921[/C][C]0.974543[/C][/ROW]
[ROW][C]4[/C][C]0.219627[/C][C]1.7012[/C][C]0.047039[/C][/ROW]
[ROW][C]5[/C][C]0.230665[/C][C]1.7867[/C][C]0.039517[/C][/ROW]
[ROW][C]6[/C][C]-0.261899[/C][C]-2.0287[/C][C]0.976531[/C][/ROW]
[ROW][C]7[/C][C]-0.079309[/C][C]-0.6143[/C][C]0.729339[/C][/ROW]
[ROW][C]8[/C][C]0.048708[/C][C]0.3773[/C][C]0.353646[/C][/ROW]
[ROW][C]9[/C][C]-0.139656[/C][C]-1.0818[/C][C]0.858158[/C][/ROW]
[ROW][C]10[/C][C]0.249217[/C][C]1.9304[/C][C]0.029142[/C][/ROW]
[ROW][C]11[/C][C]0.154343[/C][C]1.1955[/C][C]0.118291[/C][/ROW]
[ROW][C]12[/C][C]-0.127672[/C][C]-0.9889[/C][C]0.836669[/C][/ROW]
[ROW][C]13[/C][C]-0.097852[/C][C]-0.758[/C][C]0.774278[/C][/ROW]
[ROW][C]14[/C][C]-0.222957[/C][C]-1.727[/C][C]0.955345[/C][/ROW]
[ROW][C]15[/C][C]0.02628[/C][C]0.2036[/C][C]0.419691[/C][/ROW]
[ROW][C]16[/C][C]-0.083146[/C][C]-0.644[/C][C]0.739[/C][/ROW]
[ROW][C]17[/C][C]0.059638[/C][C]0.462[/C][C]0.322893[/C][/ROW]
[ROW][C]18[/C][C]0.014936[/C][C]0.1157[/C][C]0.454141[/C][/ROW]
[ROW][C]19[/C][C]0.108129[/C][C]0.8376[/C][C]0.202799[/C][/ROW]
[ROW][C]20[/C][C]-0.09294[/C][C]-0.7199[/C][C]0.762812[/C][/ROW]
[ROW][C]21[/C][C]-0.060309[/C][C]-0.4672[/C][C]0.678958[/C][/ROW]
[ROW][C]22[/C][C]0.033702[/C][C]0.2611[/C][C]0.397472[/C][/ROW]
[ROW][C]23[/C][C]-0.023981[/C][C]-0.1858[/C][C]0.573368[/C][/ROW]
[ROW][C]24[/C][C]-0.030098[/C][C]-0.2331[/C][C]0.591777[/C][/ROW]
[ROW][C]25[/C][C]-0.086804[/C][C]-0.6724[/C][C]0.748039[/C][/ROW]
[ROW][C]26[/C][C]-0.038219[/C][C]-0.296[/C][C]0.615889[/C][/ROW]
[ROW][C]27[/C][C]0.067061[/C][C]0.5194[/C][C]0.302679[/C][/ROW]
[ROW][C]28[/C][C]0.017823[/C][C]0.1381[/C][C]0.44533[/C][/ROW]
[ROW][C]29[/C][C]-0.063701[/C][C]-0.4934[/C][C]0.688244[/C][/ROW]
[ROW][C]30[/C][C]0.067368[/C][C]0.5218[/C][C]0.301855[/C][/ROW]
[ROW][C]31[/C][C]-0.076859[/C][C]-0.5953[/C][C]0.723074[/C][/ROW]
[ROW][C]32[/C][C]-0.052458[/C][C]-0.4063[/C][C]0.657029[/C][/ROW]
[ROW][C]33[/C][C]0.020811[/C][C]0.1612[/C][C]0.436237[/C][/ROW]
[ROW][C]34[/C][C]-0.105839[/C][C]-0.8198[/C][C]0.792219[/C][/ROW]
[ROW][C]35[/C][C]-0.014779[/C][C]-0.1145[/C][C]0.545381[/C][/ROW]
[/TABLE]
Source: https://freestatistics.org/blog/index.php?pk=2224&T=2

Globally Unique Identifier (entire table): ba.freestatistics.org/blog/index.php?pk=2224&T=2

As an alternative you can also use a QR Code:  

The GUIDs for individual cells are displayed in the table below:

Partial Autocorrelation Function
Time lag kPACF(k)T-STATP-value
00.6100694.72567e-06
10.1875171.45250.075787
20.4768353.69350.00024
3-0.257181-1.99210.974543
40.2196271.70120.047039
50.2306651.78670.039517
6-0.261899-2.02870.976531
7-0.079309-0.61430.729339
80.0487080.37730.353646
9-0.139656-1.08180.858158
100.2492171.93040.029142
110.1543431.19550.118291
12-0.127672-0.98890.836669
13-0.097852-0.7580.774278
14-0.222957-1.7270.955345
150.026280.20360.419691
16-0.083146-0.6440.739
170.0596380.4620.322893
180.0149360.11570.454141
190.1081290.83760.202799
20-0.09294-0.71990.762812
21-0.060309-0.46720.678958
220.0337020.26110.397472
23-0.023981-0.18580.573368
24-0.030098-0.23310.591777
25-0.086804-0.67240.748039
26-0.038219-0.2960.615889
270.0670610.51940.302679
280.0178230.13810.44533
29-0.063701-0.49340.688244
300.0673680.52180.301855
31-0.076859-0.59530.723074
32-0.052458-0.40630.657029
330.0208110.16120.436237
34-0.105839-0.81980.792219
35-0.014779-0.11450.545381


Parameters (Session):
par1 = 36 ; par2 = 1 ; par3 = 0 ; par4 = 0 ; par5 = 12 ;
Parameters (R input):
par1 = 36 ; par2 = 1 ; par3 = 0 ; par4 = 0 ; par5 = 12 ;
R code (references can be found in the software module):
if (par1 == 'Default') {
par1 = 10*log10(length(x))
} else {
par1 <- as.numeric(par1)
}
par2 <- as.numeric(par2)
par3 <- as.numeric(par3)
par4 <- as.numeric(par4)
par5 <- as.numeric(par5)
if (par2 == 0) {
x <- log(x)
} else {
x <- (x ^ par2 - 1) / par2
}
if (par3 > 0) x <- diff(x,lag=1,difference=par3)
if (par4 > 0) x <- diff(x,lag=par5,difference=par4)
bitmap(file='pic1.png')
racf <- acf(x,par1,main='Autocorrelation',xlab='lags',ylab='ACF')
dev.off()
bitmap(file='pic2.png')
rpacf <- pacf(x,par1,main='Partial Autocorrelation',xlab='lags',ylab='PACF')
dev.off()
(myacf <- c(racf$acf))
(mypacf <- c(rpacf$acf))
lengthx <- length(x)
sqrtn <- sqrt(lengthx)
load(file='createtable')
a<-table.start()
a<-table.row.start(a)
a<-table.element(a,'Autocorrelation Function',4,TRUE)
a<-table.row.end(a)
a<-table.row.start(a)
a<-table.element(a,'Time lag k',header=TRUE)
a<-table.element(a,hyperlink('basics.htm','ACF(k)','click here for more information about the Autocorrelation Function'),header=TRUE)
a<-table.element(a,'T-STAT',header=TRUE)
a<-table.element(a,'P-value',header=TRUE)
a<-table.row.end(a)
for (i in 1:par1) {
a<-table.row.start(a)
a<-table.element(a,i-1,header=TRUE)
a<-table.element(a,round(myacf[i],6))
mytstat <- myacf[i]*sqrtn
a<-table.element(a,round(mytstat,4))
a<-table.element(a,round(1-pt(mytstat,lengthx),6))
a<-table.row.end(a)
}
a<-table.end(a)
table.save(a,file='mytable.tab')
a<-table.start()
a<-table.row.start(a)
a<-table.element(a,'Partial Autocorrelation Function',4,TRUE)
a<-table.row.end(a)
a<-table.row.start(a)
a<-table.element(a,'Time lag k',header=TRUE)
a<-table.element(a,hyperlink('basics.htm','PACF(k)','click here for more information about the Partial Autocorrelation Function'),header=TRUE)
a<-table.element(a,'T-STAT',header=TRUE)
a<-table.element(a,'P-value',header=TRUE)
a<-table.row.end(a)
for (i in 1:par1) {
a<-table.row.start(a)
a<-table.element(a,i-1,header=TRUE)
a<-table.element(a,round(mypacf[i],6))
mytstat <- mypacf[i]*sqrtn
a<-table.element(a,round(mytstat,4))
a<-table.element(a,round(1-pt(mytstat,lengthx),6))
a<-table.row.end(a)
}
a<-table.end(a)
table.save(a,file='mytable1.tab')