Free Statistics

of Irreproducible Research!

Author's title

Author*Unverified author*
R Software Modulerwasp_autocorrelation.wasp
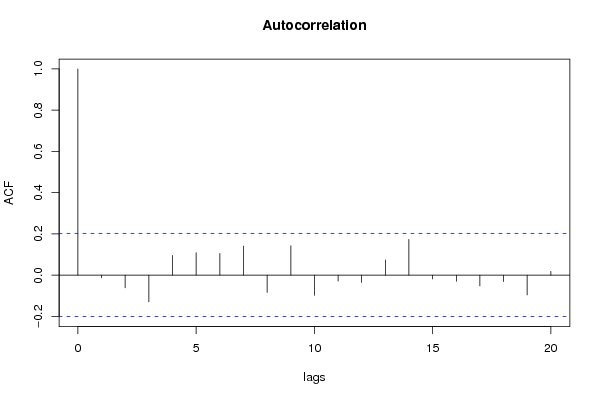
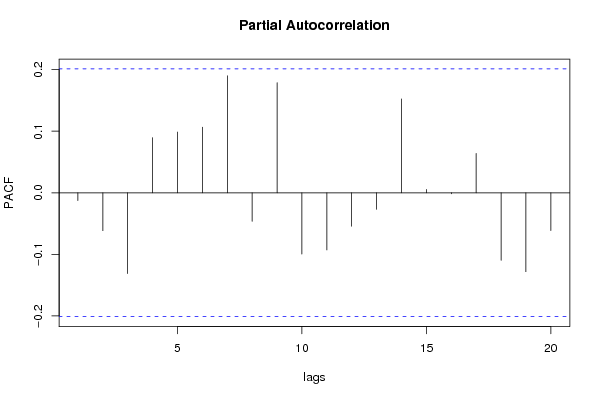
Title produced by software(Partial) Autocorrelation Function
Date of computationSat, 01 Dec 2007 05:04:37 -0700
Cite this page as followsStatistical Computations at FreeStatistics.org, Office for Research Development and Education, URL https://freestatistics.org/blog/index.php?v=date/2007/Dec/01/t11965100550nc355zvd6mwr8q.htm/, Retrieved Sun, 19 May 2024 19:42:21 +0000
Statistical Computations at FreeStatistics.org, Office for Research Development and Education, URL https://freestatistics.org/blog/index.php?pk=2221, Retrieved Sun, 19 May 2024 19:42:21 +0000
QR Codes:

Original text written by user:
IsPrivate?No (this computation is public)
User-defined keywords
Estimated Impact227
Family? (F = Feedback message, R = changed R code, M = changed R Module, P = changed Parameters, D = changed Data)
-       [(Partial) Autocorrelation Function] [autocorrelation w...] [2007-12-01 12:04:37] [bd02e85be52eb1cb060a2c60779eb820] [Current]
Feedback Forum

Post a new message
Dataseries X:
134066
130104
123090
116598
109627
105428
137272
159836
155283
141514
131852
130691
128461
123066
117599
111599
105395
102334
131305
149033
144954
132404
122104
118755
116222
110924
103753
99983
93302
91496
119321
139261
133739
123913
113438
109416
109406
105645
101328
97686
93093
91382
122257
139183
139887
131822
116805
113706
113012
110452
107005
102841
98173
98181
137277
147579
146571
138920
130340
128140
127059
122860
117702
113537
108366
111078
150739
159129
157928
147768
137507
136919
136151
133001
125554
119647
114158
116193
152803
161761
160942
149470
139208
134588
130322
126611
122401
117352
112135
112879
148729
157230
157221
146681
136524
132111
125326
122716
116615
113719
110737
112093
143565
149946
149147
134339
122683
115614


Summary of compuational transaction
Raw Inputview raw input (R code)
Raw Outputview raw output of R engine
Computing time1 seconds
R Server'Gwilym Jenkins' @ 72.249.127.135

\begin{tabular}{lllllllll}
\hline
Summary of compuational transaction \tabularnewline
Raw Input & view raw input (R code)  \tabularnewline
Raw Output & view raw output of R engine  \tabularnewline
Computing time & 1 seconds \tabularnewline
R Server & 'Gwilym Jenkins' @ 72.249.127.135 \tabularnewline
\hline
\end{tabular}
%Source: https://freestatistics.org/blog/index.php?pk=2221&T=0

[TABLE]
[ROW][C]Summary of compuational transaction[/C][/ROW]
[ROW][C]Raw Input[/C][C]view raw input (R code) [/C][/ROW]
[ROW][C]Raw Output[/C][C]view raw output of R engine [/C][/ROW]
[ROW][C]Computing time[/C][C]1 seconds[/C][/ROW]
[ROW][C]R Server[/C][C]'Gwilym Jenkins' @ 72.249.127.135[/C][/ROW]
[/TABLE]
Source: https://freestatistics.org/blog/index.php?pk=2221&T=0

Globally Unique Identifier (entire table): ba.freestatistics.org/blog/index.php?pk=2221&T=0

As an alternative you can also use a QR Code:  

The GUIDs for individual cells are displayed in the table below:

Summary of compuational transaction
Raw Inputview raw input (R code)
Raw Outputview raw output of R engine
Computing time1 seconds
R Server'Gwilym Jenkins' @ 72.249.127.135


Autocorrelation Function
Time lag kACF(k)T-STATP-value
019.74680
1-0.012567-0.12250.548615
2-0.061289-0.59740.724161
3-0.128984-1.25720.894115
40.0957990.93370.176404
50.1090961.06330.145163
60.1052611.0260.153758
70.1413551.37780.085757
8-0.083572-0.81460.79132
90.1426491.39040.083833
10-0.097527-0.95060.827883
11-0.028744-0.28020.610017
12-0.03493-0.34050.632869
130.0738390.71970.236739
140.1735521.69160.047002
15-0.018319-0.17860.570666
16-0.02953-0.28780.612944
17-0.051872-0.50560.692842
18-0.030809-0.30030.617693
19-0.096064-0.93630.824258

\begin{tabular}{lllllllll}
\hline
Autocorrelation Function \tabularnewline
Time lag k & ACF(k) & T-STAT & P-value \tabularnewline
0 & 1 & 9.7468 & 0 \tabularnewline
1 & -0.012567 & -0.1225 & 0.548615 \tabularnewline
2 & -0.061289 & -0.5974 & 0.724161 \tabularnewline
3 & -0.128984 & -1.2572 & 0.894115 \tabularnewline
4 & 0.095799 & 0.9337 & 0.176404 \tabularnewline
5 & 0.109096 & 1.0633 & 0.145163 \tabularnewline
6 & 0.105261 & 1.026 & 0.153758 \tabularnewline
7 & 0.141355 & 1.3778 & 0.085757 \tabularnewline
8 & -0.083572 & -0.8146 & 0.79132 \tabularnewline
9 & 0.142649 & 1.3904 & 0.083833 \tabularnewline
10 & -0.097527 & -0.9506 & 0.827883 \tabularnewline
11 & -0.028744 & -0.2802 & 0.610017 \tabularnewline
12 & -0.03493 & -0.3405 & 0.632869 \tabularnewline
13 & 0.073839 & 0.7197 & 0.236739 \tabularnewline
14 & 0.173552 & 1.6916 & 0.047002 \tabularnewline
15 & -0.018319 & -0.1786 & 0.570666 \tabularnewline
16 & -0.02953 & -0.2878 & 0.612944 \tabularnewline
17 & -0.051872 & -0.5056 & 0.692842 \tabularnewline
18 & -0.030809 & -0.3003 & 0.617693 \tabularnewline
19 & -0.096064 & -0.9363 & 0.824258 \tabularnewline
\hline
\end{tabular}
%Source: https://freestatistics.org/blog/index.php?pk=2221&T=1

[TABLE]
[ROW][C]Autocorrelation Function[/C][/ROW]
[ROW][C]Time lag k[/C][C]ACF(k)[/C][C]T-STAT[/C][C]P-value[/C][/ROW]
[ROW][C]0[/C][C]1[/C][C]9.7468[/C][C]0[/C][/ROW]
[ROW][C]1[/C][C]-0.012567[/C][C]-0.1225[/C][C]0.548615[/C][/ROW]
[ROW][C]2[/C][C]-0.061289[/C][C]-0.5974[/C][C]0.724161[/C][/ROW]
[ROW][C]3[/C][C]-0.128984[/C][C]-1.2572[/C][C]0.894115[/C][/ROW]
[ROW][C]4[/C][C]0.095799[/C][C]0.9337[/C][C]0.176404[/C][/ROW]
[ROW][C]5[/C][C]0.109096[/C][C]1.0633[/C][C]0.145163[/C][/ROW]
[ROW][C]6[/C][C]0.105261[/C][C]1.026[/C][C]0.153758[/C][/ROW]
[ROW][C]7[/C][C]0.141355[/C][C]1.3778[/C][C]0.085757[/C][/ROW]
[ROW][C]8[/C][C]-0.083572[/C][C]-0.8146[/C][C]0.79132[/C][/ROW]
[ROW][C]9[/C][C]0.142649[/C][C]1.3904[/C][C]0.083833[/C][/ROW]
[ROW][C]10[/C][C]-0.097527[/C][C]-0.9506[/C][C]0.827883[/C][/ROW]
[ROW][C]11[/C][C]-0.028744[/C][C]-0.2802[/C][C]0.610017[/C][/ROW]
[ROW][C]12[/C][C]-0.03493[/C][C]-0.3405[/C][C]0.632869[/C][/ROW]
[ROW][C]13[/C][C]0.073839[/C][C]0.7197[/C][C]0.236739[/C][/ROW]
[ROW][C]14[/C][C]0.173552[/C][C]1.6916[/C][C]0.047002[/C][/ROW]
[ROW][C]15[/C][C]-0.018319[/C][C]-0.1786[/C][C]0.570666[/C][/ROW]
[ROW][C]16[/C][C]-0.02953[/C][C]-0.2878[/C][C]0.612944[/C][/ROW]
[ROW][C]17[/C][C]-0.051872[/C][C]-0.5056[/C][C]0.692842[/C][/ROW]
[ROW][C]18[/C][C]-0.030809[/C][C]-0.3003[/C][C]0.617693[/C][/ROW]
[ROW][C]19[/C][C]-0.096064[/C][C]-0.9363[/C][C]0.824258[/C][/ROW]
[/TABLE]
Source: https://freestatistics.org/blog/index.php?pk=2221&T=1

Globally Unique Identifier (entire table): ba.freestatistics.org/blog/index.php?pk=2221&T=1

As an alternative you can also use a QR Code:  

The GUIDs for individual cells are displayed in the table below:

Autocorrelation Function
Time lag kACF(k)T-STATP-value
019.74680
1-0.012567-0.12250.548615
2-0.061289-0.59740.724161
3-0.128984-1.25720.894115
40.0957990.93370.176404
50.1090961.06330.145163
60.1052611.0260.153758
70.1413551.37780.085757
8-0.083572-0.81460.79132
90.1426491.39040.083833
10-0.097527-0.95060.827883
11-0.028744-0.28020.610017
12-0.03493-0.34050.632869
130.0738390.71970.236739
140.1735521.69160.047002
15-0.018319-0.17860.570666
16-0.02953-0.28780.612944
17-0.051872-0.50560.692842
18-0.030809-0.30030.617693
19-0.096064-0.93630.824258


Partial Autocorrelation Function
Time lag kPACF(k)T-STATP-value
0-0.012567-0.12250.548615
1-0.061457-0.5990.724704
2-0.13109-1.27770.897766
30.08940.87140.192876
40.0986540.96160.169356
50.1065021.03810.15094
60.190051.85240.033538
7-0.046281-0.45110.673525
80.178831.7430.042283
9-0.099465-0.96950.832612
10-0.092765-0.90420.815903
11-0.054289-0.52910.70103
12-0.026908-0.26230.603159
130.1524251.48570.070341
140.0055180.05380.478609
15-0.001637-0.0160.506347
160.0639360.62320.267334
17-0.109626-1.06850.855999
18-0.12809-1.24850.892537
19-0.061413-0.59860.724561

\begin{tabular}{lllllllll}
\hline
Partial Autocorrelation Function \tabularnewline
Time lag k & PACF(k) & T-STAT & P-value \tabularnewline
0 & -0.012567 & -0.1225 & 0.548615 \tabularnewline
1 & -0.061457 & -0.599 & 0.724704 \tabularnewline
2 & -0.13109 & -1.2777 & 0.897766 \tabularnewline
3 & 0.0894 & 0.8714 & 0.192876 \tabularnewline
4 & 0.098654 & 0.9616 & 0.169356 \tabularnewline
5 & 0.106502 & 1.0381 & 0.15094 \tabularnewline
6 & 0.19005 & 1.8524 & 0.033538 \tabularnewline
7 & -0.046281 & -0.4511 & 0.673525 \tabularnewline
8 & 0.17883 & 1.743 & 0.042283 \tabularnewline
9 & -0.099465 & -0.9695 & 0.832612 \tabularnewline
10 & -0.092765 & -0.9042 & 0.815903 \tabularnewline
11 & -0.054289 & -0.5291 & 0.70103 \tabularnewline
12 & -0.026908 & -0.2623 & 0.603159 \tabularnewline
13 & 0.152425 & 1.4857 & 0.070341 \tabularnewline
14 & 0.005518 & 0.0538 & 0.478609 \tabularnewline
15 & -0.001637 & -0.016 & 0.506347 \tabularnewline
16 & 0.063936 & 0.6232 & 0.267334 \tabularnewline
17 & -0.109626 & -1.0685 & 0.855999 \tabularnewline
18 & -0.12809 & -1.2485 & 0.892537 \tabularnewline
19 & -0.061413 & -0.5986 & 0.724561 \tabularnewline
\hline
\end{tabular}
%Source: https://freestatistics.org/blog/index.php?pk=2221&T=2

[TABLE]
[ROW][C]Partial Autocorrelation Function[/C][/ROW]
[ROW][C]Time lag k[/C][C]PACF(k)[/C][C]T-STAT[/C][C]P-value[/C][/ROW]
[ROW][C]0[/C][C]-0.012567[/C][C]-0.1225[/C][C]0.548615[/C][/ROW]
[ROW][C]1[/C][C]-0.061457[/C][C]-0.599[/C][C]0.724704[/C][/ROW]
[ROW][C]2[/C][C]-0.13109[/C][C]-1.2777[/C][C]0.897766[/C][/ROW]
[ROW][C]3[/C][C]0.0894[/C][C]0.8714[/C][C]0.192876[/C][/ROW]
[ROW][C]4[/C][C]0.098654[/C][C]0.9616[/C][C]0.169356[/C][/ROW]
[ROW][C]5[/C][C]0.106502[/C][C]1.0381[/C][C]0.15094[/C][/ROW]
[ROW][C]6[/C][C]0.19005[/C][C]1.8524[/C][C]0.033538[/C][/ROW]
[ROW][C]7[/C][C]-0.046281[/C][C]-0.4511[/C][C]0.673525[/C][/ROW]
[ROW][C]8[/C][C]0.17883[/C][C]1.743[/C][C]0.042283[/C][/ROW]
[ROW][C]9[/C][C]-0.099465[/C][C]-0.9695[/C][C]0.832612[/C][/ROW]
[ROW][C]10[/C][C]-0.092765[/C][C]-0.9042[/C][C]0.815903[/C][/ROW]
[ROW][C]11[/C][C]-0.054289[/C][C]-0.5291[/C][C]0.70103[/C][/ROW]
[ROW][C]12[/C][C]-0.026908[/C][C]-0.2623[/C][C]0.603159[/C][/ROW]
[ROW][C]13[/C][C]0.152425[/C][C]1.4857[/C][C]0.070341[/C][/ROW]
[ROW][C]14[/C][C]0.005518[/C][C]0.0538[/C][C]0.478609[/C][/ROW]
[ROW][C]15[/C][C]-0.001637[/C][C]-0.016[/C][C]0.506347[/C][/ROW]
[ROW][C]16[/C][C]0.063936[/C][C]0.6232[/C][C]0.267334[/C][/ROW]
[ROW][C]17[/C][C]-0.109626[/C][C]-1.0685[/C][C]0.855999[/C][/ROW]
[ROW][C]18[/C][C]-0.12809[/C][C]-1.2485[/C][C]0.892537[/C][/ROW]
[ROW][C]19[/C][C]-0.061413[/C][C]-0.5986[/C][C]0.724561[/C][/ROW]
[/TABLE]
Source: https://freestatistics.org/blog/index.php?pk=2221&T=2

Globally Unique Identifier (entire table): ba.freestatistics.org/blog/index.php?pk=2221&T=2

As an alternative you can also use a QR Code:  

The GUIDs for individual cells are displayed in the table below:

Partial Autocorrelation Function
Time lag kPACF(k)T-STATP-value
0-0.012567-0.12250.548615
1-0.061457-0.5990.724704
2-0.13109-1.27770.897766
30.08940.87140.192876
40.0986540.96160.169356
50.1065021.03810.15094
60.190051.85240.033538
7-0.046281-0.45110.673525
80.178831.7430.042283
9-0.099465-0.96950.832612
10-0.092765-0.90420.815903
11-0.054289-0.52910.70103
12-0.026908-0.26230.603159
130.1524251.48570.070341
140.0055180.05380.478609
15-0.001637-0.0160.506347
160.0639360.62320.267334
17-0.109626-1.06850.855999
18-0.12809-1.24850.892537
19-0.061413-0.59860.724561


Parameters (Session):
par1 = Default ; par2 = 1 ; par3 = 1 ; par4 = 1 ; par5 = 12 ;
Parameters (R input):
par1 = Default ; par2 = 1 ; par3 = 1 ; par4 = 1 ; par5 = 12 ;
R code (references can be found in the software module):
if (par1 == 'Default') {
par1 = 10*log10(length(x))
} else {
par1 <- as.numeric(par1)
}
par2 <- as.numeric(par2)
par3 <- as.numeric(par3)
par4 <- as.numeric(par4)
par5 <- as.numeric(par5)
if (par2 == 0) {
x <- log(x)
} else {
x <- (x ^ par2 - 1) / par2
}
if (par3 > 0) x <- diff(x,lag=1,difference=par3)
if (par4 > 0) x <- diff(x,lag=par5,difference=par4)
bitmap(file='pic1.png')
racf <- acf(x,par1,main='Autocorrelation',xlab='lags',ylab='ACF')
dev.off()
bitmap(file='pic2.png')
rpacf <- pacf(x,par1,main='Partial Autocorrelation',xlab='lags',ylab='PACF')
dev.off()
(myacf <- c(racf$acf))
(mypacf <- c(rpacf$acf))
lengthx <- length(x)
sqrtn <- sqrt(lengthx)
load(file='createtable')
a<-table.start()
a<-table.row.start(a)
a<-table.element(a,'Autocorrelation Function',4,TRUE)
a<-table.row.end(a)
a<-table.row.start(a)
a<-table.element(a,'Time lag k',header=TRUE)
a<-table.element(a,hyperlink('basics.htm','ACF(k)','click here for more information about the Autocorrelation Function'),header=TRUE)
a<-table.element(a,'T-STAT',header=TRUE)
a<-table.element(a,'P-value',header=TRUE)
a<-table.row.end(a)
for (i in 1:par1) {
a<-table.row.start(a)
a<-table.element(a,i-1,header=TRUE)
a<-table.element(a,round(myacf[i],6))
mytstat <- myacf[i]*sqrtn
a<-table.element(a,round(mytstat,4))
a<-table.element(a,round(1-pt(mytstat,lengthx),6))
a<-table.row.end(a)
}
a<-table.end(a)
table.save(a,file='mytable.tab')
a<-table.start()
a<-table.row.start(a)
a<-table.element(a,'Partial Autocorrelation Function',4,TRUE)
a<-table.row.end(a)
a<-table.row.start(a)
a<-table.element(a,'Time lag k',header=TRUE)
a<-table.element(a,hyperlink('basics.htm','PACF(k)','click here for more information about the Partial Autocorrelation Function'),header=TRUE)
a<-table.element(a,'T-STAT',header=TRUE)
a<-table.element(a,'P-value',header=TRUE)
a<-table.row.end(a)
for (i in 1:par1) {
a<-table.row.start(a)
a<-table.element(a,i-1,header=TRUE)
a<-table.element(a,round(mypacf[i],6))
mytstat <- mypacf[i]*sqrtn
a<-table.element(a,round(mytstat,4))
a<-table.element(a,round(1-pt(mytstat,lengthx),6))
a<-table.row.end(a)
}
a<-table.end(a)
table.save(a,file='mytable1.tab')