| Multiple Linear Regression - Estimated Regression Equation |
| a[t] = + 130.707 + 1.06171b[t] -1.38299c[t] + e[t] |
| Multiple Linear Regression - Ordinary Least Squares | |||||
| Variable | Parameter | S.D. | T-STAT H0: parameter = 0 | 2-tail p-value | 1-tail p-value |
| (Intercept) | +130.7 | 27.09 | +4.8240e+00 | 0.00027 | 0.000135 |
| b | +1.062 | 0.2667 | +3.9810e+00 | 0.001365 | 0.0006826 |
| c | -1.383 | 0.08381 | -1.6500e+01 | 1.433e-10 | 7.163e-11 |
| Multiple Linear Regression - Regression Statistics | |
| Multiple R | 0.9753 |
| R-squared | 0.9513 |
| Adjusted R-squared | 0.9443 |
| F-TEST (value) | 136.7 |
| F-TEST (DF numerator) | 2 |
| F-TEST (DF denominator) | 14 |
| p-value | 6.514e-10 |
| Multiple Linear Regression - Residual Statistics | |
| Residual Standard Deviation | 5.563 |
| Sum Squared Residuals | 433.3 |
| Menu of Residual Diagnostics | |
| Description | Link |
| Histogram | Compute |
| Central Tendency | Compute |
| QQ Plot | Compute |
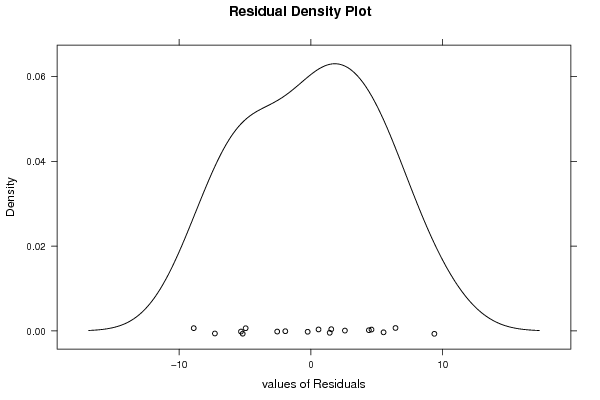
| Kernel Density Plot | Compute |
| Skewness/Kurtosis Test | Compute |
| Skewness-Kurtosis Plot | Compute |
| Harrell-Davis Plot | Compute |
| Bootstrap Plot -- Central Tendency | Compute |
| Blocked Bootstrap Plot -- Central Tendency | Compute |
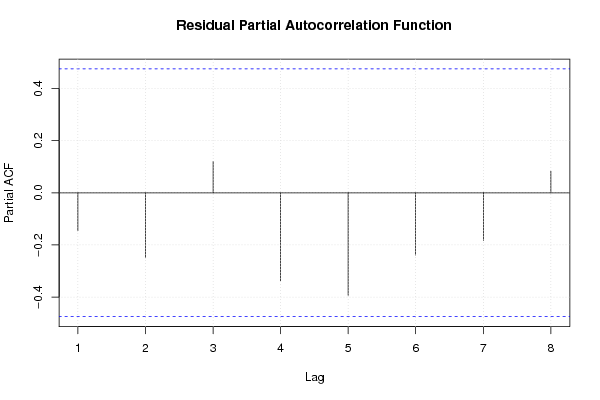
| (Partial) Autocorrelation Plot | Compute |
| Spectral Analysis | Compute |
| Tukey lambda PPCC Plot | Compute |
| Box-Cox Normality Plot | Compute |
| Summary Statistics | Compute |
| Multiple Linear Regression - Actuals, Interpolation, and Residuals | |||
| Time or Index | Actuals | Interpolation Forecast | Residuals Prediction Error |
| 1 | 99.2 | 93.69 | 5.508 |
| 2 | 99 | 96.42 | 2.577 |
| 3 | 100 | 98.58 | 1.421 |
| 4 | 111.6 | 116.8 | -5.181 |
| 5 | 122.2 | 122.5 | -0.2517 |
| 6 | 117.6 | 122.9 | -5.31 |
| 7 | 121.1 | 123 | -1.946 |
| 8 | 136 | 135.4 | 0.5746 |
| 9 | 154.2 | 149.8 | 4.396 |
| 10 | 153.6 | 152.1 | 1.543 |
| 11 | 158.5 | 153.9 | 4.595 |
| 12 | 140.6 | 145.6 | -4.957 |
| 13 | 136.2 | 145.1 | -8.898 |
| 14 | 168 | 161.6 | 6.416 |
| 15 | 154.3 | 156.9 | -2.561 |
| 16 | 149 | 156.3 | -7.289 |
| 17 | 165.5 | 156.1 | 9.365 |
| Ramsey RESET F-Test for powers (2 and 3) of fitted values |
> reset_test_fitted RESET test data: mylm RESET = 5.4877, df1 = 2, df2 = 12, p-value = 0.0203 |
| Ramsey RESET F-Test for powers (2 and 3) of regressors |
> reset_test_regressors RESET test data: mylm RESET = 1.3404, df1 = 4, df2 = 10, p-value = 0.3209 |
| Ramsey RESET F-Test for powers (2 and 3) of principal components |
> reset_test_principal_components RESET test data: mylm RESET = 2.7033, df1 = 2, df2 = 12, p-value = 0.1073 |
| Variance Inflation Factors (Multicollinearity) |
> vif
       b        c
1.033043 1.033043
|