| Multiple Linear Regression - Estimated Regression Equation |
| Score[t] = -203.023 -4.84548X1[t] -0.778432X2[t] + 0.0195601X3[t] -2.27179X4[t] + 123.504X5[t] -17.6282X6[t] + 0.0783367Inter[t] -0.0265139t + e[t] |
| Multiple Linear Regression - Ordinary Least Squares | |||||
| Variable | Parameter | S.D. | T-STAT H0: parameter = 0 | 2-tail p-value | 1-tail p-value |
| (Intercept) | -203 | 55.54 | -3.6550e+00 | 0.003786 | 0.001893 |
| X1 | -4.846 | 2.564 | -1.8900e+00 | 0.0854 | 0.0427 |
| X2 | -0.7784 | 2.245 | -3.4670e-01 | 0.7354 | 0.3677 |
| X3 | +0.01956 | 2.131 | +9.1790e-03 | 0.9928 | 0.4964 |
| X4 | -2.272 | 2.587 | -8.7800e-01 | 0.3987 | 0.1994 |
| X5 | +123.5 | 33.06 | +3.7350e+00 | 0.003294 | 0.001647 |
| X6 | -17.63 | 4.856 | -3.6300e+00 | 0.003957 | 0.001979 |
| Inter | +0.07834 | 0.5628 | +1.3920e-01 | 0.8918 | 0.4459 |
| t | -0.02651 | 0.191 | -1.3880e-01 | 0.8921 | 0.4461 |
| Multiple Linear Regression - Regression Statistics | |
| Multiple R | 0.7983 |
| R-squared | 0.6373 |
| Adjusted R-squared | 0.3736 |
| F-TEST (value) | 2.416 |
| F-TEST (DF numerator) | 8 |
| F-TEST (DF denominator) | 11 |
| p-value | 0.08818 |
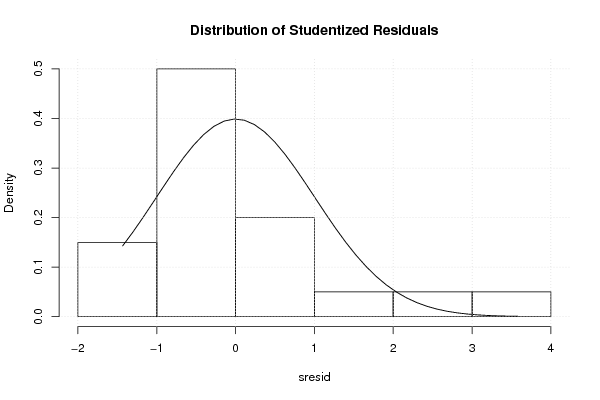
| Multiple Linear Regression - Residual Statistics | |
| Residual Standard Deviation | 3.972 |
| Sum Squared Residuals | 173.6 |
| Menu of Residual Diagnostics | |
| Description | Link |
| Histogram | Compute |
| Central Tendency | Compute |
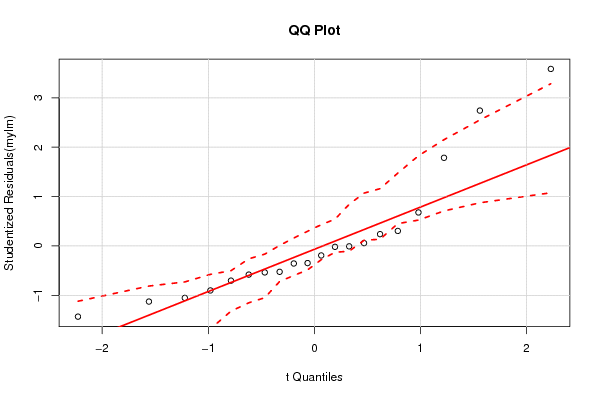
| QQ Plot | Compute |
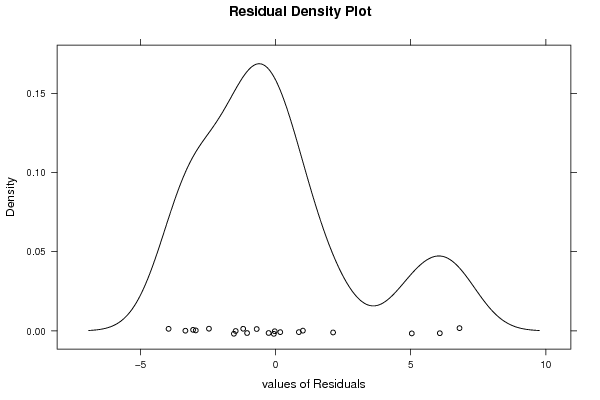
| Kernel Density Plot | Compute |
| Skewness/Kurtosis Test | Compute |
| Skewness-Kurtosis Plot | Compute |
| Harrell-Davis Plot | Compute |
| Bootstrap Plot -- Central Tendency | Compute |
| Blocked Bootstrap Plot -- Central Tendency | Compute |
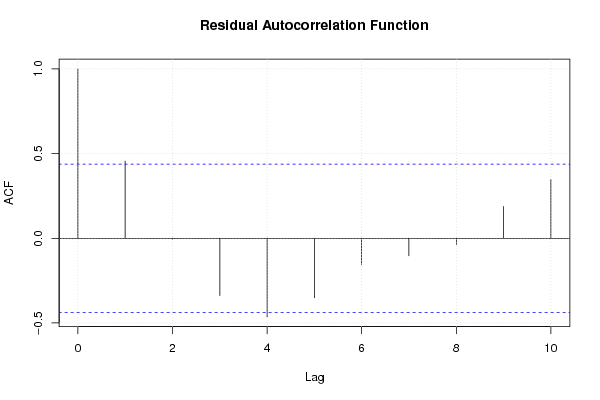
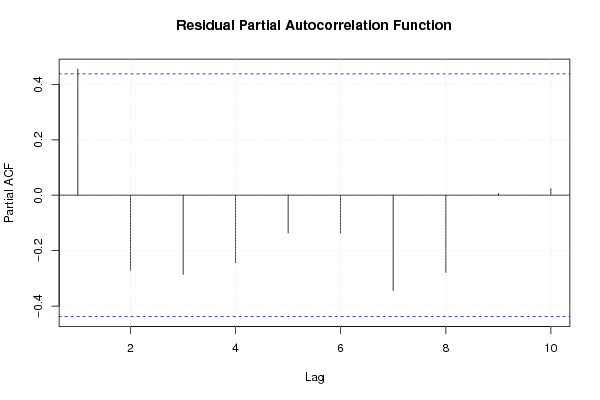
| (Partial) Autocorrelation Plot | Compute |
| Spectral Analysis | Compute |
| Tukey lambda PPCC Plot | Compute |
| Box-Cox Normality Plot | Compute |
| Summary Statistics | Compute |
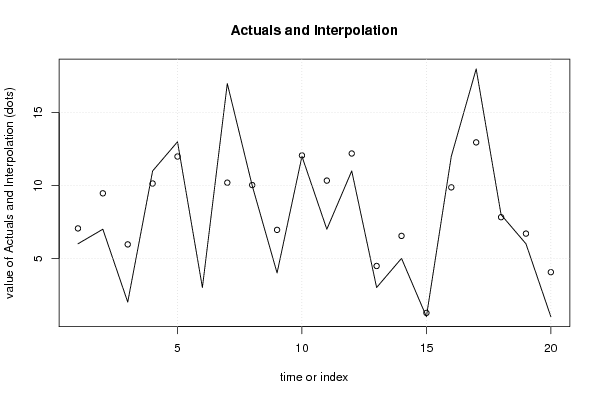
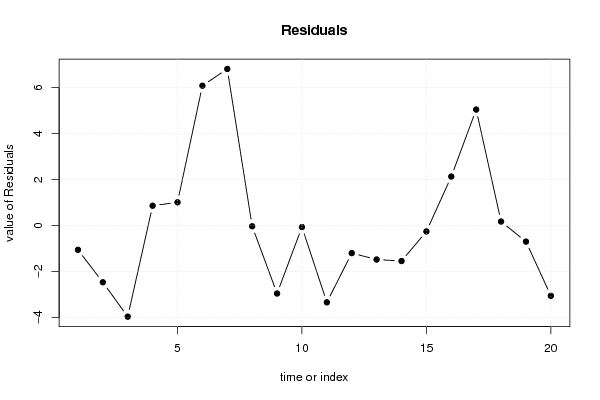
| Multiple Linear Regression - Actuals, Interpolation, and Residuals | |||
| Time or Index | Actuals | Interpolation Forecast | Residuals Prediction Error |
| 1 | 6 | 7.055 | -1.055 |
| 2 | 7 | 9.465 | -2.465 |
| 3 | 2 | 5.959 | -3.959 |
| 4 | 11 | 10.14 | 0.8615 |
| 5 | 13 | 11.99 | 1.01 |
| 6 | 3 | -3.077 | 6.077 |
| 7 | 17 | 10.19 | 6.805 |
| 8 | 10 | 10.03 | -0.03242 |
| 9 | 4 | 6.954 | -2.954 |
| 10 | 12 | 12.06 | -0.06429 |
| 11 | 7 | 10.34 | -3.337 |
| 12 | 11 | 12.2 | -1.198 |
| 13 | 3 | 4.477 | -1.477 |
| 14 | 5 | 6.543 | -1.543 |
| 15 | 1 | 1.258 | -0.2583 |
| 16 | 12 | 9.872 | 2.128 |
| 17 | 18 | 12.96 | 5.04 |
| 18 | 8 | 7.826 | 0.1741 |
| 19 | 6 | 6.699 | -0.6992 |
| 20 | 1 | 4.052 | -3.052 |
| Ramsey RESET F-Test for powers (2 and 3) of fitted values |
> reset_test_fitted RESET test data: mylm RESET = 7.0734, df1 = 2, df2 = 9, p-value = 0.01425 |
| Ramsey RESET F-Test for powers (2 and 3) of regressors |
> reset_test_regressors RESET test data: mylm RESET = -2.602, df1 = 16, df2 = -5, p-value = NA |
| Ramsey RESET F-Test for powers (2 and 3) of principal components |
> reset_test_principal_components RESET test data: mylm RESET = 0.37823, df1 = 2, df2 = 9, p-value = 0.6955 |
| Variance Inflation Factors (Multicollinearity) |
> vif
        X1         X2         X3         X4         X5         X6      Inter
  1.749852   1.597583   1.079157   1.930779 200.395442 201.747806   1.263816
         t
  1.537756
|