| Tabulation of Results | ||
| Score x Treatment | ||
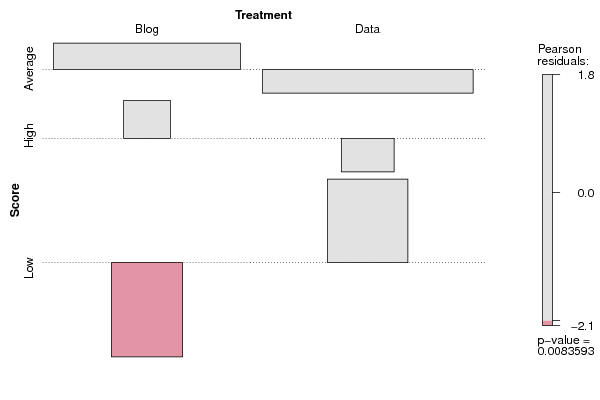
| Blog | Data | Average | 46 | 50 | High | 4 | 2 | Low | 1 | 13 |
| Tabulation of Expected Results | ||
| Score x Treatment | ||
| Blog | Data | Average | 42.21 | 53.79 | High | 2.64 | 3.36 | Low | 6.16 | 7.84 |
| Statistical Results | |
| Pearson's Chi-squared test with simulated p-value (based on 2000 replicates) | |
| Exact Pearson Chi Square Statistic | 9.57 |
| P value | 0.01 |