| Tabulation of Results | ||
| spssC x groupC | ||
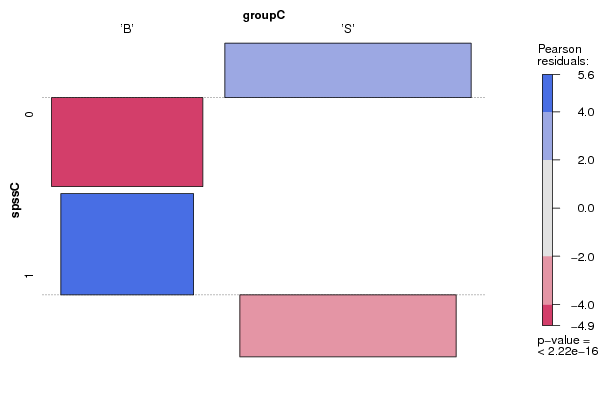
| 'B' | 'S' | 0 | 2 | 99 | 1 | 47 | 31 |
| Tabulation of Expected Results | ||
| spssC x groupC | ||
| 'B' | 'S' | 0 | 27.65 | 73.35 | 1 | 21.35 | 56.65 |
| Statistical Results | |
| Pearson's Chi-squared test with simulated p-value (based on 2000 replicates) | |
| Exact Pearson Chi Square Statistic | 75.18 |
| P value | 0 |