| Multiple Linear Regression - Estimated Regression Equation |
| EPS[t] = -1.51285 + 0.00055424Volume[t] + 0.116359HoogstevixperQ[t] -0.242243AvVixQ[t] + e[t] |
| Multiple Linear Regression - Ordinary Least Squares | |||||
| Variable | Parameter | S.D. | T-STAT H0: parameter = 0 | 2-tail p-value | 1-tail p-value |
| (Intercept) | -1.513 | 0.7352 | -2.0580e+00 | 0.08534 | 0.04267 |
| Volume | +0.0005542 | 0.0001983 | +2.7950e+00 | 0.03137 | 0.01569 |
| HoogstevixperQ | +0.1164 | 0.02559 | +4.5480e+00 | 0.0039 | 0.00195 |
| AvVixQ | -0.2422 | 0.07774 | -3.1160e+00 | 0.02068 | 0.01034 |
| Multiple Linear Regression - Regression Statistics | |
| Multiple R | 0.9727 |
| R-squared | 0.9461 |
| Adjusted R-squared | 0.9191 |
| F-TEST (value) | 35.09 |
| F-TEST (DF numerator) | 3 |
| F-TEST (DF denominator) | 6 |
| p-value | 0.0003359 |
| Multiple Linear Regression - Residual Statistics | |
| Residual Standard Deviation | 0.1889 |
| Sum Squared Residuals | 0.2142 |
| Menu of Residual Diagnostics | |
| Description | Link |
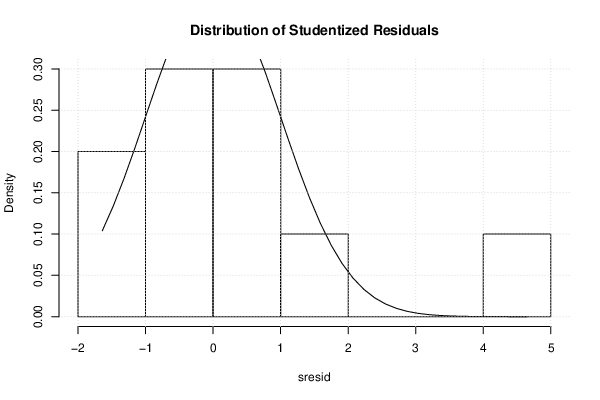
| Histogram | Compute |
| Central Tendency | Compute |
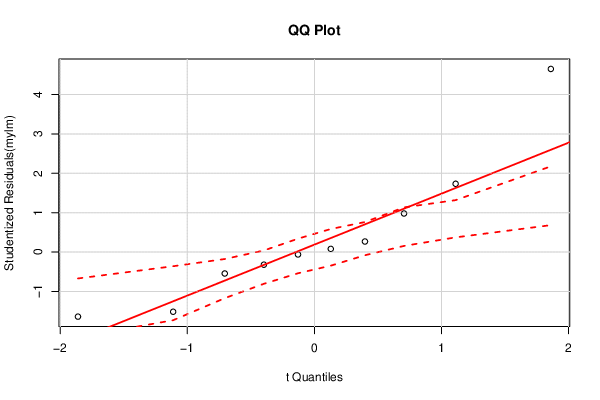
| QQ Plot | Compute |
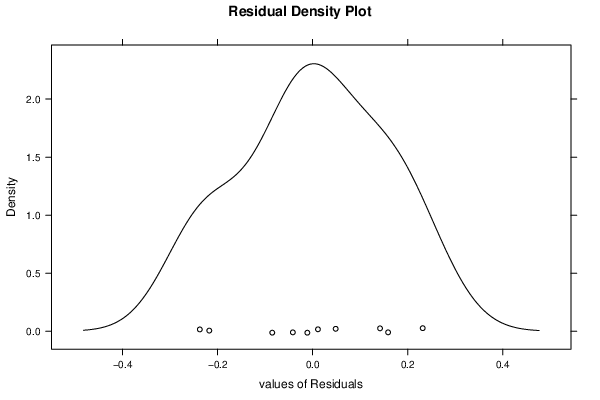
| Kernel Density Plot | Compute |
| Skewness/Kurtosis Test | Compute |
| Skewness-Kurtosis Plot | Compute |
| Harrell-Davis Plot | Compute |
| Bootstrap Plot -- Central Tendency | Compute |
| Blocked Bootstrap Plot -- Central Tendency | Compute |
| (Partial) Autocorrelation Plot | Compute |
| Spectral Analysis | Compute |
| Tukey lambda PPCC Plot | Compute |
| Box-Cox Normality Plot | Compute |
| Summary Statistics | Compute |
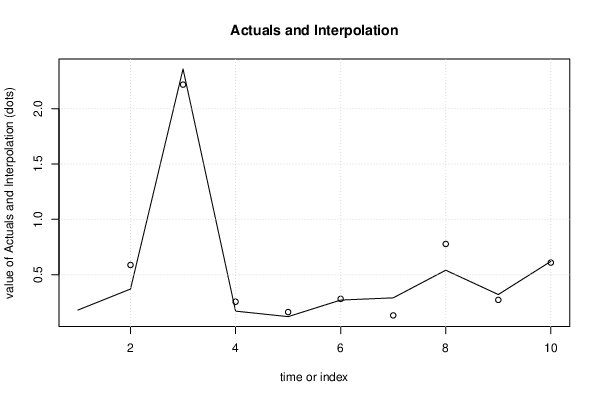
| Multiple Linear Regression - Actuals, Interpolation, and Residuals | |||
| Time or Index | Actuals | Interpolation Forecast | Residuals Prediction Error |
| 1 | 0.18 | -0.05167 | 0.2317 |
| 2 | 0.37 | 0.5874 | -0.2174 |
| 3 | 2.36 | 2.218 | 0.1419 |
| 4 | 0.17 | 0.2549 | -0.0849 |
| 5 | 0.12 | 0.1616 | -0.04156 |
| 6 | 0.27 | 0.2811 | -0.01108 |
| 7 | 0.29 | 0.1312 | 0.1588 |
| 8 | 0.54 | 0.7773 | -0.2373 |
| 9 | 0.32 | 0.2714 | 0.04856 |
| 10 | 0.62 | 0.6087 | 0.01129 |
| Ramsey RESET F-Test for powers (2 and 3) of fitted values |
> reset_test_fitted RESET test data: mylm RESET = 8.9084, df1 = 2, df2 = 4, p-value = 0.03362 |
| Ramsey RESET F-Test for powers (2 and 3) of regressors |
> reset_test_regressors RESET test data: mylm RESET = NaN, df1 = 6, df2 = 0, p-value = NA |
| Ramsey RESET F-Test for powers (2 and 3) of principal components |
> reset_test_principal_components RESET test data: mylm RESET = 12.422, df1 = 2, df2 = 4, p-value = 0.01923 |
| Variance Inflation Factors (Multicollinearity) |
> vif
        Volume HoogstevixperQ         AvVixQ
      4.222898       8.172385       8.267912
|