| Tabulation of Results | ||
| Weeks x Used | ||
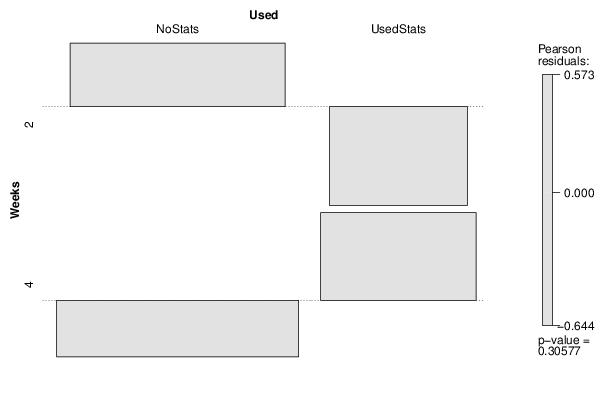
| NoStats | UsedStats | 2 | 51 | 17 | 4 | 58 | 28 |
| Tabulation of Expected Results | ||
| Weeks x Used | ||
| NoStats | UsedStats | 2 | 48.13 | 19.87 | 4 | 60.87 | 25.13 |
| Statistical Results | |
| Pearson's Chi-squared test with Yates' continuity correction | |
| Pearson Chi Square Statistic | 0.72 |
| Degrees of Freedom | 1 |
| P value | 0.4 |