| Tabulation of Results | ||
| Uitvoer x Invoer | ||
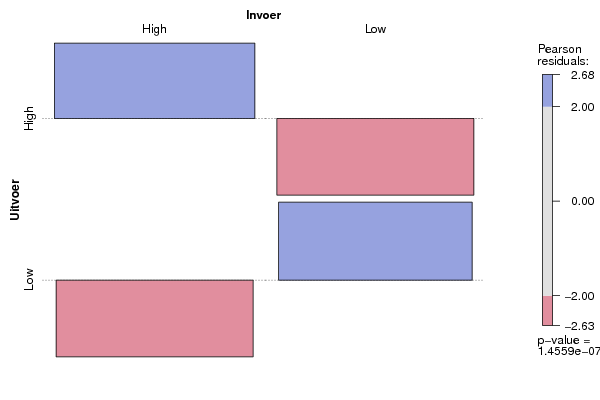
| High | Low | High | 24 | 4 | Low | 4 | 23 |
| Tabulation of Expected Results | ||
| Uitvoer x Invoer | ||
| High | Low | High | 14.25 | 13.75 | Low | 13.75 | 13.25 |
| Statistical Results | |
| Pearson's Chi-squared test with simulated p-value (based on 2000 replicates) | |
| Chi Square Statistic | 27.65 |
| P value | 0 |