Free Statistics

of Irreproducible Research!

Author's title

Author*The author of this computation has been verified*
R Software Modulerwasp_arimabackwardselection.wasp
Title produced by softwareARIMA Backward Selection
Date of computationFri, 23 Dec 2016 14:28:25 +0100
Cite this page as followsStatistical Computations at FreeStatistics.org, Office for Research Development and Education, URL https://freestatistics.org/blog/index.php?v=date/2016/Dec/23/t1482499734tf1h4dw4cm2ryqa.htm/, Retrieved Fri, 01 Nov 2024 03:27:23 +0000
Statistical Computations at FreeStatistics.org, Office for Research Development and Education, URL https://freestatistics.org/blog/index.php?pk=302938, Retrieved Fri, 01 Nov 2024 03:27:23 +0000
QR Codes:

Original text written by user:
IsPrivate?No (this computation is public)
User-defined keywords
Estimated Impact87
Family? (F = Feedback message, R = changed R code, M = changed R Module, P = changed Parameters, D = changed Data)
-       [ARIMA Backward Selection] [] [2016-12-23 13:28:25] [863feeaf19a0ddfce7bd9c25059c4d8a] [Current]
Feedback Forum

Post a new message
Dataseries X:
4790.92
4795.33
4822.62
4797.52
4822.17
4843.08
4850.79
4827.02
4796.65
4854.96
4870.81
4891.06
4881.38
4921.43
4956.21
4962.81
4949.38
4977.99
4992.73
5009.02
4990.98
5014.96
5022.23
5028.83
4894.36
4918.13
4936.4
4899.87
4862.89
4882.69
4895.46
4883.8
4855.4
4874.33
4880.94
4861.79
4851.44
4840.22
4842.42
4827.02
4749.77
4866.63
4734.37
4726.44
4753.51
4867.29
4793.35
4822.4
4865.09
4987.67
4900.96
4904.71
4889.52
5015.63
4938.81
4924.73
4871.48
4998.24
4891.06
4876.54
4824.15


Summary of computational transaction
Raw Input view raw input (R code)
Raw Outputview raw output of R engine
Computing time4 seconds
R ServerBig Analytics Cloud Computing Center

\begin{tabular}{lllllllll}
\hline
Summary of computational transaction \tabularnewline
Raw Input view raw input (R code)  \tabularnewline
Raw Outputview raw output of R engine  \tabularnewline
Computing time4 seconds \tabularnewline
R ServerBig Analytics Cloud Computing Center \tabularnewline
\hline
\end{tabular}
%Source: https://freestatistics.org/blog/index.php?pk=302938&T=0

[TABLE]
[ROW]
Summary of computational transaction[/C][/ROW] [ROW]Raw Input[/C] view raw input (R code) [/C][/ROW] [ROW]Raw Output[/C]view raw output of R engine [/C][/ROW] [ROW]Computing time[/C]4 seconds[/C][/ROW] [ROW]R Server[/C]Big Analytics Cloud Computing Center[/C][/ROW] [/TABLE] Source: https://freestatistics.org/blog/index.php?pk=302938&T=0

Globally Unique Identifier (entire table): ba.freestatistics.org/blog/index.php?pk=302938&T=0

As an alternative you can also use a QR Code:  

The GUIDs for individual cells are displayed in the table below:

Summary of computational transaction
Raw Input view raw input (R code)
Raw Outputview raw output of R engine
Computing time4 seconds
R ServerBig Analytics Cloud Computing Center


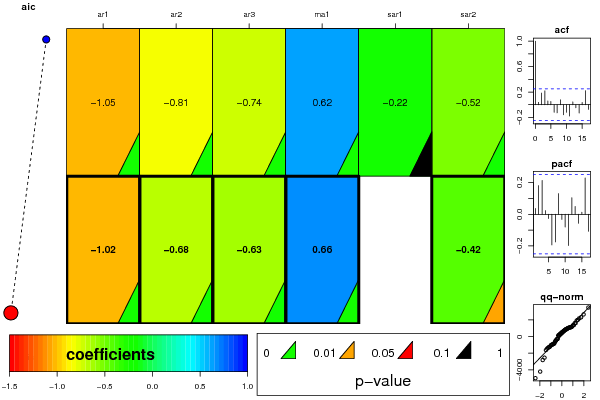
ARIMA Parameter Estimation and Backward Selection
Iterationar1ar2ar3ma1sar1sar2
Estimates ( 1 )-1.0492-0.8145-0.74460.6186-0.2196-0.5184
(p-val)(0 )(0 )(0 )(0 )(0.1478 )(0.003 )
Estimates ( 2 )-1.0231-0.6826-0.63240.6560-0.4173
(p-val)(0 )(1e-04 )(0 )(0 )(NA )(0.0247 )
Estimates ( 3 )NANANANANANA
(p-val)(NA )(NA )(NA )(NA )(NA )(NA )
Estimates ( 4 )NANANANANANA
(p-val)(NA )(NA )(NA )(NA )(NA )(NA )
Estimates ( 5 )NANANANANANA
(p-val)(NA )(NA )(NA )(NA )(NA )(NA )
Estimates ( 6 )NANANANANANA
(p-val)(NA )(NA )(NA )(NA )(NA )(NA )
Estimates ( 7 )NANANANANANA
(p-val)(NA )(NA )(NA )(NA )(NA )(NA )
Estimates ( 8 )NANANANANANA
(p-val)(NA )(NA )(NA )(NA )(NA )(NA )
Estimates ( 9 )NANANANANANA
(p-val)(NA )(NA )(NA )(NA )(NA )(NA )
Estimates ( 10 )NANANANANANA
(p-val)(NA )(NA )(NA )(NA )(NA )(NA )
Estimates ( 11 )NANANANANANA
(p-val)(NA )(NA )(NA )(NA )(NA )(NA )

\begin{tabular}{lllllllll}
\hline
ARIMA Parameter Estimation and Backward Selection \tabularnewline
Iteration & ar1 & ar2 & ar3 & ma1 & sar1 & sar2 \tabularnewline
Estimates ( 1 ) & -1.0492 & -0.8145 & -0.7446 & 0.6186 & -0.2196 & -0.5184 \tabularnewline
(p-val) & (0 ) & (0 ) & (0 ) & (0 ) & (0.1478 ) & (0.003 ) \tabularnewline
Estimates ( 2 ) & -1.0231 & -0.6826 & -0.6324 & 0.656 & 0 & -0.4173 \tabularnewline
(p-val) & (0 ) & (1e-04 ) & (0 ) & (0 ) & (NA ) & (0.0247 ) \tabularnewline
Estimates ( 3 ) & NA & NA & NA & NA & NA & NA \tabularnewline
(p-val) & (NA ) & (NA ) & (NA ) & (NA ) & (NA ) & (NA ) \tabularnewline
Estimates ( 4 ) & NA & NA & NA & NA & NA & NA \tabularnewline
(p-val) & (NA ) & (NA ) & (NA ) & (NA ) & (NA ) & (NA ) \tabularnewline
Estimates ( 5 ) & NA & NA & NA & NA & NA & NA \tabularnewline
(p-val) & (NA ) & (NA ) & (NA ) & (NA ) & (NA ) & (NA ) \tabularnewline
Estimates ( 6 ) & NA & NA & NA & NA & NA & NA \tabularnewline
(p-val) & (NA ) & (NA ) & (NA ) & (NA ) & (NA ) & (NA ) \tabularnewline
Estimates ( 7 ) & NA & NA & NA & NA & NA & NA \tabularnewline
(p-val) & (NA ) & (NA ) & (NA ) & (NA ) & (NA ) & (NA ) \tabularnewline
Estimates ( 8 ) & NA & NA & NA & NA & NA & NA \tabularnewline
(p-val) & (NA ) & (NA ) & (NA ) & (NA ) & (NA ) & (NA ) \tabularnewline
Estimates ( 9 ) & NA & NA & NA & NA & NA & NA \tabularnewline
(p-val) & (NA ) & (NA ) & (NA ) & (NA ) & (NA ) & (NA ) \tabularnewline
Estimates ( 10 ) & NA & NA & NA & NA & NA & NA \tabularnewline
(p-val) & (NA ) & (NA ) & (NA ) & (NA ) & (NA ) & (NA ) \tabularnewline
Estimates ( 11 ) & NA & NA & NA & NA & NA & NA \tabularnewline
(p-val) & (NA ) & (NA ) & (NA ) & (NA ) & (NA ) & (NA ) \tabularnewline
\hline
\end{tabular}
%Source: https://freestatistics.org/blog/index.php?pk=302938&T=1

[TABLE]
[ROW][C]ARIMA Parameter Estimation and Backward Selection[/C][/ROW]
[ROW][C]Iteration[/C][C]ar1[/C][C]ar2[/C][C]ar3[/C][C]ma1[/C][C]sar1[/C][C]sar2[/C][/ROW]
[ROW][C]Estimates ( 1 )[/C][C]-1.0492[/C][C]-0.8145[/C][C]-0.7446[/C][C]0.6186[/C][C]-0.2196[/C][C]-0.5184[/C][/ROW]
[ROW][C](p-val)[/C][C](0 )[/C][C](0 )[/C][C](0 )[/C][C](0 )[/C][C](0.1478 )[/C][C](0.003 )[/C][/ROW]
[ROW][C]Estimates ( 2 )[/C][C]-1.0231[/C][C]-0.6826[/C][C]-0.6324[/C][C]0.656[/C][C]0[/C][C]-0.4173[/C][/ROW]
[ROW][C](p-val)[/C][C](0 )[/C][C](1e-04 )[/C][C](0 )[/C][C](0 )[/C][C](NA )[/C][C](0.0247 )[/C][/ROW]
[ROW][C]Estimates ( 3 )[/C][C]NA[/C][C]NA[/C][C]NA[/C][C]NA[/C][C]NA[/C][C]NA[/C][/ROW]
[ROW][C](p-val)[/C][C](NA )[/C][C](NA )[/C][C](NA )[/C][C](NA )[/C][C](NA )[/C][C](NA )[/C][/ROW]
[ROW][C]Estimates ( 4 )[/C][C]NA[/C][C]NA[/C][C]NA[/C][C]NA[/C][C]NA[/C][C]NA[/C][/ROW]
[ROW][C](p-val)[/C][C](NA )[/C][C](NA )[/C][C](NA )[/C][C](NA )[/C][C](NA )[/C][C](NA )[/C][/ROW]
[ROW][C]Estimates ( 5 )[/C][C]NA[/C][C]NA[/C][C]NA[/C][C]NA[/C][C]NA[/C][C]NA[/C][/ROW]
[ROW][C](p-val)[/C][C](NA )[/C][C](NA )[/C][C](NA )[/C][C](NA )[/C][C](NA )[/C][C](NA )[/C][/ROW]
[ROW][C]Estimates ( 6 )[/C][C]NA[/C][C]NA[/C][C]NA[/C][C]NA[/C][C]NA[/C][C]NA[/C][/ROW]
[ROW][C](p-val)[/C][C](NA )[/C][C](NA )[/C][C](NA )[/C][C](NA )[/C][C](NA )[/C][C](NA )[/C][/ROW]
[ROW][C]Estimates ( 7 )[/C][C]NA[/C][C]NA[/C][C]NA[/C][C]NA[/C][C]NA[/C][C]NA[/C][/ROW]
[ROW][C](p-val)[/C][C](NA )[/C][C](NA )[/C][C](NA )[/C][C](NA )[/C][C](NA )[/C][C](NA )[/C][/ROW]
[ROW][C]Estimates ( 8 )[/C][C]NA[/C][C]NA[/C][C]NA[/C][C]NA[/C][C]NA[/C][C]NA[/C][/ROW]
[ROW][C](p-val)[/C][C](NA )[/C][C](NA )[/C][C](NA )[/C][C](NA )[/C][C](NA )[/C][C](NA )[/C][/ROW]
[ROW][C]Estimates ( 9 )[/C][C]NA[/C][C]NA[/C][C]NA[/C][C]NA[/C][C]NA[/C][C]NA[/C][/ROW]
[ROW][C](p-val)[/C][C](NA )[/C][C](NA )[/C][C](NA )[/C][C](NA )[/C][C](NA )[/C][C](NA )[/C][/ROW]
[ROW][C]Estimates ( 10 )[/C][C]NA[/C][C]NA[/C][C]NA[/C][C]NA[/C][C]NA[/C][C]NA[/C][/ROW]
[ROW][C](p-val)[/C][C](NA )[/C][C](NA )[/C][C](NA )[/C][C](NA )[/C][C](NA )[/C][C](NA )[/C][/ROW]
[ROW][C]Estimates ( 11 )[/C][C]NA[/C][C]NA[/C][C]NA[/C][C]NA[/C][C]NA[/C][C]NA[/C][/ROW]
[ROW][C](p-val)[/C][C](NA )[/C][C](NA )[/C][C](NA )[/C][C](NA )[/C][C](NA )[/C][C](NA )[/C][/ROW]
[/TABLE]
Source: https://freestatistics.org/blog/index.php?pk=302938&T=1

Globally Unique Identifier (entire table): ba.freestatistics.org/blog/index.php?pk=302938&T=1

As an alternative you can also use a QR Code:  

The GUIDs for individual cells are displayed in the table below:

ARIMA Parameter Estimation and Backward Selection
Iterationar1ar2ar3ma1sar1sar2
Estimates ( 1 )-1.0492-0.8145-0.74460.6186-0.2196-0.5184
(p-val)(0 )(0 )(0 )(0 )(0.1478 )(0.003 )
Estimates ( 2 )-1.0231-0.6826-0.63240.6560-0.4173
(p-val)(0 )(1e-04 )(0 )(0 )(NA )(0.0247 )
Estimates ( 3 )NANANANANANA
(p-val)(NA )(NA )(NA )(NA )(NA )(NA )
Estimates ( 4 )NANANANANANA
(p-val)(NA )(NA )(NA )(NA )(NA )(NA )
Estimates ( 5 )NANANANANANA
(p-val)(NA )(NA )(NA )(NA )(NA )(NA )
Estimates ( 6 )NANANANANANA
(p-val)(NA )(NA )(NA )(NA )(NA )(NA )
Estimates ( 7 )NANANANANANA
(p-val)(NA )(NA )(NA )(NA )(NA )(NA )
Estimates ( 8 )NANANANANANA
(p-val)(NA )(NA )(NA )(NA )(NA )(NA )
Estimates ( 9 )NANANANANANA
(p-val)(NA )(NA )(NA )(NA )(NA )(NA )
Estimates ( 10 )NANANANANANA
(p-val)(NA )(NA )(NA )(NA )(NA )(NA )
Estimates ( 11 )NANANANANANA
(p-val)(NA )(NA )(NA )(NA )(NA )(NA )


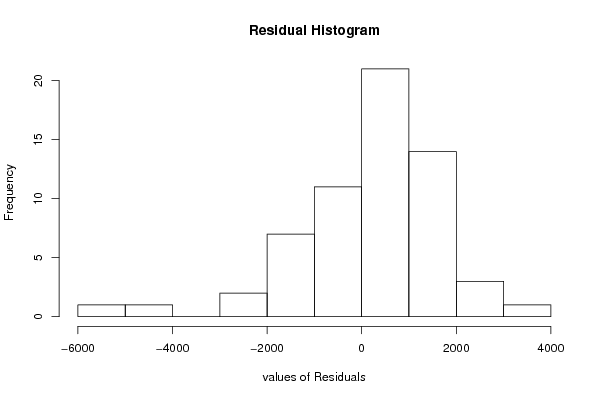
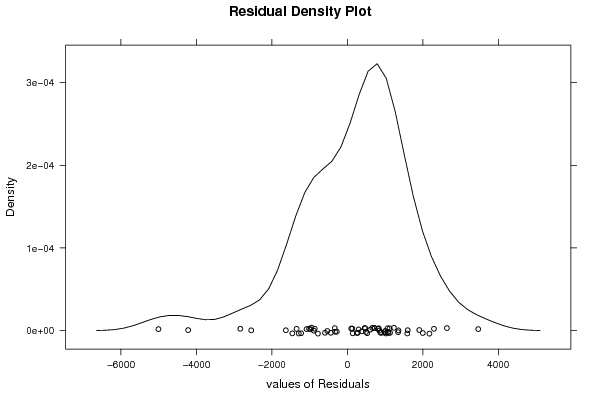
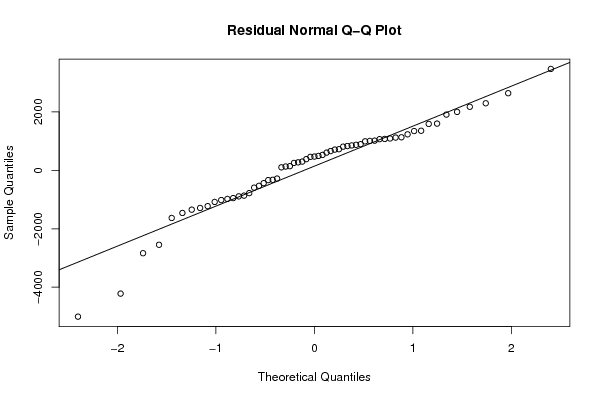
Estimated ARIMA Residuals
Value
142.097293154479
103.472696304233
723.688337602448
-281.051673918334
894.558505517239
1074.73399707307
493.314966554373
382.552138916346
-1458.41680245295
1344.53381462523
471.764794044075
1906.9476470835
1122.0223702031
1354.76537096749
2295.34988256159
1067.0386905608
1233.13236596246
1089.848722157
1006.6302943203
1131.52663721792
130.704312269691
1015.49055847085
874.193211802565
527.573953688391
-4219.09499744998
-1015.94722042642
-334.267924299224
-2547.43863217088
659.982813759397
-438.130760692127
298.412974036812
253.154027835459
-1225.42682469781
852.57644002545
273.894723553182
606.425134344818
-323.90499515532
-889.935266171626
460.587121476947
-949.504783904923
-2836.39463769769
3470.02239434043
-5007.28815916354
-529.97019280763
809.441733416454
1588.17760617227
2175.18093246512
1599.63404295512
709.689026576608
2639.45122851877
831.65437981568
-1081.14819571292
-779.728241100198
1999.25149152098
-592.910116411647
-977.847213485481
-1287.43102128105
993.009506803542
-1346.14382508111
-1630.0286464362
-865.971312524197

\begin{tabular}{lllllllll}
\hline
Estimated ARIMA Residuals \tabularnewline
Value \tabularnewline
142.097293154479 \tabularnewline
103.472696304233 \tabularnewline
723.688337602448 \tabularnewline
-281.051673918334 \tabularnewline
894.558505517239 \tabularnewline
1074.73399707307 \tabularnewline
493.314966554373 \tabularnewline
382.552138916346 \tabularnewline
-1458.41680245295 \tabularnewline
1344.53381462523 \tabularnewline
471.764794044075 \tabularnewline
1906.9476470835 \tabularnewline
1122.0223702031 \tabularnewline
1354.76537096749 \tabularnewline
2295.34988256159 \tabularnewline
1067.0386905608 \tabularnewline
1233.13236596246 \tabularnewline
1089.848722157 \tabularnewline
1006.6302943203 \tabularnewline
1131.52663721792 \tabularnewline
130.704312269691 \tabularnewline
1015.49055847085 \tabularnewline
874.193211802565 \tabularnewline
527.573953688391 \tabularnewline
-4219.09499744998 \tabularnewline
-1015.94722042642 \tabularnewline
-334.267924299224 \tabularnewline
-2547.43863217088 \tabularnewline
659.982813759397 \tabularnewline
-438.130760692127 \tabularnewline
298.412974036812 \tabularnewline
253.154027835459 \tabularnewline
-1225.42682469781 \tabularnewline
852.57644002545 \tabularnewline
273.894723553182 \tabularnewline
606.425134344818 \tabularnewline
-323.90499515532 \tabularnewline
-889.935266171626 \tabularnewline
460.587121476947 \tabularnewline
-949.504783904923 \tabularnewline
-2836.39463769769 \tabularnewline
3470.02239434043 \tabularnewline
-5007.28815916354 \tabularnewline
-529.97019280763 \tabularnewline
809.441733416454 \tabularnewline
1588.17760617227 \tabularnewline
2175.18093246512 \tabularnewline
1599.63404295512 \tabularnewline
709.689026576608 \tabularnewline
2639.45122851877 \tabularnewline
831.65437981568 \tabularnewline
-1081.14819571292 \tabularnewline
-779.728241100198 \tabularnewline
1999.25149152098 \tabularnewline
-592.910116411647 \tabularnewline
-977.847213485481 \tabularnewline
-1287.43102128105 \tabularnewline
993.009506803542 \tabularnewline
-1346.14382508111 \tabularnewline
-1630.0286464362 \tabularnewline
-865.971312524197 \tabularnewline
\hline
\end{tabular}
%Source: https://freestatistics.org/blog/index.php?pk=302938&T=2

[TABLE]
[ROW][C]Estimated ARIMA Residuals[/C][/ROW]
[ROW][C]Value[/C][/ROW]
[ROW][C]142.097293154479[/C][/ROW]
[ROW][C]103.472696304233[/C][/ROW]
[ROW][C]723.688337602448[/C][/ROW]
[ROW][C]-281.051673918334[/C][/ROW]
[ROW][C]894.558505517239[/C][/ROW]
[ROW][C]1074.73399707307[/C][/ROW]
[ROW][C]493.314966554373[/C][/ROW]
[ROW][C]382.552138916346[/C][/ROW]
[ROW][C]-1458.41680245295[/C][/ROW]
[ROW][C]1344.53381462523[/C][/ROW]
[ROW][C]471.764794044075[/C][/ROW]
[ROW][C]1906.9476470835[/C][/ROW]
[ROW][C]1122.0223702031[/C][/ROW]
[ROW][C]1354.76537096749[/C][/ROW]
[ROW][C]2295.34988256159[/C][/ROW]
[ROW][C]1067.0386905608[/C][/ROW]
[ROW][C]1233.13236596246[/C][/ROW]
[ROW][C]1089.848722157[/C][/ROW]
[ROW][C]1006.6302943203[/C][/ROW]
[ROW][C]1131.52663721792[/C][/ROW]
[ROW][C]130.704312269691[/C][/ROW]
[ROW][C]1015.49055847085[/C][/ROW]
[ROW][C]874.193211802565[/C][/ROW]
[ROW][C]527.573953688391[/C][/ROW]
[ROW][C]-4219.09499744998[/C][/ROW]
[ROW][C]-1015.94722042642[/C][/ROW]
[ROW][C]-334.267924299224[/C][/ROW]
[ROW][C]-2547.43863217088[/C][/ROW]
[ROW][C]659.982813759397[/C][/ROW]
[ROW][C]-438.130760692127[/C][/ROW]
[ROW][C]298.412974036812[/C][/ROW]
[ROW][C]253.154027835459[/C][/ROW]
[ROW][C]-1225.42682469781[/C][/ROW]
[ROW][C]852.57644002545[/C][/ROW]
[ROW][C]273.894723553182[/C][/ROW]
[ROW][C]606.425134344818[/C][/ROW]
[ROW][C]-323.90499515532[/C][/ROW]
[ROW][C]-889.935266171626[/C][/ROW]
[ROW][C]460.587121476947[/C][/ROW]
[ROW][C]-949.504783904923[/C][/ROW]
[ROW][C]-2836.39463769769[/C][/ROW]
[ROW][C]3470.02239434043[/C][/ROW]
[ROW][C]-5007.28815916354[/C][/ROW]
[ROW][C]-529.97019280763[/C][/ROW]
[ROW][C]809.441733416454[/C][/ROW]
[ROW][C]1588.17760617227[/C][/ROW]
[ROW][C]2175.18093246512[/C][/ROW]
[ROW][C]1599.63404295512[/C][/ROW]
[ROW][C]709.689026576608[/C][/ROW]
[ROW][C]2639.45122851877[/C][/ROW]
[ROW][C]831.65437981568[/C][/ROW]
[ROW][C]-1081.14819571292[/C][/ROW]
[ROW][C]-779.728241100198[/C][/ROW]
[ROW][C]1999.25149152098[/C][/ROW]
[ROW][C]-592.910116411647[/C][/ROW]
[ROW][C]-977.847213485481[/C][/ROW]
[ROW][C]-1287.43102128105[/C][/ROW]
[ROW][C]993.009506803542[/C][/ROW]
[ROW][C]-1346.14382508111[/C][/ROW]
[ROW][C]-1630.0286464362[/C][/ROW]
[ROW][C]-865.971312524197[/C][/ROW]
[/TABLE]
Source: https://freestatistics.org/blog/index.php?pk=302938&T=2

Globally Unique Identifier (entire table): ba.freestatistics.org/blog/index.php?pk=302938&T=2

As an alternative you can also use a QR Code:  

The GUIDs for individual cells are displayed in the table below:

Estimated ARIMA Residuals
Value
142.097293154479
103.472696304233
723.688337602448
-281.051673918334
894.558505517239
1074.73399707307
493.314966554373
382.552138916346
-1458.41680245295
1344.53381462523
471.764794044075
1906.9476470835
1122.0223702031
1354.76537096749
2295.34988256159
1067.0386905608
1233.13236596246
1089.848722157
1006.6302943203
1131.52663721792
130.704312269691
1015.49055847085
874.193211802565
527.573953688391
-4219.09499744998
-1015.94722042642
-334.267924299224
-2547.43863217088
659.982813759397
-438.130760692127
298.412974036812
253.154027835459
-1225.42682469781
852.57644002545
273.894723553182
606.425134344818
-323.90499515532
-889.935266171626
460.587121476947
-949.504783904923
-2836.39463769769
3470.02239434043
-5007.28815916354
-529.97019280763
809.441733416454
1588.17760617227
2175.18093246512
1599.63404295512
709.689026576608
2639.45122851877
831.65437981568
-1081.14819571292
-779.728241100198
1999.25149152098
-592.910116411647
-977.847213485481
-1287.43102128105
993.009506803542
-1346.14382508111
-1630.0286464362
-865.971312524197


Parameters (Session):
par1 = FALSE ; par2 = 1.4 ; par3 = 1 ; par4 = 0 ; par5 = 12 ; par6 = 3 ; par7 = 1 ; par8 = 2 ; par9 = 0 ;
Parameters (R input):
par1 = FALSE ; par2 = 1.4 ; par3 = 1 ; par4 = 0 ; par5 = 12 ; par6 = 3 ; par7 = 1 ; par8 = 2 ; par9 = 0 ;
R code (references can be found in the software module):
library(lattice)
if (par1 == 'TRUE') par1 <- TRUE
if (par1 == 'FALSE') par1 <- FALSE
par2 <- as.numeric(par2) #Box-Cox lambda transformation parameter
par3 <- as.numeric(par3) #degree of non-seasonal differencing
par4 <- as.numeric(par4) #degree of seasonal differencing
par5 <- as.numeric(par5) #seasonal period
par6 <- as.numeric(par6) #degree (p) of the non-seasonal AR(p) polynomial
par7 <- as.numeric(par7) #degree (q) of the non-seasonal MA(q) polynomial
par8 <- as.numeric(par8) #degree (P) of the seasonal AR(P) polynomial
par9 <- as.numeric(par9) #degree (Q) of the seasonal MA(Q) polynomial
armaGR <- function(arima.out, names, n){
try1 <- arima.out$coef
try2 <- sqrt(diag(arima.out$var.coef))
try.data.frame <- data.frame(matrix(NA,ncol=4,nrow=length(names)))
dimnames(try.data.frame) <- list(names,c('coef','std','tstat','pv'))
try.data.frame[,1] <- try1
for(i in 1:length(try2)) try.data.frame[which(rownames(try.data.frame)==names(try2)[i]),2] <- try2[i]
try.data.frame[,3] <- try.data.frame[,1] / try.data.frame[,2]
try.data.frame[,4] <- round((1-pt(abs(try.data.frame[,3]),df=n-(length(try2)+1)))*2,5)
vector <- rep(NA,length(names))
vector[is.na(try.data.frame[,4])] <- 0
maxi <- which.max(try.data.frame[,4])
continue <- max(try.data.frame[,4],na.rm=TRUE) > .05
vector[maxi] <- 0
list(summary=try.data.frame,next.vector=vector,continue=continue)
}
arimaSelect <- function(series, order=c(13,0,0), seasonal=list(order=c(2,0,0),period=12), include.mean=F){
nrc <- order[1]+order[3]+seasonal$order[1]+seasonal$order[3]
coeff <- matrix(NA, nrow=nrc*2, ncol=nrc)
pval <- matrix(NA, nrow=nrc*2, ncol=nrc)
mylist <- rep(list(NULL), nrc)
names <- NULL
if(order[1] > 0) names <- paste('ar',1:order[1],sep='')
if(order[3] > 0) names <- c( names , paste('ma',1:order[3],sep='') )
if(seasonal$order[1] > 0) names <- c(names, paste('sar',1:seasonal$order[1],sep=''))
if(seasonal$order[3] > 0) names <- c(names, paste('sma',1:seasonal$order[3],sep=''))
arima.out <- arima(series, order=order, seasonal=seasonal, include.mean=include.mean, method='ML')
mylist[[1]] <- arima.out
last.arma <- armaGR(arima.out, names, length(series))
mystop <- FALSE
i <- 1
coeff[i,] <- last.arma[[1]][,1]
pval [i,] <- last.arma[[1]][,4]
i <- 2
aic <- arima.out$aic
while(!mystop){
mylist[[i]] <- arima.out
arima.out <- arima(series, order=order, seasonal=seasonal, include.mean=include.mean, method='ML', fixed=last.arma$next.vector)
aic <- c(aic, arima.out$aic)
last.arma <- armaGR(arima.out, names, length(series))
mystop <- !last.arma$continue
coeff[i,] <- last.arma[[1]][,1]
pval [i,] <- last.arma[[1]][,4]
i <- i+1
}
list(coeff, pval, mylist, aic=aic)
}
arimaSelectplot <- function(arimaSelect.out,noms,choix){
noms <- names(arimaSelect.out[[3]][[1]]$coef)
coeff <- arimaSelect.out[[1]]
k <- min(which(is.na(coeff[,1])))-1
coeff <- coeff[1:k,]
pval <- arimaSelect.out[[2]][1:k,]
aic <- arimaSelect.out$aic[1:k]
coeff[coeff==0] <- NA
n <- ncol(coeff)
if(missing(choix)) choix <- k
layout(matrix(c(1,1,1,2,
3,3,3,2,
3,3,3,4,
5,6,7,7),nr=4),
widths=c(10,35,45,15),
heights=c(30,30,15,15))
couleurs <- rainbow(75)[1:50]#(50)
ticks <- pretty(coeff)
par(mar=c(1,1,3,1))
plot(aic,k:1-.5,type='o',pch=21,bg='blue',cex=2,axes=F,lty=2,xpd=NA)
points(aic[choix],k-choix+.5,pch=21,cex=4,bg=2,xpd=NA)
title('aic',line=2)
par(mar=c(3,0,0,0))
plot(0,axes=F,xlab='',ylab='',xlim=range(ticks),ylim=c(.1,1))
rect(xleft = min(ticks) + (0:49)/50*(max(ticks)-min(ticks)),
xright = min(ticks) + (1:50)/50*(max(ticks)-min(ticks)),
ytop = rep(1,50),
ybottom= rep(0,50),col=couleurs,border=NA)
axis(1,ticks)
rect(xleft=min(ticks),xright=max(ticks),ytop=1,ybottom=0)
text(mean(coeff,na.rm=T),.5,'coefficients',cex=2,font=2)
par(mar=c(1,1,3,1))
image(1:n,1:k,t(coeff[k:1,]),axes=F,col=couleurs,zlim=range(ticks))
for(i in 1:n) for(j in 1:k) if(!is.na(coeff[j,i])) {
if(pval[j,i]<.01) symb = 'green'
else if( (pval[j,i]<.05) & (pval[j,i]>=.01)) symb = 'orange'
else if( (pval[j,i]<.1) & (pval[j,i]>=.05)) symb = 'red'
else symb = 'black'
polygon(c(i+.5 ,i+.2 ,i+.5 ,i+.5),
c(k-j+0.5,k-j+0.5,k-j+0.8,k-j+0.5),
col=symb)
if(j==choix) {
rect(xleft=i-.5,
xright=i+.5,
ybottom=k-j+1.5,
ytop=k-j+.5,
lwd=4)
text(i,
k-j+1,
round(coeff[j,i],2),
cex=1.2,
font=2)
}
else{
rect(xleft=i-.5,xright=i+.5,ybottom=k-j+1.5,ytop=k-j+.5)
text(i,k-j+1,round(coeff[j,i],2),cex=1.2,font=1)
}
}
axis(3,1:n,noms)
par(mar=c(0.5,0,0,0.5))
plot(0,axes=F,xlab='',ylab='',type='n',xlim=c(0,8),ylim=c(-.2,.8))
cols <- c('green','orange','red','black')
niv <- c('0','0.01','0.05','0.1')
for(i in 0:3){
polygon(c(1+2*i ,1+2*i ,1+2*i-.5 ,1+2*i),
c(.4 ,.7 , .4 , .4),
col=cols[i+1])
text(2*i,0.5,niv[i+1],cex=1.5)
}
text(8,.5,1,cex=1.5)
text(4,0,'p-value',cex=2)
box()
residus <- arimaSelect.out[[3]][[choix]]$res
par(mar=c(1,2,4,1))
acf(residus,main='')
title('acf',line=.5)
par(mar=c(1,2,4,1))
pacf(residus,main='')
title('pacf',line=.5)
par(mar=c(2,2,4,1))
qqnorm(residus,main='')
title('qq-norm',line=.5)
qqline(residus)
residus
}
if (par2 == 0) x <- log(x)
if (par2 != 0) x <- x^par2
(selection <- arimaSelect(x, order=c(par6,par3,par7), seasonal=list(order=c(par8,par4,par9), period=par5)))
bitmap(file='test1.png')
resid <- arimaSelectplot(selection)
dev.off()
resid
bitmap(file='test2.png')
acf(resid,length(resid)/2, main='Residual Autocorrelation Function')
dev.off()
bitmap(file='test3.png')
pacf(resid,length(resid)/2, main='Residual Partial Autocorrelation Function')
dev.off()
bitmap(file='test4.png')
cpgram(resid, main='Residual Cumulative Periodogram')
dev.off()
bitmap(file='test5.png')
hist(resid, main='Residual Histogram', xlab='values of Residuals')
dev.off()
bitmap(file='test6.png')
densityplot(~resid,col='black',main='Residual Density Plot', xlab='values of Residuals')
dev.off()
bitmap(file='test7.png')
qqnorm(resid, main='Residual Normal Q-Q Plot')
qqline(resid)
dev.off()
ncols <- length(selection[[1]][1,])
nrows <- length(selection[[2]][,1])-1
load(file='createtable')
a<-table.start()
a<-table.row.start(a)
a<-table.element(a,'ARIMA Parameter Estimation and Backward Selection', ncols+1,TRUE)
a<-table.row.end(a)
a<-table.row.start(a)
a<-table.element(a,'Iteration', header=TRUE)
for (i in 1:ncols) {
a<-table.element(a,names(selection[[3]][[1]]$coef)[i],header=TRUE)
}
a<-table.row.end(a)
for (j in 1:nrows) {
a<-table.row.start(a)
mydum <- 'Estimates ('
mydum <- paste(mydum,j)
mydum <- paste(mydum,')')
a<-table.element(a,mydum, header=TRUE)
for (i in 1:ncols) {
a<-table.element(a,round(selection[[1]][j,i],4))
}
a<-table.row.end(a)
a<-table.row.start(a)
a<-table.element(a,'(p-val)', header=TRUE)
for (i in 1:ncols) {
mydum <- '('
mydum <- paste(mydum,round(selection[[2]][j,i],4),sep='')
mydum <- paste(mydum,')')
a<-table.element(a,mydum)
}
a<-table.row.end(a)
}
a<-table.end(a)
table.save(a,file='mytable.tab')
a<-table.start()
a<-table.row.start(a)
a<-table.element(a,'Estimated ARIMA Residuals', 1,TRUE)
a<-table.row.end(a)
a<-table.row.start(a)
a<-table.element(a,'Value', 1,TRUE)
a<-table.row.end(a)
for (i in (par4*par5+par3):length(resid)) {
a<-table.row.start(a)
a<-table.element(a,resid[i])
a<-table.row.end(a)
}
a<-table.end(a)
table.save(a,file='mytable1.tab')