Free Statistics

of Irreproducible Research!

Author's title

Author*The author of this computation has been verified*
R Software Modulerwasp_autocorrelation.wasp
Title produced by software(Partial) Autocorrelation Function
Date of computationFri, 23 Dec 2016 12:52:17 +0100
Cite this page as followsStatistical Computations at FreeStatistics.org, Office for Research Development and Education, URL https://freestatistics.org/blog/index.php?v=date/2016/Dec/23/t1482493951g6ftiftjerpacad.htm/, Retrieved Fri, 01 Nov 2024 03:33:57 +0000
Statistical Computations at FreeStatistics.org, Office for Research Development and Education, URL https://freestatistics.org/blog/index.php?pk=302884, Retrieved Fri, 01 Nov 2024 03:33:57 +0000
QR Codes:

Original text written by user:
IsPrivate?No (this computation is public)
User-defined keywords
Estimated Impact109
Family? (F = Feedback message, R = changed R code, M = changed R Module, P = changed Parameters, D = changed Data)
-       [(Partial) Autocorrelation Function] [N1023] [2016-12-23 11:52:17] [8e56909c70ba580a071e942d9a393c42] [Current]
Feedback Forum

Post a new message
Dataseries X:
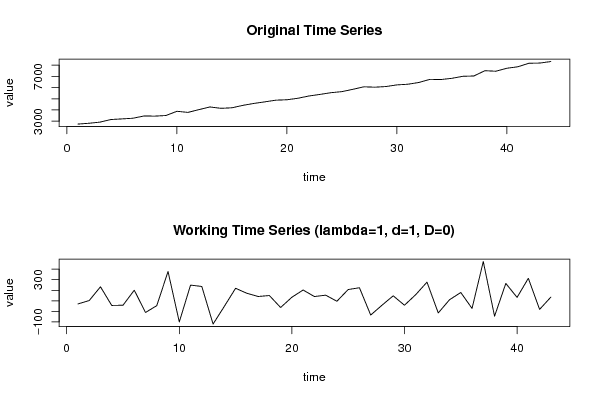
2742
2812.5
2915
3148
3204
3262
3462.5
3452
3506
3884
3783.5
4032.5
4268.5
4148
4195.5
4414.5
4586
4727
4877
4913.5
5047.5
5250
5390.5
5544
5640
5847
6071
6036
6094
6241.5
6299.5
6458
6735
6720
6830
7009
7037
7509.5
7463.5
7728.5
7861
8174.5
8193
8328


Summary of computational transaction
Raw Input view raw input (R code)
Raw Outputview raw output of R engine
Computing time1 seconds
R ServerBig Analytics Cloud Computing Center

\begin{tabular}{lllllllll}
\hline
Summary of computational transaction \tabularnewline
Raw Input view raw input (R code)  \tabularnewline
Raw Outputview raw output of R engine  \tabularnewline
Computing time1 seconds \tabularnewline
R ServerBig Analytics Cloud Computing Center \tabularnewline
\hline
\end{tabular}
%Source: https://freestatistics.org/blog/index.php?pk=302884&T=0

[TABLE]
[ROW]
Summary of computational transaction[/C][/ROW] [ROW]Raw Input[/C] view raw input (R code) [/C][/ROW] [ROW]Raw Output[/C]view raw output of R engine [/C][/ROW] [ROW]Computing time[/C]1 seconds[/C][/ROW] [ROW]R Server[/C]Big Analytics Cloud Computing Center[/C][/ROW] [/TABLE] Source: https://freestatistics.org/blog/index.php?pk=302884&T=0

Globally Unique Identifier (entire table): ba.freestatistics.org/blog/index.php?pk=302884&T=0

As an alternative you can also use a QR Code:  

The GUIDs for individual cells are displayed in the table below:

Summary of computational transaction
Raw Input view raw input (R code)
Raw Outputview raw output of R engine
Computing time1 seconds
R ServerBig Analytics Cloud Computing Center


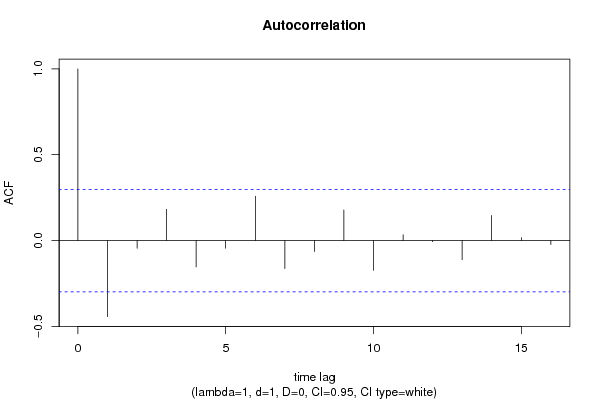
Autocorrelation Function
Time lag kACF(k)T-STATP-value
1-0.443619-2.9090.002859
2-0.045376-0.29760.383739
30.1824991.19670.118985
4-0.153664-1.00760.159631
5-0.044464-0.29160.386008
60.2577491.69020.049116
7-0.163491-1.07210.144832
8-0.06415-0.42070.33805
90.1780311.16740.124736
10-0.173727-1.13920.130463
110.0337950.22160.412834
12-0.006425-0.04210.483295
13-0.112162-0.73550.233015
140.1460280.95760.171817
150.016930.1110.456061
16-0.022917-0.15030.440624

\begin{tabular}{lllllllll}
\hline
Autocorrelation Function \tabularnewline
Time lag k & ACF(k) & T-STAT & P-value \tabularnewline
1 & -0.443619 & -2.909 & 0.002859 \tabularnewline
2 & -0.045376 & -0.2976 & 0.383739 \tabularnewline
3 & 0.182499 & 1.1967 & 0.118985 \tabularnewline
4 & -0.153664 & -1.0076 & 0.159631 \tabularnewline
5 & -0.044464 & -0.2916 & 0.386008 \tabularnewline
6 & 0.257749 & 1.6902 & 0.049116 \tabularnewline
7 & -0.163491 & -1.0721 & 0.144832 \tabularnewline
8 & -0.06415 & -0.4207 & 0.33805 \tabularnewline
9 & 0.178031 & 1.1674 & 0.124736 \tabularnewline
10 & -0.173727 & -1.1392 & 0.130463 \tabularnewline
11 & 0.033795 & 0.2216 & 0.412834 \tabularnewline
12 & -0.006425 & -0.0421 & 0.483295 \tabularnewline
13 & -0.112162 & -0.7355 & 0.233015 \tabularnewline
14 & 0.146028 & 0.9576 & 0.171817 \tabularnewline
15 & 0.01693 & 0.111 & 0.456061 \tabularnewline
16 & -0.022917 & -0.1503 & 0.440624 \tabularnewline
\hline
\end{tabular}
%Source: https://freestatistics.org/blog/index.php?pk=302884&T=1

[TABLE]
[ROW][C]Autocorrelation Function[/C][/ROW]
[ROW][C]Time lag k[/C][C]ACF(k)[/C][C]T-STAT[/C][C]P-value[/C][/ROW]
[ROW][C]1[/C][C]-0.443619[/C][C]-2.909[/C][C]0.002859[/C][/ROW]
[ROW][C]2[/C][C]-0.045376[/C][C]-0.2976[/C][C]0.383739[/C][/ROW]
[ROW][C]3[/C][C]0.182499[/C][C]1.1967[/C][C]0.118985[/C][/ROW]
[ROW][C]4[/C][C]-0.153664[/C][C]-1.0076[/C][C]0.159631[/C][/ROW]
[ROW][C]5[/C][C]-0.044464[/C][C]-0.2916[/C][C]0.386008[/C][/ROW]
[ROW][C]6[/C][C]0.257749[/C][C]1.6902[/C][C]0.049116[/C][/ROW]
[ROW][C]7[/C][C]-0.163491[/C][C]-1.0721[/C][C]0.144832[/C][/ROW]
[ROW][C]8[/C][C]-0.06415[/C][C]-0.4207[/C][C]0.33805[/C][/ROW]
[ROW][C]9[/C][C]0.178031[/C][C]1.1674[/C][C]0.124736[/C][/ROW]
[ROW][C]10[/C][C]-0.173727[/C][C]-1.1392[/C][C]0.130463[/C][/ROW]
[ROW][C]11[/C][C]0.033795[/C][C]0.2216[/C][C]0.412834[/C][/ROW]
[ROW][C]12[/C][C]-0.006425[/C][C]-0.0421[/C][C]0.483295[/C][/ROW]
[ROW][C]13[/C][C]-0.112162[/C][C]-0.7355[/C][C]0.233015[/C][/ROW]
[ROW][C]14[/C][C]0.146028[/C][C]0.9576[/C][C]0.171817[/C][/ROW]
[ROW][C]15[/C][C]0.01693[/C][C]0.111[/C][C]0.456061[/C][/ROW]
[ROW][C]16[/C][C]-0.022917[/C][C]-0.1503[/C][C]0.440624[/C][/ROW]
[/TABLE]
Source: https://freestatistics.org/blog/index.php?pk=302884&T=1

Globally Unique Identifier (entire table): ba.freestatistics.org/blog/index.php?pk=302884&T=1

As an alternative you can also use a QR Code:  

The GUIDs for individual cells are displayed in the table below:

Autocorrelation Function
Time lag kACF(k)T-STATP-value
1-0.443619-2.9090.002859
2-0.045376-0.29760.383739
30.1824991.19670.118985
4-0.153664-1.00760.159631
5-0.044464-0.29160.386008
60.2577491.69020.049116
7-0.163491-1.07210.144832
8-0.06415-0.42070.33805
90.1780311.16740.124736
10-0.173727-1.13920.130463
110.0337950.22160.412834
12-0.006425-0.04210.483295
13-0.112162-0.73550.233015
140.1460280.95760.171817
150.016930.1110.456061
16-0.022917-0.15030.440624


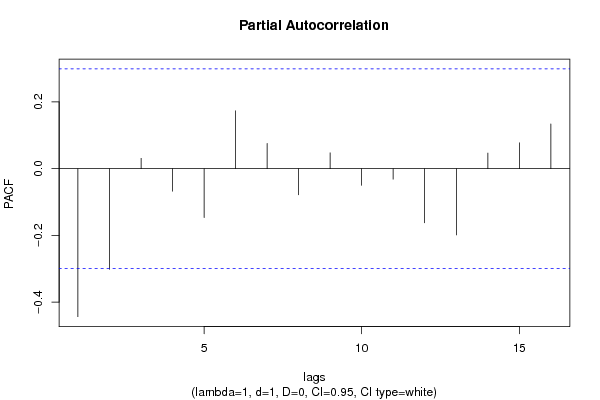
Partial Autocorrelation Function
Time lag kPACF(k)T-STATP-value
1-0.443619-2.9090.002859
2-0.301511-1.97710.02723
30.0308740.20250.420258
4-0.067402-0.4420.330358
5-0.146537-0.96090.170985
60.1731951.13570.131183
70.0754460.49470.311653
8-0.078419-0.51420.304863
90.0473650.31060.378804
10-0.049746-0.32620.372925
11-0.031399-0.20590.418921
12-0.162386-1.06480.146446
13-0.198562-1.30210.099914
140.0466250.30570.380638
150.0772940.50690.307424
160.1338280.87760.192527

\begin{tabular}{lllllllll}
\hline
Partial Autocorrelation Function \tabularnewline
Time lag k & PACF(k) & T-STAT & P-value \tabularnewline
1 & -0.443619 & -2.909 & 0.002859 \tabularnewline
2 & -0.301511 & -1.9771 & 0.02723 \tabularnewline
3 & 0.030874 & 0.2025 & 0.420258 \tabularnewline
4 & -0.067402 & -0.442 & 0.330358 \tabularnewline
5 & -0.146537 & -0.9609 & 0.170985 \tabularnewline
6 & 0.173195 & 1.1357 & 0.131183 \tabularnewline
7 & 0.075446 & 0.4947 & 0.311653 \tabularnewline
8 & -0.078419 & -0.5142 & 0.304863 \tabularnewline
9 & 0.047365 & 0.3106 & 0.378804 \tabularnewline
10 & -0.049746 & -0.3262 & 0.372925 \tabularnewline
11 & -0.031399 & -0.2059 & 0.418921 \tabularnewline
12 & -0.162386 & -1.0648 & 0.146446 \tabularnewline
13 & -0.198562 & -1.3021 & 0.099914 \tabularnewline
14 & 0.046625 & 0.3057 & 0.380638 \tabularnewline
15 & 0.077294 & 0.5069 & 0.307424 \tabularnewline
16 & 0.133828 & 0.8776 & 0.192527 \tabularnewline
\hline
\end{tabular}
%Source: https://freestatistics.org/blog/index.php?pk=302884&T=2

[TABLE]
[ROW][C]Partial Autocorrelation Function[/C][/ROW]
[ROW][C]Time lag k[/C][C]PACF(k)[/C][C]T-STAT[/C][C]P-value[/C][/ROW]
[ROW][C]1[/C][C]-0.443619[/C][C]-2.909[/C][C]0.002859[/C][/ROW]
[ROW][C]2[/C][C]-0.301511[/C][C]-1.9771[/C][C]0.02723[/C][/ROW]
[ROW][C]3[/C][C]0.030874[/C][C]0.2025[/C][C]0.420258[/C][/ROW]
[ROW][C]4[/C][C]-0.067402[/C][C]-0.442[/C][C]0.330358[/C][/ROW]
[ROW][C]5[/C][C]-0.146537[/C][C]-0.9609[/C][C]0.170985[/C][/ROW]
[ROW][C]6[/C][C]0.173195[/C][C]1.1357[/C][C]0.131183[/C][/ROW]
[ROW][C]7[/C][C]0.075446[/C][C]0.4947[/C][C]0.311653[/C][/ROW]
[ROW][C]8[/C][C]-0.078419[/C][C]-0.5142[/C][C]0.304863[/C][/ROW]
[ROW][C]9[/C][C]0.047365[/C][C]0.3106[/C][C]0.378804[/C][/ROW]
[ROW][C]10[/C][C]-0.049746[/C][C]-0.3262[/C][C]0.372925[/C][/ROW]
[ROW][C]11[/C][C]-0.031399[/C][C]-0.2059[/C][C]0.418921[/C][/ROW]
[ROW][C]12[/C][C]-0.162386[/C][C]-1.0648[/C][C]0.146446[/C][/ROW]
[ROW][C]13[/C][C]-0.198562[/C][C]-1.3021[/C][C]0.099914[/C][/ROW]
[ROW][C]14[/C][C]0.046625[/C][C]0.3057[/C][C]0.380638[/C][/ROW]
[ROW][C]15[/C][C]0.077294[/C][C]0.5069[/C][C]0.307424[/C][/ROW]
[ROW][C]16[/C][C]0.133828[/C][C]0.8776[/C][C]0.192527[/C][/ROW]
[/TABLE]
Source: https://freestatistics.org/blog/index.php?pk=302884&T=2

Globally Unique Identifier (entire table): ba.freestatistics.org/blog/index.php?pk=302884&T=2

As an alternative you can also use a QR Code:  

The GUIDs for individual cells are displayed in the table below:

Partial Autocorrelation Function
Time lag kPACF(k)T-STATP-value
1-0.443619-2.9090.002859
2-0.301511-1.97710.02723
30.0308740.20250.420258
4-0.067402-0.4420.330358
5-0.146537-0.96090.170985
60.1731951.13570.131183
70.0754460.49470.311653
8-0.078419-0.51420.304863
90.0473650.31060.378804
10-0.049746-0.32620.372925
11-0.031399-0.20590.418921
12-0.162386-1.06480.146446
13-0.198562-1.30210.099914
140.0466250.30570.380638
150.0772940.50690.307424
160.1338280.87760.192527


Parameters (Session):
par1 = additive ; par2 = 12 ;
Parameters (R input):
par1 = Default ; par2 = 1 ; par3 = 1 ; par4 = 0 ; par5 = 12 ; par6 = White Noise ; par7 = 0.95 ; par8 = ;
R code (references can be found in the software module):
if (par1 == 'Default') {
par1 = 10*log10(length(x))
} else {
par1 <- as.numeric(par1)
}
par2 <- as.numeric(par2)
par3 <- as.numeric(par3)
par4 <- as.numeric(par4)
par5 <- as.numeric(par5)
if (par6 == 'White Noise') par6 <- 'white' else par6 <- 'ma'
par7 <- as.numeric(par7)
if (par8 != '') par8 <- as.numeric(par8)
x <- na.omit(x)
ox <- x
if (par8 == '') {
if (par2 == 0) {
x <- log(x)
} else {
x <- (x ^ par2 - 1) / par2
}
} else {
x <- log(x,base=par8)
}
if (par3 > 0) x <- diff(x,lag=1,difference=par3)
if (par4 > 0) x <- diff(x,lag=par5,difference=par4)
bitmap(file='picts.png')
op <- par(mfrow=c(2,1))
plot(ox,type='l',main='Original Time Series',xlab='time',ylab='value')
if (par8=='') {
mytitle <- paste('Working Time Series (lambda=',par2,', d=',par3,', D=',par4,')',sep='')
mysub <- paste('(lambda=',par2,', d=',par3,', D=',par4,', CI=', par7, ', CI type=',par6,')',sep='')
} else {
mytitle <- paste('Working Time Series (base=',par8,', d=',par3,', D=',par4,')',sep='')
mysub <- paste('(base=',par8,', d=',par3,', D=',par4,', CI=', par7, ', CI type=',par6,')',sep='')
}
plot(x,type='l', main=mytitle,xlab='time',ylab='value')
par(op)
dev.off()
bitmap(file='pic1.png')
racf <- acf(x, par1, main='Autocorrelation', xlab='time lag', ylab='ACF', ci.type=par6, ci=par7, sub=mysub)
dev.off()
bitmap(file='pic2.png')
rpacf <- pacf(x,par1,main='Partial Autocorrelation',xlab='lags',ylab='PACF',sub=mysub)
dev.off()
(myacf <- c(racf$acf))
(mypacf <- c(rpacf$acf))
lengthx <- length(x)
sqrtn <- sqrt(lengthx)
load(file='createtable')
a<-table.start()
a<-table.row.start(a)
a<-table.element(a,'Autocorrelation Function',4,TRUE)
a<-table.row.end(a)
a<-table.row.start(a)
a<-table.element(a,'Time lag k',header=TRUE)
a<-table.element(a,'ACF(k)',header=TRUE)
a<-table.element(a,'T-STAT',header=TRUE)
a<-table.element(a,'P-value',header=TRUE)
a<-table.row.end(a)
for (i in 2:(par1+1)) {
a<-table.row.start(a)
a<-table.element(a,i-1,header=TRUE)
a<-table.element(a,round(myacf[i],6))
mytstat <- myacf[i]*sqrtn
a<-table.element(a,round(mytstat,4))
a<-table.element(a,round(1-pt(abs(mytstat),lengthx),6))
a<-table.row.end(a)
}
a<-table.end(a)
table.save(a,file='mytable.tab')
a<-table.start()
a<-table.row.start(a)
a<-table.element(a,'Partial Autocorrelation Function',4,TRUE)
a<-table.row.end(a)
a<-table.row.start(a)
a<-table.element(a,'Time lag k',header=TRUE)
a<-table.element(a,'PACF(k)',header=TRUE)
a<-table.element(a,'T-STAT',header=TRUE)
a<-table.element(a,'P-value',header=TRUE)
a<-table.row.end(a)
for (i in 1:par1) {
a<-table.row.start(a)
a<-table.element(a,i,header=TRUE)
a<-table.element(a,round(mypacf[i],6))
mytstat <- mypacf[i]*sqrtn
a<-table.element(a,round(mytstat,4))
a<-table.element(a,round(1-pt(abs(mytstat),lengthx),6))
a<-table.row.end(a)
}
a<-table.end(a)
table.save(a,file='mytable1.tab')