Free Statistics

of Irreproducible Research!

Author's title

Author*The author of this computation has been verified*
R Software Modulerwasp_autocorrelation.wasp
Title produced by software(Partial) Autocorrelation Function
Date of computationThu, 22 Dec 2016 18:08:00 +0100
Cite this page as followsStatistical Computations at FreeStatistics.org, Office for Research Development and Education, URL https://freestatistics.org/blog/index.php?v=date/2016/Dec/22/t1482427031ouf9chc8xbas4ir.htm/, Retrieved Fri, 01 Nov 2024 03:40:36 +0000
Statistical Computations at FreeStatistics.org, Office for Research Development and Education, URL https://freestatistics.org/blog/index.php?pk=302580, Retrieved Fri, 01 Nov 2024 03:40:36 +0000
QR Codes:

Original text written by user:
IsPrivate?No (this computation is public)
User-defined keywords
Estimated Impact100
Family? (F = Feedback message, R = changed R code, M = changed R Module, P = changed Parameters, D = changed Data)
-       [(Partial) Autocorrelation Function] [(Partial) autocor...] [2016-12-22 17:08:00] [d4ebbcc95b180bc93fc42d05f31a3dde] [Current]
Feedback Forum

Post a new message
Dataseries X:
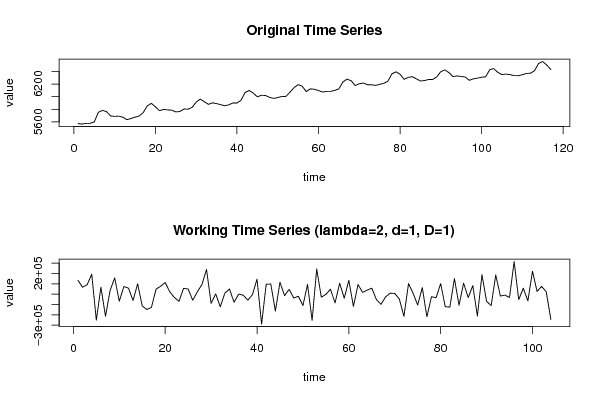
5572.3
5565.55
5576.85
5577.3
5598.85
5752.55
5782.2
5763
5694.6
5686.85
5691.6
5674.15
5635.55
5652.6
5675.7
5692.25
5747.05
5854.15
5894.8
5839.4
5778.15
5797.75
5790.7
5786.3
5758.6
5764.75
5804.75
5801.35
5829.75
5913.7
5962
5920.25
5879.1
5902.3
5889.95
5873.9
5856.1
5870.8
5900.1
5900.6
5944.3
6066.2
6098.75
6058.4
5998
6022.4
6018.7
5989.95
5972.55
5985.35
6004.45
6004.1
6071.05
6143.55
6191.25
6167.5
6081.35
6124.25
6118.3
6097.8
6074.55
6083.9
6084.65
6099.8
6124.45
6235.65
6278.05
6254.4
6177.3
6205.95
6217.2
6190.8
6189.55
6179.5
6195.35
6213
6243.45
6361.75
6395.2
6356.6
6276.5
6306.25
6318.4
6284.9
6249.5
6256
6272.9
6273.65
6313.95
6396.85
6426.35
6382.6
6319
6329.5
6321.8
6312.35
6260
6283.6
6295.15
6309.15
6315.75
6427.95
6446.55
6385.65
6351.45
6359.1
6350.05
6335.6
6333.55
6348.55
6369.1
6372.75
6413.95
6528.6
6558.4
6501.95
6430.5


Summary of computational transaction
Raw Input view raw input (R code)
Raw Outputview raw output of R engine
Computing time1 seconds
R ServerBig Analytics Cloud Computing Center

\begin{tabular}{lllllllll}
\hline
Summary of computational transaction \tabularnewline
Raw Input view raw input (R code)  \tabularnewline
Raw Outputview raw output of R engine  \tabularnewline
Computing time1 seconds \tabularnewline
R ServerBig Analytics Cloud Computing Center \tabularnewline
\hline
\end{tabular}
%Source: https://freestatistics.org/blog/index.php?pk=302580&T=0

[TABLE]
[ROW]
Summary of computational transaction[/C][/ROW] [ROW]Raw Input[/C] view raw input (R code) [/C][/ROW] [ROW]Raw Output[/C]view raw output of R engine [/C][/ROW] [ROW]Computing time[/C]1 seconds[/C][/ROW] [ROW]R Server[/C]Big Analytics Cloud Computing Center[/C][/ROW] [/TABLE] Source: https://freestatistics.org/blog/index.php?pk=302580&T=0

Globally Unique Identifier (entire table): ba.freestatistics.org/blog/index.php?pk=302580&T=0

As an alternative you can also use a QR Code:  

The GUIDs for individual cells are displayed in the table below:

Summary of computational transaction
Raw Input view raw input (R code)
Raw Outputview raw output of R engine
Computing time1 seconds
R ServerBig Analytics Cloud Computing Center


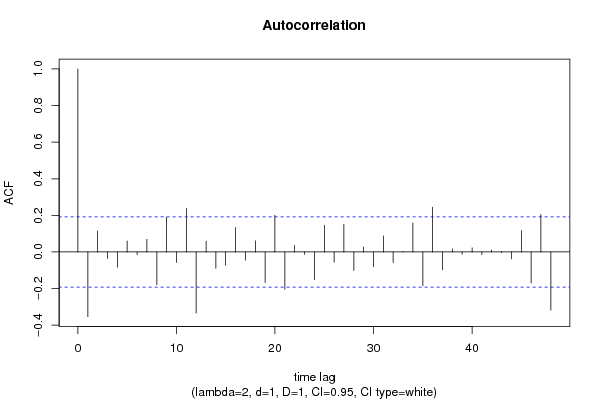
Autocorrelation Function
Time lag kACF(k)T-STATP-value
1-0.353582-3.60580.00024
20.1137841.16040.124276
3-0.035672-0.36380.35838
4-0.083412-0.85060.198461
50.0598690.61050.271416
6-0.013817-0.14090.444106
70.0687910.70150.242269
8-0.179018-1.82560.035388
90.1897221.93480.027866
10-0.058081-0.59230.277462
110.2371942.41890.008652
12-0.333314-3.39910.00048
130.0589930.60160.274369
14-0.088714-0.90470.183855
15-0.073154-0.7460.228666
160.1319351.34550.090699
17-0.044774-0.45660.324453
180.0607730.61980.268384
19-0.16696-1.70270.045808
200.2003212.04290.021797
21-0.203548-2.07580.02019
220.0359710.36680.357243
23-0.013517-0.13780.445314
24-0.151429-1.54430.062779
250.1457831.48670.070059
26-0.055773-0.56880.285368
270.1498441.52810.064759
28-0.1014-1.03410.15175
290.0263870.26910.394194
30-0.080817-0.82420.205863
310.0871090.88830.188204
32-0.057895-0.59040.278097
330.0014610.01490.49407
340.157611.60730.055509
35-0.18499-1.88650.031006
360.2444182.49260.00713
37-0.097753-0.99690.160567
380.0158320.16150.436024
39-0.012883-0.13140.447864
400.0222110.22650.410623
41-0.015257-0.15560.438329
420.0108290.11040.456138
43-0.003834-0.03910.484444
44-0.036903-0.37630.353716
450.1167521.19060.118253
46-0.170046-1.73410.042928
470.2050632.09120.019471
48-0.318118-3.24420.000792

\begin{tabular}{lllllllll}
\hline
Autocorrelation Function \tabularnewline
Time lag k & ACF(k) & T-STAT & P-value \tabularnewline
1 & -0.353582 & -3.6058 & 0.00024 \tabularnewline
2 & 0.113784 & 1.1604 & 0.124276 \tabularnewline
3 & -0.035672 & -0.3638 & 0.35838 \tabularnewline
4 & -0.083412 & -0.8506 & 0.198461 \tabularnewline
5 & 0.059869 & 0.6105 & 0.271416 \tabularnewline
6 & -0.013817 & -0.1409 & 0.444106 \tabularnewline
7 & 0.068791 & 0.7015 & 0.242269 \tabularnewline
8 & -0.179018 & -1.8256 & 0.035388 \tabularnewline
9 & 0.189722 & 1.9348 & 0.027866 \tabularnewline
10 & -0.058081 & -0.5923 & 0.277462 \tabularnewline
11 & 0.237194 & 2.4189 & 0.008652 \tabularnewline
12 & -0.333314 & -3.3991 & 0.00048 \tabularnewline
13 & 0.058993 & 0.6016 & 0.274369 \tabularnewline
14 & -0.088714 & -0.9047 & 0.183855 \tabularnewline
15 & -0.073154 & -0.746 & 0.228666 \tabularnewline
16 & 0.131935 & 1.3455 & 0.090699 \tabularnewline
17 & -0.044774 & -0.4566 & 0.324453 \tabularnewline
18 & 0.060773 & 0.6198 & 0.268384 \tabularnewline
19 & -0.16696 & -1.7027 & 0.045808 \tabularnewline
20 & 0.200321 & 2.0429 & 0.021797 \tabularnewline
21 & -0.203548 & -2.0758 & 0.02019 \tabularnewline
22 & 0.035971 & 0.3668 & 0.357243 \tabularnewline
23 & -0.013517 & -0.1378 & 0.445314 \tabularnewline
24 & -0.151429 & -1.5443 & 0.062779 \tabularnewline
25 & 0.145783 & 1.4867 & 0.070059 \tabularnewline
26 & -0.055773 & -0.5688 & 0.285368 \tabularnewline
27 & 0.149844 & 1.5281 & 0.064759 \tabularnewline
28 & -0.1014 & -1.0341 & 0.15175 \tabularnewline
29 & 0.026387 & 0.2691 & 0.394194 \tabularnewline
30 & -0.080817 & -0.8242 & 0.205863 \tabularnewline
31 & 0.087109 & 0.8883 & 0.188204 \tabularnewline
32 & -0.057895 & -0.5904 & 0.278097 \tabularnewline
33 & 0.001461 & 0.0149 & 0.49407 \tabularnewline
34 & 0.15761 & 1.6073 & 0.055509 \tabularnewline
35 & -0.18499 & -1.8865 & 0.031006 \tabularnewline
36 & 0.244418 & 2.4926 & 0.00713 \tabularnewline
37 & -0.097753 & -0.9969 & 0.160567 \tabularnewline
38 & 0.015832 & 0.1615 & 0.436024 \tabularnewline
39 & -0.012883 & -0.1314 & 0.447864 \tabularnewline
40 & 0.022211 & 0.2265 & 0.410623 \tabularnewline
41 & -0.015257 & -0.1556 & 0.438329 \tabularnewline
42 & 0.010829 & 0.1104 & 0.456138 \tabularnewline
43 & -0.003834 & -0.0391 & 0.484444 \tabularnewline
44 & -0.036903 & -0.3763 & 0.353716 \tabularnewline
45 & 0.116752 & 1.1906 & 0.118253 \tabularnewline
46 & -0.170046 & -1.7341 & 0.042928 \tabularnewline
47 & 0.205063 & 2.0912 & 0.019471 \tabularnewline
48 & -0.318118 & -3.2442 & 0.000792 \tabularnewline
\hline
\end{tabular}
%Source: https://freestatistics.org/blog/index.php?pk=302580&T=1

[TABLE]
[ROW][C]Autocorrelation Function[/C][/ROW]
[ROW][C]Time lag k[/C][C]ACF(k)[/C][C]T-STAT[/C][C]P-value[/C][/ROW]
[ROW][C]1[/C][C]-0.353582[/C][C]-3.6058[/C][C]0.00024[/C][/ROW]
[ROW][C]2[/C][C]0.113784[/C][C]1.1604[/C][C]0.124276[/C][/ROW]
[ROW][C]3[/C][C]-0.035672[/C][C]-0.3638[/C][C]0.35838[/C][/ROW]
[ROW][C]4[/C][C]-0.083412[/C][C]-0.8506[/C][C]0.198461[/C][/ROW]
[ROW][C]5[/C][C]0.059869[/C][C]0.6105[/C][C]0.271416[/C][/ROW]
[ROW][C]6[/C][C]-0.013817[/C][C]-0.1409[/C][C]0.444106[/C][/ROW]
[ROW][C]7[/C][C]0.068791[/C][C]0.7015[/C][C]0.242269[/C][/ROW]
[ROW][C]8[/C][C]-0.179018[/C][C]-1.8256[/C][C]0.035388[/C][/ROW]
[ROW][C]9[/C][C]0.189722[/C][C]1.9348[/C][C]0.027866[/C][/ROW]
[ROW][C]10[/C][C]-0.058081[/C][C]-0.5923[/C][C]0.277462[/C][/ROW]
[ROW][C]11[/C][C]0.237194[/C][C]2.4189[/C][C]0.008652[/C][/ROW]
[ROW][C]12[/C][C]-0.333314[/C][C]-3.3991[/C][C]0.00048[/C][/ROW]
[ROW][C]13[/C][C]0.058993[/C][C]0.6016[/C][C]0.274369[/C][/ROW]
[ROW][C]14[/C][C]-0.088714[/C][C]-0.9047[/C][C]0.183855[/C][/ROW]
[ROW][C]15[/C][C]-0.073154[/C][C]-0.746[/C][C]0.228666[/C][/ROW]
[ROW][C]16[/C][C]0.131935[/C][C]1.3455[/C][C]0.090699[/C][/ROW]
[ROW][C]17[/C][C]-0.044774[/C][C]-0.4566[/C][C]0.324453[/C][/ROW]
[ROW][C]18[/C][C]0.060773[/C][C]0.6198[/C][C]0.268384[/C][/ROW]
[ROW][C]19[/C][C]-0.16696[/C][C]-1.7027[/C][C]0.045808[/C][/ROW]
[ROW][C]20[/C][C]0.200321[/C][C]2.0429[/C][C]0.021797[/C][/ROW]
[ROW][C]21[/C][C]-0.203548[/C][C]-2.0758[/C][C]0.02019[/C][/ROW]
[ROW][C]22[/C][C]0.035971[/C][C]0.3668[/C][C]0.357243[/C][/ROW]
[ROW][C]23[/C][C]-0.013517[/C][C]-0.1378[/C][C]0.445314[/C][/ROW]
[ROW][C]24[/C][C]-0.151429[/C][C]-1.5443[/C][C]0.062779[/C][/ROW]
[ROW][C]25[/C][C]0.145783[/C][C]1.4867[/C][C]0.070059[/C][/ROW]
[ROW][C]26[/C][C]-0.055773[/C][C]-0.5688[/C][C]0.285368[/C][/ROW]
[ROW][C]27[/C][C]0.149844[/C][C]1.5281[/C][C]0.064759[/C][/ROW]
[ROW][C]28[/C][C]-0.1014[/C][C]-1.0341[/C][C]0.15175[/C][/ROW]
[ROW][C]29[/C][C]0.026387[/C][C]0.2691[/C][C]0.394194[/C][/ROW]
[ROW][C]30[/C][C]-0.080817[/C][C]-0.8242[/C][C]0.205863[/C][/ROW]
[ROW][C]31[/C][C]0.087109[/C][C]0.8883[/C][C]0.188204[/C][/ROW]
[ROW][C]32[/C][C]-0.057895[/C][C]-0.5904[/C][C]0.278097[/C][/ROW]
[ROW][C]33[/C][C]0.001461[/C][C]0.0149[/C][C]0.49407[/C][/ROW]
[ROW][C]34[/C][C]0.15761[/C][C]1.6073[/C][C]0.055509[/C][/ROW]
[ROW][C]35[/C][C]-0.18499[/C][C]-1.8865[/C][C]0.031006[/C][/ROW]
[ROW][C]36[/C][C]0.244418[/C][C]2.4926[/C][C]0.00713[/C][/ROW]
[ROW][C]37[/C][C]-0.097753[/C][C]-0.9969[/C][C]0.160567[/C][/ROW]
[ROW][C]38[/C][C]0.015832[/C][C]0.1615[/C][C]0.436024[/C][/ROW]
[ROW][C]39[/C][C]-0.012883[/C][C]-0.1314[/C][C]0.447864[/C][/ROW]
[ROW][C]40[/C][C]0.022211[/C][C]0.2265[/C][C]0.410623[/C][/ROW]
[ROW][C]41[/C][C]-0.015257[/C][C]-0.1556[/C][C]0.438329[/C][/ROW]
[ROW][C]42[/C][C]0.010829[/C][C]0.1104[/C][C]0.456138[/C][/ROW]
[ROW][C]43[/C][C]-0.003834[/C][C]-0.0391[/C][C]0.484444[/C][/ROW]
[ROW][C]44[/C][C]-0.036903[/C][C]-0.3763[/C][C]0.353716[/C][/ROW]
[ROW][C]45[/C][C]0.116752[/C][C]1.1906[/C][C]0.118253[/C][/ROW]
[ROW][C]46[/C][C]-0.170046[/C][C]-1.7341[/C][C]0.042928[/C][/ROW]
[ROW][C]47[/C][C]0.205063[/C][C]2.0912[/C][C]0.019471[/C][/ROW]
[ROW][C]48[/C][C]-0.318118[/C][C]-3.2442[/C][C]0.000792[/C][/ROW]
[/TABLE]
Source: https://freestatistics.org/blog/index.php?pk=302580&T=1

Globally Unique Identifier (entire table): ba.freestatistics.org/blog/index.php?pk=302580&T=1

As an alternative you can also use a QR Code:  

The GUIDs for individual cells are displayed in the table below:

Autocorrelation Function
Time lag kACF(k)T-STATP-value
1-0.353582-3.60580.00024
20.1137841.16040.124276
3-0.035672-0.36380.35838
4-0.083412-0.85060.198461
50.0598690.61050.271416
6-0.013817-0.14090.444106
70.0687910.70150.242269
8-0.179018-1.82560.035388
90.1897221.93480.027866
10-0.058081-0.59230.277462
110.2371942.41890.008652
12-0.333314-3.39910.00048
130.0589930.60160.274369
14-0.088714-0.90470.183855
15-0.073154-0.7460.228666
160.1319351.34550.090699
17-0.044774-0.45660.324453
180.0607730.61980.268384
19-0.16696-1.70270.045808
200.2003212.04290.021797
21-0.203548-2.07580.02019
220.0359710.36680.357243
23-0.013517-0.13780.445314
24-0.151429-1.54430.062779
250.1457831.48670.070059
26-0.055773-0.56880.285368
270.1498441.52810.064759
28-0.1014-1.03410.15175
290.0263870.26910.394194
30-0.080817-0.82420.205863
310.0871090.88830.188204
32-0.057895-0.59040.278097
330.0014610.01490.49407
340.157611.60730.055509
35-0.18499-1.88650.031006
360.2444182.49260.00713
37-0.097753-0.99690.160567
380.0158320.16150.436024
39-0.012883-0.13140.447864
400.0222110.22650.410623
41-0.015257-0.15560.438329
420.0108290.11040.456138
43-0.003834-0.03910.484444
44-0.036903-0.37630.353716
450.1167521.19060.118253
46-0.170046-1.73410.042928
470.2050632.09120.019471
48-0.318118-3.24420.000792


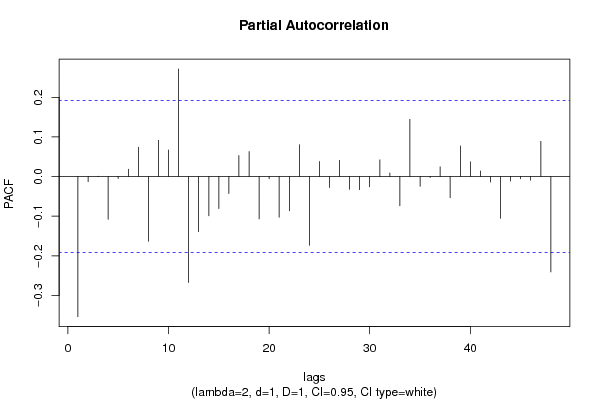
Partial Autocorrelation Function
Time lag kPACF(k)T-STATP-value
1-0.353582-3.60580.00024
2-0.012841-0.1310.448032
30.0006130.00630.49751
4-0.108059-1.1020.136505
5-0.005054-0.05150.479495
60.01830.18660.426161
70.0738510.75310.226535
8-0.16343-1.66670.049295
90.0916460.93460.176076
100.0670780.68410.247727
110.2714142.76790.00334
12-0.267222-2.72510.003771
13-0.139007-1.41760.079648
14-0.099157-1.01120.157132
15-0.080739-0.82340.206088
16-0.042986-0.43840.331014
170.0527760.53820.295789
180.0628790.64120.261387
19-0.10699-1.09110.138877
20-0.005681-0.05790.476957
21-0.103002-1.05040.147981
22-0.086541-0.88260.189757
230.0803470.81940.207221
24-0.173442-1.76880.039933
250.0377650.38510.350465
26-0.027623-0.28170.389365
270.0407960.4160.339119
28-0.032111-0.32750.371987
29-0.03313-0.33790.368074
30-0.025976-0.26490.395803
310.0421050.42940.334265
320.0090780.09260.463208
33-0.073686-0.75150.227038
340.1442211.47080.072186
35-0.024651-0.25140.401003
36-0.002584-0.02640.489513
370.0242960.24780.402402
38-0.053442-0.5450.293458
390.0771140.78640.216709
400.0370120.37740.353306
410.0138340.14110.44404
42-0.01379-0.14060.444218
43-0.105523-1.07610.142181
44-0.011338-0.11560.454087
45-0.005754-0.05870.476659
46-0.009093-0.09270.463149
470.0886960.90450.183904
48-0.240722-2.45490.007876

\begin{tabular}{lllllllll}
\hline
Partial Autocorrelation Function \tabularnewline
Time lag k & PACF(k) & T-STAT & P-value \tabularnewline
1 & -0.353582 & -3.6058 & 0.00024 \tabularnewline
2 & -0.012841 & -0.131 & 0.448032 \tabularnewline
3 & 0.000613 & 0.0063 & 0.49751 \tabularnewline
4 & -0.108059 & -1.102 & 0.136505 \tabularnewline
5 & -0.005054 & -0.0515 & 0.479495 \tabularnewline
6 & 0.0183 & 0.1866 & 0.426161 \tabularnewline
7 & 0.073851 & 0.7531 & 0.226535 \tabularnewline
8 & -0.16343 & -1.6667 & 0.049295 \tabularnewline
9 & 0.091646 & 0.9346 & 0.176076 \tabularnewline
10 & 0.067078 & 0.6841 & 0.247727 \tabularnewline
11 & 0.271414 & 2.7679 & 0.00334 \tabularnewline
12 & -0.267222 & -2.7251 & 0.003771 \tabularnewline
13 & -0.139007 & -1.4176 & 0.079648 \tabularnewline
14 & -0.099157 & -1.0112 & 0.157132 \tabularnewline
15 & -0.080739 & -0.8234 & 0.206088 \tabularnewline
16 & -0.042986 & -0.4384 & 0.331014 \tabularnewline
17 & 0.052776 & 0.5382 & 0.295789 \tabularnewline
18 & 0.062879 & 0.6412 & 0.261387 \tabularnewline
19 & -0.10699 & -1.0911 & 0.138877 \tabularnewline
20 & -0.005681 & -0.0579 & 0.476957 \tabularnewline
21 & -0.103002 & -1.0504 & 0.147981 \tabularnewline
22 & -0.086541 & -0.8826 & 0.189757 \tabularnewline
23 & 0.080347 & 0.8194 & 0.207221 \tabularnewline
24 & -0.173442 & -1.7688 & 0.039933 \tabularnewline
25 & 0.037765 & 0.3851 & 0.350465 \tabularnewline
26 & -0.027623 & -0.2817 & 0.389365 \tabularnewline
27 & 0.040796 & 0.416 & 0.339119 \tabularnewline
28 & -0.032111 & -0.3275 & 0.371987 \tabularnewline
29 & -0.03313 & -0.3379 & 0.368074 \tabularnewline
30 & -0.025976 & -0.2649 & 0.395803 \tabularnewline
31 & 0.042105 & 0.4294 & 0.334265 \tabularnewline
32 & 0.009078 & 0.0926 & 0.463208 \tabularnewline
33 & -0.073686 & -0.7515 & 0.227038 \tabularnewline
34 & 0.144221 & 1.4708 & 0.072186 \tabularnewline
35 & -0.024651 & -0.2514 & 0.401003 \tabularnewline
36 & -0.002584 & -0.0264 & 0.489513 \tabularnewline
37 & 0.024296 & 0.2478 & 0.402402 \tabularnewline
38 & -0.053442 & -0.545 & 0.293458 \tabularnewline
39 & 0.077114 & 0.7864 & 0.216709 \tabularnewline
40 & 0.037012 & 0.3774 & 0.353306 \tabularnewline
41 & 0.013834 & 0.1411 & 0.44404 \tabularnewline
42 & -0.01379 & -0.1406 & 0.444218 \tabularnewline
43 & -0.105523 & -1.0761 & 0.142181 \tabularnewline
44 & -0.011338 & -0.1156 & 0.454087 \tabularnewline
45 & -0.005754 & -0.0587 & 0.476659 \tabularnewline
46 & -0.009093 & -0.0927 & 0.463149 \tabularnewline
47 & 0.088696 & 0.9045 & 0.183904 \tabularnewline
48 & -0.240722 & -2.4549 & 0.007876 \tabularnewline
\hline
\end{tabular}
%Source: https://freestatistics.org/blog/index.php?pk=302580&T=2

[TABLE]
[ROW][C]Partial Autocorrelation Function[/C][/ROW]
[ROW][C]Time lag k[/C][C]PACF(k)[/C][C]T-STAT[/C][C]P-value[/C][/ROW]
[ROW][C]1[/C][C]-0.353582[/C][C]-3.6058[/C][C]0.00024[/C][/ROW]
[ROW][C]2[/C][C]-0.012841[/C][C]-0.131[/C][C]0.448032[/C][/ROW]
[ROW][C]3[/C][C]0.000613[/C][C]0.0063[/C][C]0.49751[/C][/ROW]
[ROW][C]4[/C][C]-0.108059[/C][C]-1.102[/C][C]0.136505[/C][/ROW]
[ROW][C]5[/C][C]-0.005054[/C][C]-0.0515[/C][C]0.479495[/C][/ROW]
[ROW][C]6[/C][C]0.0183[/C][C]0.1866[/C][C]0.426161[/C][/ROW]
[ROW][C]7[/C][C]0.073851[/C][C]0.7531[/C][C]0.226535[/C][/ROW]
[ROW][C]8[/C][C]-0.16343[/C][C]-1.6667[/C][C]0.049295[/C][/ROW]
[ROW][C]9[/C][C]0.091646[/C][C]0.9346[/C][C]0.176076[/C][/ROW]
[ROW][C]10[/C][C]0.067078[/C][C]0.6841[/C][C]0.247727[/C][/ROW]
[ROW][C]11[/C][C]0.271414[/C][C]2.7679[/C][C]0.00334[/C][/ROW]
[ROW][C]12[/C][C]-0.267222[/C][C]-2.7251[/C][C]0.003771[/C][/ROW]
[ROW][C]13[/C][C]-0.139007[/C][C]-1.4176[/C][C]0.079648[/C][/ROW]
[ROW][C]14[/C][C]-0.099157[/C][C]-1.0112[/C][C]0.157132[/C][/ROW]
[ROW][C]15[/C][C]-0.080739[/C][C]-0.8234[/C][C]0.206088[/C][/ROW]
[ROW][C]16[/C][C]-0.042986[/C][C]-0.4384[/C][C]0.331014[/C][/ROW]
[ROW][C]17[/C][C]0.052776[/C][C]0.5382[/C][C]0.295789[/C][/ROW]
[ROW][C]18[/C][C]0.062879[/C][C]0.6412[/C][C]0.261387[/C][/ROW]
[ROW][C]19[/C][C]-0.10699[/C][C]-1.0911[/C][C]0.138877[/C][/ROW]
[ROW][C]20[/C][C]-0.005681[/C][C]-0.0579[/C][C]0.476957[/C][/ROW]
[ROW][C]21[/C][C]-0.103002[/C][C]-1.0504[/C][C]0.147981[/C][/ROW]
[ROW][C]22[/C][C]-0.086541[/C][C]-0.8826[/C][C]0.189757[/C][/ROW]
[ROW][C]23[/C][C]0.080347[/C][C]0.8194[/C][C]0.207221[/C][/ROW]
[ROW][C]24[/C][C]-0.173442[/C][C]-1.7688[/C][C]0.039933[/C][/ROW]
[ROW][C]25[/C][C]0.037765[/C][C]0.3851[/C][C]0.350465[/C][/ROW]
[ROW][C]26[/C][C]-0.027623[/C][C]-0.2817[/C][C]0.389365[/C][/ROW]
[ROW][C]27[/C][C]0.040796[/C][C]0.416[/C][C]0.339119[/C][/ROW]
[ROW][C]28[/C][C]-0.032111[/C][C]-0.3275[/C][C]0.371987[/C][/ROW]
[ROW][C]29[/C][C]-0.03313[/C][C]-0.3379[/C][C]0.368074[/C][/ROW]
[ROW][C]30[/C][C]-0.025976[/C][C]-0.2649[/C][C]0.395803[/C][/ROW]
[ROW][C]31[/C][C]0.042105[/C][C]0.4294[/C][C]0.334265[/C][/ROW]
[ROW][C]32[/C][C]0.009078[/C][C]0.0926[/C][C]0.463208[/C][/ROW]
[ROW][C]33[/C][C]-0.073686[/C][C]-0.7515[/C][C]0.227038[/C][/ROW]
[ROW][C]34[/C][C]0.144221[/C][C]1.4708[/C][C]0.072186[/C][/ROW]
[ROW][C]35[/C][C]-0.024651[/C][C]-0.2514[/C][C]0.401003[/C][/ROW]
[ROW][C]36[/C][C]-0.002584[/C][C]-0.0264[/C][C]0.489513[/C][/ROW]
[ROW][C]37[/C][C]0.024296[/C][C]0.2478[/C][C]0.402402[/C][/ROW]
[ROW][C]38[/C][C]-0.053442[/C][C]-0.545[/C][C]0.293458[/C][/ROW]
[ROW][C]39[/C][C]0.077114[/C][C]0.7864[/C][C]0.216709[/C][/ROW]
[ROW][C]40[/C][C]0.037012[/C][C]0.3774[/C][C]0.353306[/C][/ROW]
[ROW][C]41[/C][C]0.013834[/C][C]0.1411[/C][C]0.44404[/C][/ROW]
[ROW][C]42[/C][C]-0.01379[/C][C]-0.1406[/C][C]0.444218[/C][/ROW]
[ROW][C]43[/C][C]-0.105523[/C][C]-1.0761[/C][C]0.142181[/C][/ROW]
[ROW][C]44[/C][C]-0.011338[/C][C]-0.1156[/C][C]0.454087[/C][/ROW]
[ROW][C]45[/C][C]-0.005754[/C][C]-0.0587[/C][C]0.476659[/C][/ROW]
[ROW][C]46[/C][C]-0.009093[/C][C]-0.0927[/C][C]0.463149[/C][/ROW]
[ROW][C]47[/C][C]0.088696[/C][C]0.9045[/C][C]0.183904[/C][/ROW]
[ROW][C]48[/C][C]-0.240722[/C][C]-2.4549[/C][C]0.007876[/C][/ROW]
[/TABLE]
Source: https://freestatistics.org/blog/index.php?pk=302580&T=2

Globally Unique Identifier (entire table): ba.freestatistics.org/blog/index.php?pk=302580&T=2

As an alternative you can also use a QR Code:  

The GUIDs for individual cells are displayed in the table below:

Partial Autocorrelation Function
Time lag kPACF(k)T-STATP-value
1-0.353582-3.60580.00024
2-0.012841-0.1310.448032
30.0006130.00630.49751
4-0.108059-1.1020.136505
5-0.005054-0.05150.479495
60.01830.18660.426161
70.0738510.75310.226535
8-0.16343-1.66670.049295
90.0916460.93460.176076
100.0670780.68410.247727
110.2714142.76790.00334
12-0.267222-2.72510.003771
13-0.139007-1.41760.079648
14-0.099157-1.01120.157132
15-0.080739-0.82340.206088
16-0.042986-0.43840.331014
170.0527760.53820.295789
180.0628790.64120.261387
19-0.10699-1.09110.138877
20-0.005681-0.05790.476957
21-0.103002-1.05040.147981
22-0.086541-0.88260.189757
230.0803470.81940.207221
24-0.173442-1.76880.039933
250.0377650.38510.350465
26-0.027623-0.28170.389365
270.0407960.4160.339119
28-0.032111-0.32750.371987
29-0.03313-0.33790.368074
30-0.025976-0.26490.395803
310.0421050.42940.334265
320.0090780.09260.463208
33-0.073686-0.75150.227038
340.1442211.47080.072186
35-0.024651-0.25140.401003
36-0.002584-0.02640.489513
370.0242960.24780.402402
38-0.053442-0.5450.293458
390.0771140.78640.216709
400.0370120.37740.353306
410.0138340.14110.44404
42-0.01379-0.14060.444218
43-0.105523-1.07610.142181
44-0.011338-0.11560.454087
45-0.005754-0.05870.476659
46-0.009093-0.09270.463149
470.0886960.90450.183904
48-0.240722-2.45490.007876


Parameters (Session):
par1 = 1 ;
Parameters (R input):
par1 = 48 ; par2 = 2.0 ; par3 = 1 ; par4 = 1 ; par5 = 12 ; par6 = White Noise ; par7 = 0.95 ; par8 = ;
R code (references can be found in the software module):
par8 <- ''
par7 <- '0.95'
par6 <- 'White Noise'
par5 <- '12'
par4 <- '1'
par3 <- '1'
par2 <- '2.0'
par1 <- '60'
if (par1 == 'Default') {
par1 = 10*log10(length(x))
} else {
par1 <- as.numeric(par1)
}
par2 <- as.numeric(par2)
par3 <- as.numeric(par3)
par4 <- as.numeric(par4)
par5 <- as.numeric(par5)
if (par6 == 'White Noise') par6 <- 'white' else par6 <- 'ma'
par7 <- as.numeric(par7)
if (par8 != '') par8 <- as.numeric(par8)
x <- na.omit(x)
ox <- x
if (par8 == '') {
if (par2 == 0) {
x <- log(x)
} else {
x <- (x ^ par2 - 1) / par2
}
} else {
x <- log(x,base=par8)
}
if (par3 > 0) x <- diff(x,lag=1,difference=par3)
if (par4 > 0) x <- diff(x,lag=par5,difference=par4)
bitmap(file='picts.png')
op <- par(mfrow=c(2,1))
plot(ox,type='l',main='Original Time Series',xlab='time',ylab='value')
if (par8=='') {
mytitle <- paste('Working Time Series (lambda=',par2,', d=',par3,', D=',par4,')',sep='')
mysub <- paste('(lambda=',par2,', d=',par3,', D=',par4,', CI=', par7, ', CI type=',par6,')',sep='')
} else {
mytitle <- paste('Working Time Series (base=',par8,', d=',par3,', D=',par4,')',sep='')
mysub <- paste('(base=',par8,', d=',par3,', D=',par4,', CI=', par7, ', CI type=',par6,')',sep='')
}
plot(x,type='l', main=mytitle,xlab='time',ylab='value')
par(op)
dev.off()
bitmap(file='pic1.png')
racf <- acf(x, par1, main='Autocorrelation', xlab='time lag', ylab='ACF', ci.type=par6, ci=par7, sub=mysub)
dev.off()
bitmap(file='pic2.png')
rpacf <- pacf(x,par1,main='Partial Autocorrelation',xlab='lags',ylab='PACF',sub=mysub)
dev.off()
(myacf <- c(racf$acf))
(mypacf <- c(rpacf$acf))
lengthx <- length(x)
sqrtn <- sqrt(lengthx)
load(file='createtable')
a<-table.start()
a<-table.row.start(a)
a<-table.element(a,'Autocorrelation Function',4,TRUE)
a<-table.row.end(a)
a<-table.row.start(a)
a<-table.element(a,'Time lag k',header=TRUE)
a<-table.element(a,'ACF(k)',header=TRUE)
a<-table.element(a,'T-STAT',header=TRUE)
a<-table.element(a,'P-value',header=TRUE)
a<-table.row.end(a)
for (i in 2:(par1+1)) {
a<-table.row.start(a)
a<-table.element(a,i-1,header=TRUE)
a<-table.element(a,round(myacf[i],6))
mytstat <- myacf[i]*sqrtn
a<-table.element(a,round(mytstat,4))
a<-table.element(a,round(1-pt(abs(mytstat),lengthx),6))
a<-table.row.end(a)
}
a<-table.end(a)
table.save(a,file='mytable.tab')
a<-table.start()
a<-table.row.start(a)
a<-table.element(a,'Partial Autocorrelation Function',4,TRUE)
a<-table.row.end(a)
a<-table.row.start(a)
a<-table.element(a,'Time lag k',header=TRUE)
a<-table.element(a,'PACF(k)',header=TRUE)
a<-table.element(a,'T-STAT',header=TRUE)
a<-table.element(a,'P-value',header=TRUE)
a<-table.row.end(a)
for (i in 1:par1) {
a<-table.row.start(a)
a<-table.element(a,i,header=TRUE)
a<-table.element(a,round(mypacf[i],6))
mytstat <- mypacf[i]*sqrtn
a<-table.element(a,round(mytstat,4))
a<-table.element(a,round(1-pt(abs(mytstat),lengthx),6))
a<-table.row.end(a)
}
a<-table.end(a)
table.save(a,file='mytable1.tab')