Free Statistics

of Irreproducible Research!

Author's title

Author*The author of this computation has been verified*
R Software Modulerwasp_arimabackwardselection.wasp
Title produced by softwareARIMA Backward Selection
Date of computationWed, 21 Dec 2016 17:48:11 +0100
Cite this page as followsStatistical Computations at FreeStatistics.org, Office for Research Development and Education, URL https://freestatistics.org/blog/index.php?v=date/2016/Dec/21/t14823401368s1zopb7dlo1bf2.htm/, Retrieved Fri, 01 Nov 2024 03:36:39 +0000
Statistical Computations at FreeStatistics.org, Office for Research Development and Education, URL https://freestatistics.org/blog/index.php?pk=302433, Retrieved Fri, 01 Nov 2024 03:36:39 +0000
QR Codes:

Original text written by user:
IsPrivate?No (this computation is public)
User-defined keywords
Estimated Impact82
Family? (F = Feedback message, R = changed R code, M = changed R Module, P = changed Parameters, D = changed Data)
-       [ARIMA Backward Selection] [ARIMA] [2016-12-21 16:48:11] [06fd994a2f2098873ec640c3e39346e5] [Current]
Feedback Forum

Post a new message
Dataseries X:
4738.4
4687.2
5930.8
5532
5429.8
6107.4
5960.8
5541.8
5362.2
5237
4827
4781.6
4983.2
4718.4
5523.8
5286.6
5389
5810.4
5057.4
5604.4
5285
5215.2
4625.4
4270.4
4685.4
4233.8
5278.4
4978.8
5333.4
5451
5224
5790.2
5079.4
4705.8
4139.6
3720.8
4594
4638.8
4969.4
4764.4
5010.8
5267.8
5312.2
5723.2
4579.6
5015.2
4282.4
3834.2
4523.4
3884.2
3897.8
4845.6
4929
4955.4
5198.4
5122.2
4643.2
4789.8
3950.8
3824.4
4511.8
4262.4
4616.6
5139.6
4972.8
5222
5242
4979.8
4691.8
4821.6
4123.6
4027.4
4365.2
4333.6
4930
5053
5031.4
5342
5191.4
4852.2
4675.6
4689.2
3809.4
4054.2
4409.6
4210.2
4566.4
4907
5021.8
5215.2
4933.6
5197.8
4734.6
4681.8
4172
4037.8
4462.6
4282.6
4962.4
4969.2
5214.6
5416.8
4764.2
5326.2
4545.4
4797.2
4259
4117
4469.2
4203.2
5033.8
4883
5361.6
5044.6
5005.6
5382
4565.4
4825
4290.2
3933.6
4177.6
3949.4
4492.6
4894.2
5224.4
5071


Summary of computational transaction
Raw Input view raw input (R code)
Raw Outputview raw output of R engine
Computing time14 seconds
R ServerBig Analytics Cloud Computing Center

\begin{tabular}{lllllllll}
\hline
Summary of computational transaction \tabularnewline
Raw Input view raw input (R code)  \tabularnewline
Raw Outputview raw output of R engine  \tabularnewline
Computing time14 seconds \tabularnewline
R ServerBig Analytics Cloud Computing Center \tabularnewline
\hline
\end{tabular}
%Source: https://freestatistics.org/blog/index.php?pk=302433&T=0

[TABLE]
[ROW]
Summary of computational transaction[/C][/ROW] [ROW]Raw Input[/C] view raw input (R code) [/C][/ROW] [ROW]Raw Output[/C]view raw output of R engine [/C][/ROW] [ROW]Computing time[/C]14 seconds[/C][/ROW] [ROW]R Server[/C]Big Analytics Cloud Computing Center[/C][/ROW] [/TABLE] Source: https://freestatistics.org/blog/index.php?pk=302433&T=0

Globally Unique Identifier (entire table): ba.freestatistics.org/blog/index.php?pk=302433&T=0

As an alternative you can also use a QR Code:  

The GUIDs for individual cells are displayed in the table below:

Summary of computational transaction
Raw Input view raw input (R code)
Raw Outputview raw output of R engine
Computing time14 seconds
R ServerBig Analytics Cloud Computing Center


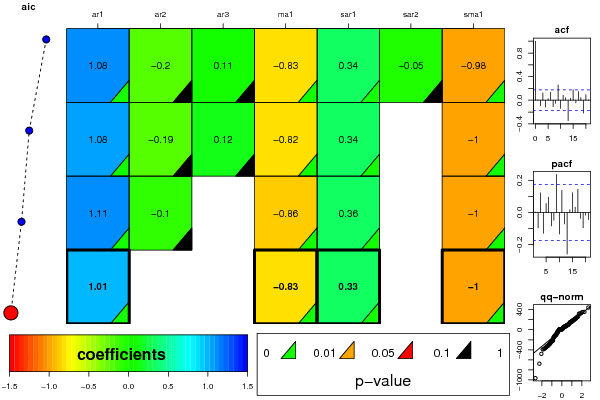
ARIMA Parameter Estimation and Backward Selection
Iterationar1ar2ar3ma1sar1sar2sma1
Estimates ( 1 )1.081-0.19560.1145-0.82990.3443-0.0475-0.9836
(p-val)(0 )(0.1742 )(0.3071 )(0 )(0.0038 )(0.6856 )(0 )
Estimates ( 2 )1.0759-0.18620.1201-0.82270.34120-1.0004
(p-val)(0 )(0.1867 )(0.2903 )(0 )(0.0038 )(NA )(0 )
Estimates ( 3 )1.112-0.10440-0.86330.35840-1.0001
(p-val)(0 )(0.3711 )(NA )(0 )(0.0024 )(NA )(0 )
Estimates ( 4 )1.008800-0.83470.32720-1
(p-val)(0 )(NA )(NA )(0 )(0.0035 )(NA )(0 )
Estimates ( 5 )NANANANANANANA
(p-val)(NA )(NA )(NA )(NA )(NA )(NA )(NA )
Estimates ( 6 )NANANANANANANA
(p-val)(NA )(NA )(NA )(NA )(NA )(NA )(NA )
Estimates ( 7 )NANANANANANANA
(p-val)(NA )(NA )(NA )(NA )(NA )(NA )(NA )
Estimates ( 8 )NANANANANANANA
(p-val)(NA )(NA )(NA )(NA )(NA )(NA )(NA )
Estimates ( 9 )NANANANANANANA
(p-val)(NA )(NA )(NA )(NA )(NA )(NA )(NA )
Estimates ( 10 )NANANANANANANA
(p-val)(NA )(NA )(NA )(NA )(NA )(NA )(NA )
Estimates ( 11 )NANANANANANANA
(p-val)(NA )(NA )(NA )(NA )(NA )(NA )(NA )
Estimates ( 12 )NANANANANANANA
(p-val)(NA )(NA )(NA )(NA )(NA )(NA )(NA )
Estimates ( 13 )NANANANANANANA
(p-val)(NA )(NA )(NA )(NA )(NA )(NA )(NA )

\begin{tabular}{lllllllll}
\hline
ARIMA Parameter Estimation and Backward Selection \tabularnewline
Iteration & ar1 & ar2 & ar3 & ma1 & sar1 & sar2 & sma1 \tabularnewline
Estimates ( 1 ) & 1.081 & -0.1956 & 0.1145 & -0.8299 & 0.3443 & -0.0475 & -0.9836 \tabularnewline
(p-val) & (0 ) & (0.1742 ) & (0.3071 ) & (0 ) & (0.0038 ) & (0.6856 ) & (0 ) \tabularnewline
Estimates ( 2 ) & 1.0759 & -0.1862 & 0.1201 & -0.8227 & 0.3412 & 0 & -1.0004 \tabularnewline
(p-val) & (0 ) & (0.1867 ) & (0.2903 ) & (0 ) & (0.0038 ) & (NA ) & (0 ) \tabularnewline
Estimates ( 3 ) & 1.112 & -0.1044 & 0 & -0.8633 & 0.3584 & 0 & -1.0001 \tabularnewline
(p-val) & (0 ) & (0.3711 ) & (NA ) & (0 ) & (0.0024 ) & (NA ) & (0 ) \tabularnewline
Estimates ( 4 ) & 1.0088 & 0 & 0 & -0.8347 & 0.3272 & 0 & -1 \tabularnewline
(p-val) & (0 ) & (NA ) & (NA ) & (0 ) & (0.0035 ) & (NA ) & (0 ) \tabularnewline
Estimates ( 5 ) & NA & NA & NA & NA & NA & NA & NA \tabularnewline
(p-val) & (NA ) & (NA ) & (NA ) & (NA ) & (NA ) & (NA ) & (NA ) \tabularnewline
Estimates ( 6 ) & NA & NA & NA & NA & NA & NA & NA \tabularnewline
(p-val) & (NA ) & (NA ) & (NA ) & (NA ) & (NA ) & (NA ) & (NA ) \tabularnewline
Estimates ( 7 ) & NA & NA & NA & NA & NA & NA & NA \tabularnewline
(p-val) & (NA ) & (NA ) & (NA ) & (NA ) & (NA ) & (NA ) & (NA ) \tabularnewline
Estimates ( 8 ) & NA & NA & NA & NA & NA & NA & NA \tabularnewline
(p-val) & (NA ) & (NA ) & (NA ) & (NA ) & (NA ) & (NA ) & (NA ) \tabularnewline
Estimates ( 9 ) & NA & NA & NA & NA & NA & NA & NA \tabularnewline
(p-val) & (NA ) & (NA ) & (NA ) & (NA ) & (NA ) & (NA ) & (NA ) \tabularnewline
Estimates ( 10 ) & NA & NA & NA & NA & NA & NA & NA \tabularnewline
(p-val) & (NA ) & (NA ) & (NA ) & (NA ) & (NA ) & (NA ) & (NA ) \tabularnewline
Estimates ( 11 ) & NA & NA & NA & NA & NA & NA & NA \tabularnewline
(p-val) & (NA ) & (NA ) & (NA ) & (NA ) & (NA ) & (NA ) & (NA ) \tabularnewline
Estimates ( 12 ) & NA & NA & NA & NA & NA & NA & NA \tabularnewline
(p-val) & (NA ) & (NA ) & (NA ) & (NA ) & (NA ) & (NA ) & (NA ) \tabularnewline
Estimates ( 13 ) & NA & NA & NA & NA & NA & NA & NA \tabularnewline
(p-val) & (NA ) & (NA ) & (NA ) & (NA ) & (NA ) & (NA ) & (NA ) \tabularnewline
\hline
\end{tabular}
%Source: https://freestatistics.org/blog/index.php?pk=302433&T=1

[TABLE]
[ROW][C]ARIMA Parameter Estimation and Backward Selection[/C][/ROW]
[ROW][C]Iteration[/C][C]ar1[/C][C]ar2[/C][C]ar3[/C][C]ma1[/C][C]sar1[/C][C]sar2[/C][C]sma1[/C][/ROW]
[ROW][C]Estimates ( 1 )[/C][C]1.081[/C][C]-0.1956[/C][C]0.1145[/C][C]-0.8299[/C][C]0.3443[/C][C]-0.0475[/C][C]-0.9836[/C][/ROW]
[ROW][C](p-val)[/C][C](0 )[/C][C](0.1742 )[/C][C](0.3071 )[/C][C](0 )[/C][C](0.0038 )[/C][C](0.6856 )[/C][C](0 )[/C][/ROW]
[ROW][C]Estimates ( 2 )[/C][C]1.0759[/C][C]-0.1862[/C][C]0.1201[/C][C]-0.8227[/C][C]0.3412[/C][C]0[/C][C]-1.0004[/C][/ROW]
[ROW][C](p-val)[/C][C](0 )[/C][C](0.1867 )[/C][C](0.2903 )[/C][C](0 )[/C][C](0.0038 )[/C][C](NA )[/C][C](0 )[/C][/ROW]
[ROW][C]Estimates ( 3 )[/C][C]1.112[/C][C]-0.1044[/C][C]0[/C][C]-0.8633[/C][C]0.3584[/C][C]0[/C][C]-1.0001[/C][/ROW]
[ROW][C](p-val)[/C][C](0 )[/C][C](0.3711 )[/C][C](NA )[/C][C](0 )[/C][C](0.0024 )[/C][C](NA )[/C][C](0 )[/C][/ROW]
[ROW][C]Estimates ( 4 )[/C][C]1.0088[/C][C]0[/C][C]0[/C][C]-0.8347[/C][C]0.3272[/C][C]0[/C][C]-1[/C][/ROW]
[ROW][C](p-val)[/C][C](0 )[/C][C](NA )[/C][C](NA )[/C][C](0 )[/C][C](0.0035 )[/C][C](NA )[/C][C](0 )[/C][/ROW]
[ROW][C]Estimates ( 5 )[/C][C]NA[/C][C]NA[/C][C]NA[/C][C]NA[/C][C]NA[/C][C]NA[/C][C]NA[/C][/ROW]
[ROW][C](p-val)[/C][C](NA )[/C][C](NA )[/C][C](NA )[/C][C](NA )[/C][C](NA )[/C][C](NA )[/C][C](NA )[/C][/ROW]
[ROW][C]Estimates ( 6 )[/C][C]NA[/C][C]NA[/C][C]NA[/C][C]NA[/C][C]NA[/C][C]NA[/C][C]NA[/C][/ROW]
[ROW][C](p-val)[/C][C](NA )[/C][C](NA )[/C][C](NA )[/C][C](NA )[/C][C](NA )[/C][C](NA )[/C][C](NA )[/C][/ROW]
[ROW][C]Estimates ( 7 )[/C][C]NA[/C][C]NA[/C][C]NA[/C][C]NA[/C][C]NA[/C][C]NA[/C][C]NA[/C][/ROW]
[ROW][C](p-val)[/C][C](NA )[/C][C](NA )[/C][C](NA )[/C][C](NA )[/C][C](NA )[/C][C](NA )[/C][C](NA )[/C][/ROW]
[ROW][C]Estimates ( 8 )[/C][C]NA[/C][C]NA[/C][C]NA[/C][C]NA[/C][C]NA[/C][C]NA[/C][C]NA[/C][/ROW]
[ROW][C](p-val)[/C][C](NA )[/C][C](NA )[/C][C](NA )[/C][C](NA )[/C][C](NA )[/C][C](NA )[/C][C](NA )[/C][/ROW]
[ROW][C]Estimates ( 9 )[/C][C]NA[/C][C]NA[/C][C]NA[/C][C]NA[/C][C]NA[/C][C]NA[/C][C]NA[/C][/ROW]
[ROW][C](p-val)[/C][C](NA )[/C][C](NA )[/C][C](NA )[/C][C](NA )[/C][C](NA )[/C][C](NA )[/C][C](NA )[/C][/ROW]
[ROW][C]Estimates ( 10 )[/C][C]NA[/C][C]NA[/C][C]NA[/C][C]NA[/C][C]NA[/C][C]NA[/C][C]NA[/C][/ROW]
[ROW][C](p-val)[/C][C](NA )[/C][C](NA )[/C][C](NA )[/C][C](NA )[/C][C](NA )[/C][C](NA )[/C][C](NA )[/C][/ROW]
[ROW][C]Estimates ( 11 )[/C][C]NA[/C][C]NA[/C][C]NA[/C][C]NA[/C][C]NA[/C][C]NA[/C][C]NA[/C][/ROW]
[ROW][C](p-val)[/C][C](NA )[/C][C](NA )[/C][C](NA )[/C][C](NA )[/C][C](NA )[/C][C](NA )[/C][C](NA )[/C][/ROW]
[ROW][C]Estimates ( 12 )[/C][C]NA[/C][C]NA[/C][C]NA[/C][C]NA[/C][C]NA[/C][C]NA[/C][C]NA[/C][/ROW]
[ROW][C](p-val)[/C][C](NA )[/C][C](NA )[/C][C](NA )[/C][C](NA )[/C][C](NA )[/C][C](NA )[/C][C](NA )[/C][/ROW]
[ROW][C]Estimates ( 13 )[/C][C]NA[/C][C]NA[/C][C]NA[/C][C]NA[/C][C]NA[/C][C]NA[/C][C]NA[/C][/ROW]
[ROW][C](p-val)[/C][C](NA )[/C][C](NA )[/C][C](NA )[/C][C](NA )[/C][C](NA )[/C][C](NA )[/C][C](NA )[/C][/ROW]
[/TABLE]
Source: https://freestatistics.org/blog/index.php?pk=302433&T=1

Globally Unique Identifier (entire table): ba.freestatistics.org/blog/index.php?pk=302433&T=1

As an alternative you can also use a QR Code:  

The GUIDs for individual cells are displayed in the table below:

ARIMA Parameter Estimation and Backward Selection
Iterationar1ar2ar3ma1sar1sar2sma1
Estimates ( 1 )1.081-0.19560.1145-0.82990.3443-0.0475-0.9836
(p-val)(0 )(0.1742 )(0.3071 )(0 )(0.0038 )(0.6856 )(0 )
Estimates ( 2 )1.0759-0.18620.1201-0.82270.34120-1.0004
(p-val)(0 )(0.1867 )(0.2903 )(0 )(0.0038 )(NA )(0 )
Estimates ( 3 )1.112-0.10440-0.86330.35840-1.0001
(p-val)(0 )(0.3711 )(NA )(0 )(0.0024 )(NA )(0 )
Estimates ( 4 )1.008800-0.83470.32720-1
(p-val)(0 )(NA )(NA )(0 )(0.0035 )(NA )(0 )
Estimates ( 5 )NANANANANANANA
(p-val)(NA )(NA )(NA )(NA )(NA )(NA )(NA )
Estimates ( 6 )NANANANANANANA
(p-val)(NA )(NA )(NA )(NA )(NA )(NA )(NA )
Estimates ( 7 )NANANANANANANA
(p-val)(NA )(NA )(NA )(NA )(NA )(NA )(NA )
Estimates ( 8 )NANANANANANANA
(p-val)(NA )(NA )(NA )(NA )(NA )(NA )(NA )
Estimates ( 9 )NANANANANANANA
(p-val)(NA )(NA )(NA )(NA )(NA )(NA )(NA )
Estimates ( 10 )NANANANANANANA
(p-val)(NA )(NA )(NA )(NA )(NA )(NA )(NA )
Estimates ( 11 )NANANANANANANA
(p-val)(NA )(NA )(NA )(NA )(NA )(NA )(NA )
Estimates ( 12 )NANANANANANANA
(p-val)(NA )(NA )(NA )(NA )(NA )(NA )(NA )
Estimates ( 13 )NANANANANANANA
(p-val)(NA )(NA )(NA )(NA )(NA )(NA )(NA )


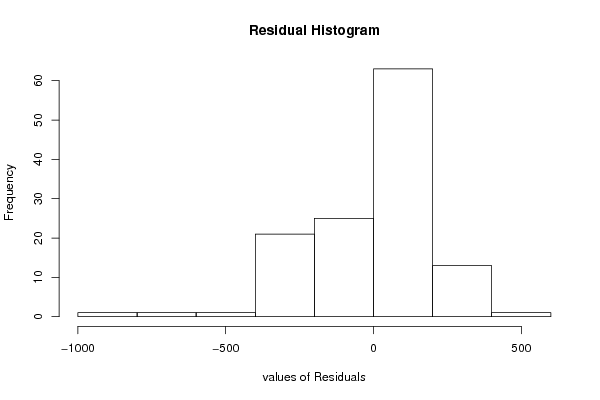
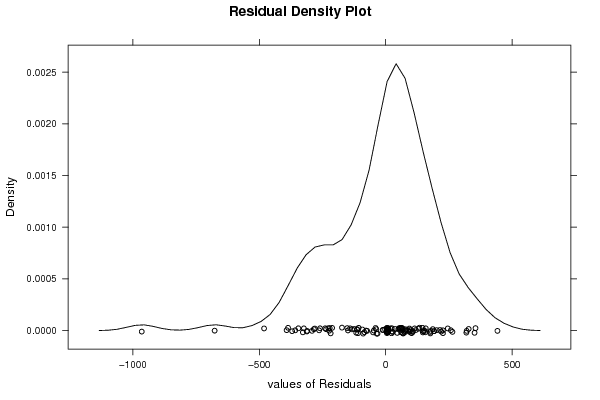
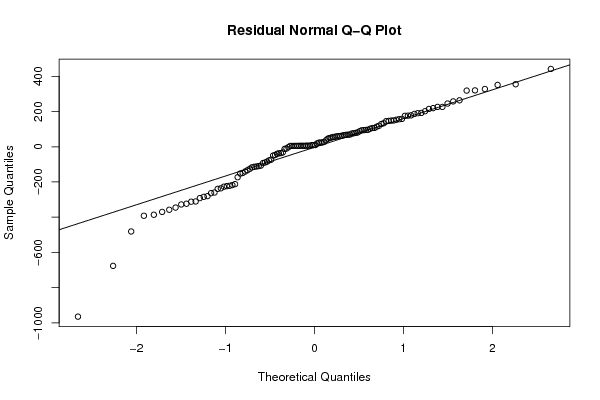
Estimated ARIMA Residuals
Value
4.78158056604832
192.03825237457
-32.3274605513359
-369.966217797111
-149.238021677368
24.6589808788798
-211.961508486676
-676.472765557038
257.700448966883
23.1814393226343
75.0513678460274
-92.4154845289943
-323.561573138441
-12.0102874222502
-263.328221394865
-124.987345512776
-133.279163424819
158.255719957431
-235.765561491076
114.170739324783
355.01791440446
-107.12721149158
-312.075851217225
-284.260066228118
-391.86305802157
190.414895340481
441.841231267578
-310.50605263811
-109.688939643367
-73.4381726107403
-113.637572843405
201.817831833201
219.301633077924
-386.086352733721
351.311913559605
55.4834190336459
-49.9807935279933
61.1728499013369
-480.978246005446
-964.6844851172
327.899444580482
81.5646745886439
-217.679437616054
175.831757881519
-221.515026303172
129.404666648597
63.3839314292516
-140.681164430862
106.656574756807
214.587878396073
318.874658326412
178.402380055439
320.159584016137
9.10209793251434
69.2011767872359
67.5939322408061
-239.126342681906
23.7779940724682
66.1112575254712
52.4565747804609
145.208046550598
-89.2508959151866
146.721904795484
148.501640342146
27.6596350362937
36.6581077950189
45.4497182565856
-37.2266613489062
-291.333375109292
-10.1217010390794
-77.2609563730956
-280.300896912791
176.407967218594
68.4692284298039
9.76741484778436
-259.758303928471
59.4747898266229
107.124584915553
-35.9170540766762
-152.283722349281
245.529046200536
56.2290008070265
-2.73292655277744
226.324947474456
49.6425600803458
78.670792253577
94.2199711055384
226.350238021884
19.0461007403673
186.353663582245
88.3006333809871
-345.277578553101
149.466768300876
-223.640307601433
95.4919964388121
102.169327120949
96.1772292580707
9.72789433691768
-46.9061554211232
133.411086424599
-84.3886713618972
263.781517815939
-357.754002684631
76.5633575570246
119.035238882088
-112.105884525529
60.4401716972745
93.5350825770849
-116.608177124393
-226.821751218069
-173.016921805429
-327.704043546122
153.339291495125
156.312135786669
-40.1353437087709

\begin{tabular}{lllllllll}
\hline
Estimated ARIMA Residuals \tabularnewline
Value \tabularnewline
4.78158056604832 \tabularnewline
192.03825237457 \tabularnewline
-32.3274605513359 \tabularnewline
-369.966217797111 \tabularnewline
-149.238021677368 \tabularnewline
24.6589808788798 \tabularnewline
-211.961508486676 \tabularnewline
-676.472765557038 \tabularnewline
257.700448966883 \tabularnewline
23.1814393226343 \tabularnewline
75.0513678460274 \tabularnewline
-92.4154845289943 \tabularnewline
-323.561573138441 \tabularnewline
-12.0102874222502 \tabularnewline
-263.328221394865 \tabularnewline
-124.987345512776 \tabularnewline
-133.279163424819 \tabularnewline
158.255719957431 \tabularnewline
-235.765561491076 \tabularnewline
114.170739324783 \tabularnewline
355.01791440446 \tabularnewline
-107.12721149158 \tabularnewline
-312.075851217225 \tabularnewline
-284.260066228118 \tabularnewline
-391.86305802157 \tabularnewline
190.414895340481 \tabularnewline
441.841231267578 \tabularnewline
-310.50605263811 \tabularnewline
-109.688939643367 \tabularnewline
-73.4381726107403 \tabularnewline
-113.637572843405 \tabularnewline
201.817831833201 \tabularnewline
219.301633077924 \tabularnewline
-386.086352733721 \tabularnewline
351.311913559605 \tabularnewline
55.4834190336459 \tabularnewline
-49.9807935279933 \tabularnewline
61.1728499013369 \tabularnewline
-480.978246005446 \tabularnewline
-964.6844851172 \tabularnewline
327.899444580482 \tabularnewline
81.5646745886439 \tabularnewline
-217.679437616054 \tabularnewline
175.831757881519 \tabularnewline
-221.515026303172 \tabularnewline
129.404666648597 \tabularnewline
63.3839314292516 \tabularnewline
-140.681164430862 \tabularnewline
106.656574756807 \tabularnewline
214.587878396073 \tabularnewline
318.874658326412 \tabularnewline
178.402380055439 \tabularnewline
320.159584016137 \tabularnewline
9.10209793251434 \tabularnewline
69.2011767872359 \tabularnewline
67.5939322408061 \tabularnewline
-239.126342681906 \tabularnewline
23.7779940724682 \tabularnewline
66.1112575254712 \tabularnewline
52.4565747804609 \tabularnewline
145.208046550598 \tabularnewline
-89.2508959151866 \tabularnewline
146.721904795484 \tabularnewline
148.501640342146 \tabularnewline
27.6596350362937 \tabularnewline
36.6581077950189 \tabularnewline
45.4497182565856 \tabularnewline
-37.2266613489062 \tabularnewline
-291.333375109292 \tabularnewline
-10.1217010390794 \tabularnewline
-77.2609563730956 \tabularnewline
-280.300896912791 \tabularnewline
176.407967218594 \tabularnewline
68.4692284298039 \tabularnewline
9.76741484778436 \tabularnewline
-259.758303928471 \tabularnewline
59.4747898266229 \tabularnewline
107.124584915553 \tabularnewline
-35.9170540766762 \tabularnewline
-152.283722349281 \tabularnewline
245.529046200536 \tabularnewline
56.2290008070265 \tabularnewline
-2.73292655277744 \tabularnewline
226.324947474456 \tabularnewline
49.6425600803458 \tabularnewline
78.670792253577 \tabularnewline
94.2199711055384 \tabularnewline
226.350238021884 \tabularnewline
19.0461007403673 \tabularnewline
186.353663582245 \tabularnewline
88.3006333809871 \tabularnewline
-345.277578553101 \tabularnewline
149.466768300876 \tabularnewline
-223.640307601433 \tabularnewline
95.4919964388121 \tabularnewline
102.169327120949 \tabularnewline
96.1772292580707 \tabularnewline
9.72789433691768 \tabularnewline
-46.9061554211232 \tabularnewline
133.411086424599 \tabularnewline
-84.3886713618972 \tabularnewline
263.781517815939 \tabularnewline
-357.754002684631 \tabularnewline
76.5633575570246 \tabularnewline
119.035238882088 \tabularnewline
-112.105884525529 \tabularnewline
60.4401716972745 \tabularnewline
93.5350825770849 \tabularnewline
-116.608177124393 \tabularnewline
-226.821751218069 \tabularnewline
-173.016921805429 \tabularnewline
-327.704043546122 \tabularnewline
153.339291495125 \tabularnewline
156.312135786669 \tabularnewline
-40.1353437087709 \tabularnewline
\hline
\end{tabular}
%Source: https://freestatistics.org/blog/index.php?pk=302433&T=2

[TABLE]
[ROW][C]Estimated ARIMA Residuals[/C][/ROW]
[ROW][C]Value[/C][/ROW]
[ROW][C]4.78158056604832[/C][/ROW]
[ROW][C]192.03825237457[/C][/ROW]
[ROW][C]-32.3274605513359[/C][/ROW]
[ROW][C]-369.966217797111[/C][/ROW]
[ROW][C]-149.238021677368[/C][/ROW]
[ROW][C]24.6589808788798[/C][/ROW]
[ROW][C]-211.961508486676[/C][/ROW]
[ROW][C]-676.472765557038[/C][/ROW]
[ROW][C]257.700448966883[/C][/ROW]
[ROW][C]23.1814393226343[/C][/ROW]
[ROW][C]75.0513678460274[/C][/ROW]
[ROW][C]-92.4154845289943[/C][/ROW]
[ROW][C]-323.561573138441[/C][/ROW]
[ROW][C]-12.0102874222502[/C][/ROW]
[ROW][C]-263.328221394865[/C][/ROW]
[ROW][C]-124.987345512776[/C][/ROW]
[ROW][C]-133.279163424819[/C][/ROW]
[ROW][C]158.255719957431[/C][/ROW]
[ROW][C]-235.765561491076[/C][/ROW]
[ROW][C]114.170739324783[/C][/ROW]
[ROW][C]355.01791440446[/C][/ROW]
[ROW][C]-107.12721149158[/C][/ROW]
[ROW][C]-312.075851217225[/C][/ROW]
[ROW][C]-284.260066228118[/C][/ROW]
[ROW][C]-391.86305802157[/C][/ROW]
[ROW][C]190.414895340481[/C][/ROW]
[ROW][C]441.841231267578[/C][/ROW]
[ROW][C]-310.50605263811[/C][/ROW]
[ROW][C]-109.688939643367[/C][/ROW]
[ROW][C]-73.4381726107403[/C][/ROW]
[ROW][C]-113.637572843405[/C][/ROW]
[ROW][C]201.817831833201[/C][/ROW]
[ROW][C]219.301633077924[/C][/ROW]
[ROW][C]-386.086352733721[/C][/ROW]
[ROW][C]351.311913559605[/C][/ROW]
[ROW][C]55.4834190336459[/C][/ROW]
[ROW][C]-49.9807935279933[/C][/ROW]
[ROW][C]61.1728499013369[/C][/ROW]
[ROW][C]-480.978246005446[/C][/ROW]
[ROW][C]-964.6844851172[/C][/ROW]
[ROW][C]327.899444580482[/C][/ROW]
[ROW][C]81.5646745886439[/C][/ROW]
[ROW][C]-217.679437616054[/C][/ROW]
[ROW][C]175.831757881519[/C][/ROW]
[ROW][C]-221.515026303172[/C][/ROW]
[ROW][C]129.404666648597[/C][/ROW]
[ROW][C]63.3839314292516[/C][/ROW]
[ROW][C]-140.681164430862[/C][/ROW]
[ROW][C]106.656574756807[/C][/ROW]
[ROW][C]214.587878396073[/C][/ROW]
[ROW][C]318.874658326412[/C][/ROW]
[ROW][C]178.402380055439[/C][/ROW]
[ROW][C]320.159584016137[/C][/ROW]
[ROW][C]9.10209793251434[/C][/ROW]
[ROW][C]69.2011767872359[/C][/ROW]
[ROW][C]67.5939322408061[/C][/ROW]
[ROW][C]-239.126342681906[/C][/ROW]
[ROW][C]23.7779940724682[/C][/ROW]
[ROW][C]66.1112575254712[/C][/ROW]
[ROW][C]52.4565747804609[/C][/ROW]
[ROW][C]145.208046550598[/C][/ROW]
[ROW][C]-89.2508959151866[/C][/ROW]
[ROW][C]146.721904795484[/C][/ROW]
[ROW][C]148.501640342146[/C][/ROW]
[ROW][C]27.6596350362937[/C][/ROW]
[ROW][C]36.6581077950189[/C][/ROW]
[ROW][C]45.4497182565856[/C][/ROW]
[ROW][C]-37.2266613489062[/C][/ROW]
[ROW][C]-291.333375109292[/C][/ROW]
[ROW][C]-10.1217010390794[/C][/ROW]
[ROW][C]-77.2609563730956[/C][/ROW]
[ROW][C]-280.300896912791[/C][/ROW]
[ROW][C]176.407967218594[/C][/ROW]
[ROW][C]68.4692284298039[/C][/ROW]
[ROW][C]9.76741484778436[/C][/ROW]
[ROW][C]-259.758303928471[/C][/ROW]
[ROW][C]59.4747898266229[/C][/ROW]
[ROW][C]107.124584915553[/C][/ROW]
[ROW][C]-35.9170540766762[/C][/ROW]
[ROW][C]-152.283722349281[/C][/ROW]
[ROW][C]245.529046200536[/C][/ROW]
[ROW][C]56.2290008070265[/C][/ROW]
[ROW][C]-2.73292655277744[/C][/ROW]
[ROW][C]226.324947474456[/C][/ROW]
[ROW][C]49.6425600803458[/C][/ROW]
[ROW][C]78.670792253577[/C][/ROW]
[ROW][C]94.2199711055384[/C][/ROW]
[ROW][C]226.350238021884[/C][/ROW]
[ROW][C]19.0461007403673[/C][/ROW]
[ROW][C]186.353663582245[/C][/ROW]
[ROW][C]88.3006333809871[/C][/ROW]
[ROW][C]-345.277578553101[/C][/ROW]
[ROW][C]149.466768300876[/C][/ROW]
[ROW][C]-223.640307601433[/C][/ROW]
[ROW][C]95.4919964388121[/C][/ROW]
[ROW][C]102.169327120949[/C][/ROW]
[ROW][C]96.1772292580707[/C][/ROW]
[ROW][C]9.72789433691768[/C][/ROW]
[ROW][C]-46.9061554211232[/C][/ROW]
[ROW][C]133.411086424599[/C][/ROW]
[ROW][C]-84.3886713618972[/C][/ROW]
[ROW][C]263.781517815939[/C][/ROW]
[ROW][C]-357.754002684631[/C][/ROW]
[ROW][C]76.5633575570246[/C][/ROW]
[ROW][C]119.035238882088[/C][/ROW]
[ROW][C]-112.105884525529[/C][/ROW]
[ROW][C]60.4401716972745[/C][/ROW]
[ROW][C]93.5350825770849[/C][/ROW]
[ROW][C]-116.608177124393[/C][/ROW]
[ROW][C]-226.821751218069[/C][/ROW]
[ROW][C]-173.016921805429[/C][/ROW]
[ROW][C]-327.704043546122[/C][/ROW]
[ROW][C]153.339291495125[/C][/ROW]
[ROW][C]156.312135786669[/C][/ROW]
[ROW][C]-40.1353437087709[/C][/ROW]
[/TABLE]
Source: https://freestatistics.org/blog/index.php?pk=302433&T=2

Globally Unique Identifier (entire table): ba.freestatistics.org/blog/index.php?pk=302433&T=2

As an alternative you can also use a QR Code:  

The GUIDs for individual cells are displayed in the table below:

Estimated ARIMA Residuals
Value
4.78158056604832
192.03825237457
-32.3274605513359
-369.966217797111
-149.238021677368
24.6589808788798
-211.961508486676
-676.472765557038
257.700448966883
23.1814393226343
75.0513678460274
-92.4154845289943
-323.561573138441
-12.0102874222502
-263.328221394865
-124.987345512776
-133.279163424819
158.255719957431
-235.765561491076
114.170739324783
355.01791440446
-107.12721149158
-312.075851217225
-284.260066228118
-391.86305802157
190.414895340481
441.841231267578
-310.50605263811
-109.688939643367
-73.4381726107403
-113.637572843405
201.817831833201
219.301633077924
-386.086352733721
351.311913559605
55.4834190336459
-49.9807935279933
61.1728499013369
-480.978246005446
-964.6844851172
327.899444580482
81.5646745886439
-217.679437616054
175.831757881519
-221.515026303172
129.404666648597
63.3839314292516
-140.681164430862
106.656574756807
214.587878396073
318.874658326412
178.402380055439
320.159584016137
9.10209793251434
69.2011767872359
67.5939322408061
-239.126342681906
23.7779940724682
66.1112575254712
52.4565747804609
145.208046550598
-89.2508959151866
146.721904795484
148.501640342146
27.6596350362937
36.6581077950189
45.4497182565856
-37.2266613489062
-291.333375109292
-10.1217010390794
-77.2609563730956
-280.300896912791
176.407967218594
68.4692284298039
9.76741484778436
-259.758303928471
59.4747898266229
107.124584915553
-35.9170540766762
-152.283722349281
245.529046200536
56.2290008070265
-2.73292655277744
226.324947474456
49.6425600803458
78.670792253577
94.2199711055384
226.350238021884
19.0461007403673
186.353663582245
88.3006333809871
-345.277578553101
149.466768300876
-223.640307601433
95.4919964388121
102.169327120949
96.1772292580707
9.72789433691768
-46.9061554211232
133.411086424599
-84.3886713618972
263.781517815939
-357.754002684631
76.5633575570246
119.035238882088
-112.105884525529
60.4401716972745
93.5350825770849
-116.608177124393
-226.821751218069
-173.016921805429
-327.704043546122
153.339291495125
156.312135786669
-40.1353437087709


Parameters (Session):
Parameters (R input):
par1 = TRUE ; par2 = 1 ; par3 = 0 ; par4 = 1 ; par5 = 12 ; par6 = 3 ; par7 = 1 ; par8 = 2 ; par9 = 1 ;
R code (references can be found in the software module):
par9 <- '1'
par8 <- '2'
par7 <- '1'
par6 <- '3'
par5 <- '12'
par4 <- '1'
par3 <- '0'
par2 <- '1'
par1 <- 'FALSE'
library(lattice)
if (par1 == 'TRUE') par1 <- TRUE
if (par1 == 'FALSE') par1 <- FALSE
par2 <- as.numeric(par2) #Box-Cox lambda transformation parameter
par3 <- as.numeric(par3) #degree of non-seasonal differencing
par4 <- as.numeric(par4) #degree of seasonal differencing
par5 <- as.numeric(par5) #seasonal period
par6 <- as.numeric(par6) #degree (p) of the non-seasonal AR(p) polynomial
par7 <- as.numeric(par7) #degree (q) of the non-seasonal MA(q) polynomial
par8 <- as.numeric(par8) #degree (P) of the seasonal AR(P) polynomial
par9 <- as.numeric(par9) #degree (Q) of the seasonal MA(Q) polynomial
armaGR <- function(arima.out, names, n){
try1 <- arima.out$coef
try2 <- sqrt(diag(arima.out$var.coef))
try.data.frame <- data.frame(matrix(NA,ncol=4,nrow=length(names)))
dimnames(try.data.frame) <- list(names,c('coef','std','tstat','pv'))
try.data.frame[,1] <- try1
for(i in 1:length(try2)) try.data.frame[which(rownames(try.data.frame)==names(try2)[i]),2] <- try2[i]
try.data.frame[,3] <- try.data.frame[,1] / try.data.frame[,2]
try.data.frame[,4] <- round((1-pt(abs(try.data.frame[,3]),df=n-(length(try2)+1)))*2,5)
vector <- rep(NA,length(names))
vector[is.na(try.data.frame[,4])] <- 0
maxi <- which.max(try.data.frame[,4])
continue <- max(try.data.frame[,4],na.rm=TRUE) > .05
vector[maxi] <- 0
list(summary=try.data.frame,next.vector=vector,continue=continue)
}
arimaSelect <- function(series, order=c(13,0,0), seasonal=list(order=c(2,0,0),period=12), include.mean=F){
nrc <- order[1]+order[3]+seasonal$order[1]+seasonal$order[3]
coeff <- matrix(NA, nrow=nrc*2, ncol=nrc)
pval <- matrix(NA, nrow=nrc*2, ncol=nrc)
mylist <- rep(list(NULL), nrc)
names <- NULL
if(order[1] > 0) names <- paste('ar',1:order[1],sep='')
if(order[3] > 0) names <- c( names , paste('ma',1:order[3],sep='') )
if(seasonal$order[1] > 0) names <- c(names, paste('sar',1:seasonal$order[1],sep=''))
if(seasonal$order[3] > 0) names <- c(names, paste('sma',1:seasonal$order[3],sep=''))
arima.out <- arima(series, order=order, seasonal=seasonal, include.mean=include.mean, method='ML')
mylist[[1]] <- arima.out
last.arma <- armaGR(arima.out, names, length(series))
mystop <- FALSE
i <- 1
coeff[i,] <- last.arma[[1]][,1]
pval [i,] <- last.arma[[1]][,4]
i <- 2
aic <- arima.out$aic
while(!mystop){
mylist[[i]] <- arima.out
arima.out <- arima(series, order=order, seasonal=seasonal, include.mean=include.mean, method='ML', fixed=last.arma$next.vector)
aic <- c(aic, arima.out$aic)
last.arma <- armaGR(arima.out, names, length(series))
mystop <- !last.arma$continue
coeff[i,] <- last.arma[[1]][,1]
pval [i,] <- last.arma[[1]][,4]
i <- i+1
}
list(coeff, pval, mylist, aic=aic)
}
arimaSelectplot <- function(arimaSelect.out,noms,choix){
noms <- names(arimaSelect.out[[3]][[1]]$coef)
coeff <- arimaSelect.out[[1]]
k <- min(which(is.na(coeff[,1])))-1
coeff <- coeff[1:k,]
pval <- arimaSelect.out[[2]][1:k,]
aic <- arimaSelect.out$aic[1:k]
coeff[coeff==0] <- NA
n <- ncol(coeff)
if(missing(choix)) choix <- k
layout(matrix(c(1,1,1,2,
3,3,3,2,
3,3,3,4,
5,6,7,7),nr=4),
widths=c(10,35,45,15),
heights=c(30,30,15,15))
couleurs <- rainbow(75)[1:50]#(50)
ticks <- pretty(coeff)
par(mar=c(1,1,3,1))
plot(aic,k:1-.5,type='o',pch=21,bg='blue',cex=2,axes=F,lty=2,xpd=NA)
points(aic[choix],k-choix+.5,pch=21,cex=4,bg=2,xpd=NA)
title('aic',line=2)
par(mar=c(3,0,0,0))
plot(0,axes=F,xlab='',ylab='',xlim=range(ticks),ylim=c(.1,1))
rect(xleft = min(ticks) + (0:49)/50*(max(ticks)-min(ticks)),
xright = min(ticks) + (1:50)/50*(max(ticks)-min(ticks)),
ytop = rep(1,50),
ybottom= rep(0,50),col=couleurs,border=NA)
axis(1,ticks)
rect(xleft=min(ticks),xright=max(ticks),ytop=1,ybottom=0)
text(mean(coeff,na.rm=T),.5,'coefficients',cex=2,font=2)
par(mar=c(1,1,3,1))
image(1:n,1:k,t(coeff[k:1,]),axes=F,col=couleurs,zlim=range(ticks))
for(i in 1:n) for(j in 1:k) if(!is.na(coeff[j,i])) {
if(pval[j,i]<.01) symb = 'green'
else if( (pval[j,i]<.05) & (pval[j,i]>=.01)) symb = 'orange'
else if( (pval[j,i]<.1) & (pval[j,i]>=.05)) symb = 'red'
else symb = 'black'
polygon(c(i+.5 ,i+.2 ,i+.5 ,i+.5),
c(k-j+0.5,k-j+0.5,k-j+0.8,k-j+0.5),
col=symb)
if(j==choix) {
rect(xleft=i-.5,
xright=i+.5,
ybottom=k-j+1.5,
ytop=k-j+.5,
lwd=4)
text(i,
k-j+1,
round(coeff[j,i],2),
cex=1.2,
font=2)
}
else{
rect(xleft=i-.5,xright=i+.5,ybottom=k-j+1.5,ytop=k-j+.5)
text(i,k-j+1,round(coeff[j,i],2),cex=1.2,font=1)
}
}
axis(3,1:n,noms)
par(mar=c(0.5,0,0,0.5))
plot(0,axes=F,xlab='',ylab='',type='n',xlim=c(0,8),ylim=c(-.2,.8))
cols <- c('green','orange','red','black')
niv <- c('0','0.01','0.05','0.1')
for(i in 0:3){
polygon(c(1+2*i ,1+2*i ,1+2*i-.5 ,1+2*i),
c(.4 ,.7 , .4 , .4),
col=cols[i+1])
text(2*i,0.5,niv[i+1],cex=1.5)
}
text(8,.5,1,cex=1.5)
text(4,0,'p-value',cex=2)
box()
residus <- arimaSelect.out[[3]][[choix]]$res
par(mar=c(1,2,4,1))
acf(residus,main='')
title('acf',line=.5)
par(mar=c(1,2,4,1))
pacf(residus,main='')
title('pacf',line=.5)
par(mar=c(2,2,4,1))
qqnorm(residus,main='')
title('qq-norm',line=.5)
qqline(residus)
residus
}
if (par2 == 0) x <- log(x)
if (par2 != 0) x <- x^par2
(selection <- arimaSelect(x, order=c(par6,par3,par7), seasonal=list(order=c(par8,par4,par9), period=par5)))
bitmap(file='test1.png')
resid <- arimaSelectplot(selection)
dev.off()
resid
bitmap(file='test2.png')
acf(resid,length(resid)/2, main='Residual Autocorrelation Function')
dev.off()
bitmap(file='test3.png')
pacf(resid,length(resid)/2, main='Residual Partial Autocorrelation Function')
dev.off()
bitmap(file='test4.png')
cpgram(resid, main='Residual Cumulative Periodogram')
dev.off()
bitmap(file='test5.png')
hist(resid, main='Residual Histogram', xlab='values of Residuals')
dev.off()
bitmap(file='test6.png')
densityplot(~resid,col='black',main='Residual Density Plot', xlab='values of Residuals')
dev.off()
bitmap(file='test7.png')
qqnorm(resid, main='Residual Normal Q-Q Plot')
qqline(resid)
dev.off()
ncols <- length(selection[[1]][1,])
nrows <- length(selection[[2]][,1])-1
load(file='createtable')
a<-table.start()
a<-table.row.start(a)
a<-table.element(a,'ARIMA Parameter Estimation and Backward Selection', ncols+1,TRUE)
a<-table.row.end(a)
a<-table.row.start(a)
a<-table.element(a,'Iteration', header=TRUE)
for (i in 1:ncols) {
a<-table.element(a,names(selection[[3]][[1]]$coef)[i],header=TRUE)
}
a<-table.row.end(a)
for (j in 1:nrows) {
a<-table.row.start(a)
mydum <- 'Estimates ('
mydum <- paste(mydum,j)
mydum <- paste(mydum,')')
a<-table.element(a,mydum, header=TRUE)
for (i in 1:ncols) {
a<-table.element(a,round(selection[[1]][j,i],4))
}
a<-table.row.end(a)
a<-table.row.start(a)
a<-table.element(a,'(p-val)', header=TRUE)
for (i in 1:ncols) {
mydum <- '('
mydum <- paste(mydum,round(selection[[2]][j,i],4),sep='')
mydum <- paste(mydum,')')
a<-table.element(a,mydum)
}
a<-table.row.end(a)
}
a<-table.end(a)
table.save(a,file='mytable.tab')
a<-table.start()
a<-table.row.start(a)
a<-table.element(a,'Estimated ARIMA Residuals', 1,TRUE)
a<-table.row.end(a)
a<-table.row.start(a)
a<-table.element(a,'Value', 1,TRUE)
a<-table.row.end(a)
for (i in (par4*par5+par3):length(resid)) {
a<-table.row.start(a)
a<-table.element(a,resid[i])
a<-table.row.end(a)
}
a<-table.end(a)
table.save(a,file='mytable1.tab')