Free Statistics

of Irreproducible Research!

Author's title

Author*The author of this computation has been verified*
R Software Modulerwasp_arimabackwardselection.wasp
Title produced by softwareARIMA Backward Selection
Date of computationWed, 21 Dec 2016 11:07:52 +0100
Cite this page as followsStatistical Computations at FreeStatistics.org, Office for Research Development and Education, URL https://freestatistics.org/blog/index.php?v=date/2016/Dec/21/t1482314883g6844dsskbq4x15.htm/, Retrieved Fri, 01 Nov 2024 03:42:37 +0000
Statistical Computations at FreeStatistics.org, Office for Research Development and Education, URL https://freestatistics.org/blog/index.php?pk=302006, Retrieved Fri, 01 Nov 2024 03:42:37 +0000
QR Codes:

Original text written by user:
IsPrivate?No (this computation is public)
User-defined keywords
Estimated Impact80
Family? (F = Feedback message, R = changed R code, M = changed R Module, P = changed Parameters, D = changed Data)
-       [ARIMA Backward Selection] [jeej] [2016-12-21 10:07:52] [e1e79d437a44c5123ccedd8a903518e8] [Current]
Feedback Forum

Post a new message
Dataseries X:
3891
3702
3712
3796
3856
3989
3922
4084
4169
4161
4205
4198
4228
4461
4326
4305
4351
4357
4449
4519
4422
4507
4549
4658
4468
4516
4548
4656
4640
4686
4734
4702
4723
4609
4731
4791
5111
4841
4875
4975
4973
4966
4937
4861
4980
4896
4924
4920
5088
5193
5169
5102
5041
4925
5091
4798
5098
5554
5173
5240
5101
5162
5207
5189
5258
5211
5149
5259
5327
5248
5421
5476
5507
5324
5123
5447
5290
5326
5118
5241
5178
5324
5292
5371
5453
5509
5437
5342
5390
5329
5258
5262
5147
5158
5125
5026
4917
4855
4668
4884
4923
4981
5148
5052
5061
4995
5058
5009
5145
5187
5327
5418
5482
5583
5735
5669


Summary of computational transaction
Raw Input view raw input (R code)
Raw Outputview raw output of R engine
Computing time7 seconds
R ServerBig Analytics Cloud Computing Center

\begin{tabular}{lllllllll}
\hline
Summary of computational transaction \tabularnewline
Raw Input view raw input (R code)  \tabularnewline
Raw Outputview raw output of R engine  \tabularnewline
Computing time7 seconds \tabularnewline
R ServerBig Analytics Cloud Computing Center \tabularnewline
\hline
\end{tabular}
%Source: https://freestatistics.org/blog/index.php?pk=302006&T=0

[TABLE]
[ROW]
Summary of computational transaction[/C][/ROW] [ROW]Raw Input[/C] view raw input (R code) [/C][/ROW] [ROW]Raw Output[/C]view raw output of R engine [/C][/ROW] [ROW]Computing time[/C]7 seconds[/C][/ROW] [ROW]R Server[/C]Big Analytics Cloud Computing Center[/C][/ROW] [/TABLE] Source: https://freestatistics.org/blog/index.php?pk=302006&T=0

Globally Unique Identifier (entire table): ba.freestatistics.org/blog/index.php?pk=302006&T=0

As an alternative you can also use a QR Code:  

The GUIDs for individual cells are displayed in the table below:

Summary of computational transaction
Raw Input view raw input (R code)
Raw Outputview raw output of R engine
Computing time7 seconds
R ServerBig Analytics Cloud Computing Center


ARIMA Parameter Estimation and Backward Selection
Iterationar1ar2ar3ma1sar1sar2sma1
Estimates ( 1 )-0.1502-0.00210.0034-0.1316-0.1682-0.218-1
(p-val)(0.9596 )(0.9979 )(0.9747 )(0.9647 )(0.122 )(0.067 )(0 )
Estimates ( 2 )-0.137900.0032-0.144-0.1679-0.2178-1.0001
(p-val)(0.7097 )(NA )(0.9758 )(0.6995 )(0.1197 )(0.0527 )(0 )
Estimates ( 3 )-0.137300-0.1446-0.1678-0.217-1
(p-val)(0.7095 )(NA )(NA )(0.6966 )(0.12 )(0.0473 )(0 )
Estimates ( 4 )000-0.2734-0.1645-0.2145-0.9999
(p-val)(NA )(NA )(NA )(0.0044 )(0.1274 )(0.0506 )(0 )
Estimates ( 5 )000-0.30360-0.1599-1
(p-val)(NA )(NA )(NA )(0.0014 )(NA )(0.1439 )(0 )
Estimates ( 6 )000-0.303700-1
(p-val)(NA )(NA )(NA )(0.0017 )(NA )(NA )(0 )
Estimates ( 7 )NANANANANANANA
(p-val)(NA )(NA )(NA )(NA )(NA )(NA )(NA )
Estimates ( 8 )NANANANANANANA
(p-val)(NA )(NA )(NA )(NA )(NA )(NA )(NA )
Estimates ( 9 )NANANANANANANA
(p-val)(NA )(NA )(NA )(NA )(NA )(NA )(NA )
Estimates ( 10 )NANANANANANANA
(p-val)(NA )(NA )(NA )(NA )(NA )(NA )(NA )
Estimates ( 11 )NANANANANANANA
(p-val)(NA )(NA )(NA )(NA )(NA )(NA )(NA )
Estimates ( 12 )NANANANANANANA
(p-val)(NA )(NA )(NA )(NA )(NA )(NA )(NA )
Estimates ( 13 )NANANANANANANA
(p-val)(NA )(NA )(NA )(NA )(NA )(NA )(NA )

\begin{tabular}{lllllllll}
\hline
ARIMA Parameter Estimation and Backward Selection \tabularnewline
Iteration & ar1 & ar2 & ar3 & ma1 & sar1 & sar2 & sma1 \tabularnewline
Estimates ( 1 ) & -0.1502 & -0.0021 & 0.0034 & -0.1316 & -0.1682 & -0.218 & -1 \tabularnewline
(p-val) & (0.9596 ) & (0.9979 ) & (0.9747 ) & (0.9647 ) & (0.122 ) & (0.067 ) & (0 ) \tabularnewline
Estimates ( 2 ) & -0.1379 & 0 & 0.0032 & -0.144 & -0.1679 & -0.2178 & -1.0001 \tabularnewline
(p-val) & (0.7097 ) & (NA ) & (0.9758 ) & (0.6995 ) & (0.1197 ) & (0.0527 ) & (0 ) \tabularnewline
Estimates ( 3 ) & -0.1373 & 0 & 0 & -0.1446 & -0.1678 & -0.217 & -1 \tabularnewline
(p-val) & (0.7095 ) & (NA ) & (NA ) & (0.6966 ) & (0.12 ) & (0.0473 ) & (0 ) \tabularnewline
Estimates ( 4 ) & 0 & 0 & 0 & -0.2734 & -0.1645 & -0.2145 & -0.9999 \tabularnewline
(p-val) & (NA ) & (NA ) & (NA ) & (0.0044 ) & (0.1274 ) & (0.0506 ) & (0 ) \tabularnewline
Estimates ( 5 ) & 0 & 0 & 0 & -0.3036 & 0 & -0.1599 & -1 \tabularnewline
(p-val) & (NA ) & (NA ) & (NA ) & (0.0014 ) & (NA ) & (0.1439 ) & (0 ) \tabularnewline
Estimates ( 6 ) & 0 & 0 & 0 & -0.3037 & 0 & 0 & -1 \tabularnewline
(p-val) & (NA ) & (NA ) & (NA ) & (0.0017 ) & (NA ) & (NA ) & (0 ) \tabularnewline
Estimates ( 7 ) & NA & NA & NA & NA & NA & NA & NA \tabularnewline
(p-val) & (NA ) & (NA ) & (NA ) & (NA ) & (NA ) & (NA ) & (NA ) \tabularnewline
Estimates ( 8 ) & NA & NA & NA & NA & NA & NA & NA \tabularnewline
(p-val) & (NA ) & (NA ) & (NA ) & (NA ) & (NA ) & (NA ) & (NA ) \tabularnewline
Estimates ( 9 ) & NA & NA & NA & NA & NA & NA & NA \tabularnewline
(p-val) & (NA ) & (NA ) & (NA ) & (NA ) & (NA ) & (NA ) & (NA ) \tabularnewline
Estimates ( 10 ) & NA & NA & NA & NA & NA & NA & NA \tabularnewline
(p-val) & (NA ) & (NA ) & (NA ) & (NA ) & (NA ) & (NA ) & (NA ) \tabularnewline
Estimates ( 11 ) & NA & NA & NA & NA & NA & NA & NA \tabularnewline
(p-val) & (NA ) & (NA ) & (NA ) & (NA ) & (NA ) & (NA ) & (NA ) \tabularnewline
Estimates ( 12 ) & NA & NA & NA & NA & NA & NA & NA \tabularnewline
(p-val) & (NA ) & (NA ) & (NA ) & (NA ) & (NA ) & (NA ) & (NA ) \tabularnewline
Estimates ( 13 ) & NA & NA & NA & NA & NA & NA & NA \tabularnewline
(p-val) & (NA ) & (NA ) & (NA ) & (NA ) & (NA ) & (NA ) & (NA ) \tabularnewline
\hline
\end{tabular}
%Source: https://freestatistics.org/blog/index.php?pk=302006&T=1

[TABLE]
[ROW][C]ARIMA Parameter Estimation and Backward Selection[/C][/ROW]
[ROW][C]Iteration[/C][C]ar1[/C][C]ar2[/C][C]ar3[/C][C]ma1[/C][C]sar1[/C][C]sar2[/C][C]sma1[/C][/ROW]
[ROW][C]Estimates ( 1 )[/C][C]-0.1502[/C][C]-0.0021[/C][C]0.0034[/C][C]-0.1316[/C][C]-0.1682[/C][C]-0.218[/C][C]-1[/C][/ROW]
[ROW][C](p-val)[/C][C](0.9596 )[/C][C](0.9979 )[/C][C](0.9747 )[/C][C](0.9647 )[/C][C](0.122 )[/C][C](0.067 )[/C][C](0 )[/C][/ROW]
[ROW][C]Estimates ( 2 )[/C][C]-0.1379[/C][C]0[/C][C]0.0032[/C][C]-0.144[/C][C]-0.1679[/C][C]-0.2178[/C][C]-1.0001[/C][/ROW]
[ROW][C](p-val)[/C][C](0.7097 )[/C][C](NA )[/C][C](0.9758 )[/C][C](0.6995 )[/C][C](0.1197 )[/C][C](0.0527 )[/C][C](0 )[/C][/ROW]
[ROW][C]Estimates ( 3 )[/C][C]-0.1373[/C][C]0[/C][C]0[/C][C]-0.1446[/C][C]-0.1678[/C][C]-0.217[/C][C]-1[/C][/ROW]
[ROW][C](p-val)[/C][C](0.7095 )[/C][C](NA )[/C][C](NA )[/C][C](0.6966 )[/C][C](0.12 )[/C][C](0.0473 )[/C][C](0 )[/C][/ROW]
[ROW][C]Estimates ( 4 )[/C][C]0[/C][C]0[/C][C]0[/C][C]-0.2734[/C][C]-0.1645[/C][C]-0.2145[/C][C]-0.9999[/C][/ROW]
[ROW][C](p-val)[/C][C](NA )[/C][C](NA )[/C][C](NA )[/C][C](0.0044 )[/C][C](0.1274 )[/C][C](0.0506 )[/C][C](0 )[/C][/ROW]
[ROW][C]Estimates ( 5 )[/C][C]0[/C][C]0[/C][C]0[/C][C]-0.3036[/C][C]0[/C][C]-0.1599[/C][C]-1[/C][/ROW]
[ROW][C](p-val)[/C][C](NA )[/C][C](NA )[/C][C](NA )[/C][C](0.0014 )[/C][C](NA )[/C][C](0.1439 )[/C][C](0 )[/C][/ROW]
[ROW][C]Estimates ( 6 )[/C][C]0[/C][C]0[/C][C]0[/C][C]-0.3037[/C][C]0[/C][C]0[/C][C]-1[/C][/ROW]
[ROW][C](p-val)[/C][C](NA )[/C][C](NA )[/C][C](NA )[/C][C](0.0017 )[/C][C](NA )[/C][C](NA )[/C][C](0 )[/C][/ROW]
[ROW][C]Estimates ( 7 )[/C][C]NA[/C][C]NA[/C][C]NA[/C][C]NA[/C][C]NA[/C][C]NA[/C][C]NA[/C][/ROW]
[ROW][C](p-val)[/C][C](NA )[/C][C](NA )[/C][C](NA )[/C][C](NA )[/C][C](NA )[/C][C](NA )[/C][C](NA )[/C][/ROW]
[ROW][C]Estimates ( 8 )[/C][C]NA[/C][C]NA[/C][C]NA[/C][C]NA[/C][C]NA[/C][C]NA[/C][C]NA[/C][/ROW]
[ROW][C](p-val)[/C][C](NA )[/C][C](NA )[/C][C](NA )[/C][C](NA )[/C][C](NA )[/C][C](NA )[/C][C](NA )[/C][/ROW]
[ROW][C]Estimates ( 9 )[/C][C]NA[/C][C]NA[/C][C]NA[/C][C]NA[/C][C]NA[/C][C]NA[/C][C]NA[/C][/ROW]
[ROW][C](p-val)[/C][C](NA )[/C][C](NA )[/C][C](NA )[/C][C](NA )[/C][C](NA )[/C][C](NA )[/C][C](NA )[/C][/ROW]
[ROW][C]Estimates ( 10 )[/C][C]NA[/C][C]NA[/C][C]NA[/C][C]NA[/C][C]NA[/C][C]NA[/C][C]NA[/C][/ROW]
[ROW][C](p-val)[/C][C](NA )[/C][C](NA )[/C][C](NA )[/C][C](NA )[/C][C](NA )[/C][C](NA )[/C][C](NA )[/C][/ROW]
[ROW][C]Estimates ( 11 )[/C][C]NA[/C][C]NA[/C][C]NA[/C][C]NA[/C][C]NA[/C][C]NA[/C][C]NA[/C][/ROW]
[ROW][C](p-val)[/C][C](NA )[/C][C](NA )[/C][C](NA )[/C][C](NA )[/C][C](NA )[/C][C](NA )[/C][C](NA )[/C][/ROW]
[ROW][C]Estimates ( 12 )[/C][C]NA[/C][C]NA[/C][C]NA[/C][C]NA[/C][C]NA[/C][C]NA[/C][C]NA[/C][/ROW]
[ROW][C](p-val)[/C][C](NA )[/C][C](NA )[/C][C](NA )[/C][C](NA )[/C][C](NA )[/C][C](NA )[/C][C](NA )[/C][/ROW]
[ROW][C]Estimates ( 13 )[/C][C]NA[/C][C]NA[/C][C]NA[/C][C]NA[/C][C]NA[/C][C]NA[/C][C]NA[/C][/ROW]
[ROW][C](p-val)[/C][C](NA )[/C][C](NA )[/C][C](NA )[/C][C](NA )[/C][C](NA )[/C][C](NA )[/C][C](NA )[/C][/ROW]
[/TABLE]
Source: https://freestatistics.org/blog/index.php?pk=302006&T=1

Globally Unique Identifier (entire table): ba.freestatistics.org/blog/index.php?pk=302006&T=1

As an alternative you can also use a QR Code:  

The GUIDs for individual cells are displayed in the table below:

ARIMA Parameter Estimation and Backward Selection
Iterationar1ar2ar3ma1sar1sar2sma1
Estimates ( 1 )-0.1502-0.00210.0034-0.1316-0.1682-0.218-1
(p-val)(0.9596 )(0.9979 )(0.9747 )(0.9647 )(0.122 )(0.067 )(0 )
Estimates ( 2 )-0.137900.0032-0.144-0.1679-0.2178-1.0001
(p-val)(0.7097 )(NA )(0.9758 )(0.6995 )(0.1197 )(0.0527 )(0 )
Estimates ( 3 )-0.137300-0.1446-0.1678-0.217-1
(p-val)(0.7095 )(NA )(NA )(0.6966 )(0.12 )(0.0473 )(0 )
Estimates ( 4 )000-0.2734-0.1645-0.2145-0.9999
(p-val)(NA )(NA )(NA )(0.0044 )(0.1274 )(0.0506 )(0 )
Estimates ( 5 )000-0.30360-0.1599-1
(p-val)(NA )(NA )(NA )(0.0014 )(NA )(0.1439 )(0 )
Estimates ( 6 )000-0.303700-1
(p-val)(NA )(NA )(NA )(0.0017 )(NA )(NA )(0 )
Estimates ( 7 )NANANANANANANA
(p-val)(NA )(NA )(NA )(NA )(NA )(NA )(NA )
Estimates ( 8 )NANANANANANANA
(p-val)(NA )(NA )(NA )(NA )(NA )(NA )(NA )
Estimates ( 9 )NANANANANANANA
(p-val)(NA )(NA )(NA )(NA )(NA )(NA )(NA )
Estimates ( 10 )NANANANANANANA
(p-val)(NA )(NA )(NA )(NA )(NA )(NA )(NA )
Estimates ( 11 )NANANANANANANA
(p-val)(NA )(NA )(NA )(NA )(NA )(NA )(NA )
Estimates ( 12 )NANANANANANANA
(p-val)(NA )(NA )(NA )(NA )(NA )(NA )(NA )
Estimates ( 13 )NANANANANANANA
(p-val)(NA )(NA )(NA )(NA )(NA )(NA )(NA )


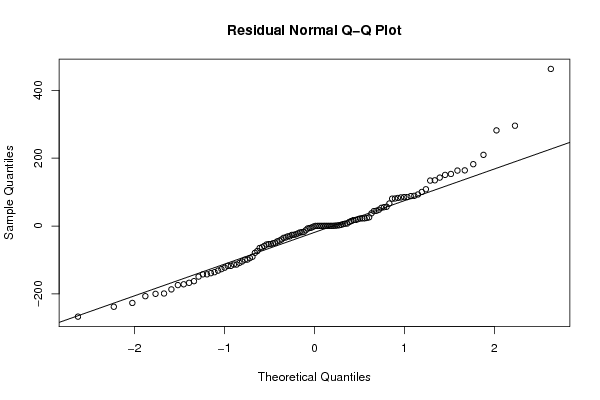
Estimated ARIMA Residuals
Value
-12.6717636045141
281.836001490298
-19.2713474970321
-79.0942514434466
-33.7779988977482
-98.9063689345894
80.9515122134647
-39.6502376679887
-139.083342009642
22.6830146960968
5.47859936070996
82.6207101507092
-162.506468744174
-50.7152405923897
66.2730289208052
85.3934994019389
-26.2934838874595
-18.2518696029805
11.9794615957916
-104.547202145473
0.214304932747223
-122.959377045843
23.5488898686918
6.92649938077456
295.510440677473
-131.50175548341
-4.60521140078184
20.0295613852536
-17.8503713843057
-73.847309780364
-54.5202386461556
-136.137985418174
37.4341755993472
-30.5583765316013
-49.2991928454035
-53.4070977772655
22.155920783059
150.581012436026
43.9732705385084
-99.6289951895385
-108.673935311555
-174.095378221624
88.8277296534284
-267.177630355952
153.303513240688
462.86612182048
-238.024747689127
-45.1632104110258
-186.821965024855
-25.9635986308201
53.5172970460594
-30.5172058505804
47.8281747901321
-43.0505813941809
-117.498512493951
88.1076468014226
17.7651172466678
-142.474023600637
142.601270416639
44.7537572443615
7.30877758573721
-142.380733166332
-226.79002354645
182.140517889876
-113.700933895053
-22.0607538756588
-198.972985898243
22.4552331386478
-94.4527117153182
134.709582775348
-53.2991338577088
17.5335106719969
3.43192167817665
92.9543946244322
1.40787829764771
-167.48516144027
14.7089019292906
-64.869586603594
-90.5932265016299
-7.39610233575669
-171.762152833384
-117.621729234426
-34.7657183843761
-149.12647545675
-199.91810375095
-127.136508447439
-206.867232404469
133.874147922698
55.5244191358393
80.4795297759097
164.037879045045
-24.5816740560734
-58.8008939321405
-113.572241008257
25.703183146268
-62.7103808717797
84.2326498544654
100.306199439986
209.696564650749
56.7120527198395
85.0710594343293
108.308377077733
163.365441820615
-6.07288339216773

\begin{tabular}{lllllllll}
\hline
Estimated ARIMA Residuals \tabularnewline
Value \tabularnewline
-12.6717636045141 \tabularnewline
281.836001490298 \tabularnewline
-19.2713474970321 \tabularnewline
-79.0942514434466 \tabularnewline
-33.7779988977482 \tabularnewline
-98.9063689345894 \tabularnewline
80.9515122134647 \tabularnewline
-39.6502376679887 \tabularnewline
-139.083342009642 \tabularnewline
22.6830146960968 \tabularnewline
5.47859936070996 \tabularnewline
82.6207101507092 \tabularnewline
-162.506468744174 \tabularnewline
-50.7152405923897 \tabularnewline
66.2730289208052 \tabularnewline
85.3934994019389 \tabularnewline
-26.2934838874595 \tabularnewline
-18.2518696029805 \tabularnewline
11.9794615957916 \tabularnewline
-104.547202145473 \tabularnewline
0.214304932747223 \tabularnewline
-122.959377045843 \tabularnewline
23.5488898686918 \tabularnewline
6.92649938077456 \tabularnewline
295.510440677473 \tabularnewline
-131.50175548341 \tabularnewline
-4.60521140078184 \tabularnewline
20.0295613852536 \tabularnewline
-17.8503713843057 \tabularnewline
-73.847309780364 \tabularnewline
-54.5202386461556 \tabularnewline
-136.137985418174 \tabularnewline
37.4341755993472 \tabularnewline
-30.5583765316013 \tabularnewline
-49.2991928454035 \tabularnewline
-53.4070977772655 \tabularnewline
22.155920783059 \tabularnewline
150.581012436026 \tabularnewline
43.9732705385084 \tabularnewline
-99.6289951895385 \tabularnewline
-108.673935311555 \tabularnewline
-174.095378221624 \tabularnewline
88.8277296534284 \tabularnewline
-267.177630355952 \tabularnewline
153.303513240688 \tabularnewline
462.86612182048 \tabularnewline
-238.024747689127 \tabularnewline
-45.1632104110258 \tabularnewline
-186.821965024855 \tabularnewline
-25.9635986308201 \tabularnewline
53.5172970460594 \tabularnewline
-30.5172058505804 \tabularnewline
47.8281747901321 \tabularnewline
-43.0505813941809 \tabularnewline
-117.498512493951 \tabularnewline
88.1076468014226 \tabularnewline
17.7651172466678 \tabularnewline
-142.474023600637 \tabularnewline
142.601270416639 \tabularnewline
44.7537572443615 \tabularnewline
7.30877758573721 \tabularnewline
-142.380733166332 \tabularnewline
-226.79002354645 \tabularnewline
182.140517889876 \tabularnewline
-113.700933895053 \tabularnewline
-22.0607538756588 \tabularnewline
-198.972985898243 \tabularnewline
22.4552331386478 \tabularnewline
-94.4527117153182 \tabularnewline
134.709582775348 \tabularnewline
-53.2991338577088 \tabularnewline
17.5335106719969 \tabularnewline
3.43192167817665 \tabularnewline
92.9543946244322 \tabularnewline
1.40787829764771 \tabularnewline
-167.48516144027 \tabularnewline
14.7089019292906 \tabularnewline
-64.869586603594 \tabularnewline
-90.5932265016299 \tabularnewline
-7.39610233575669 \tabularnewline
-171.762152833384 \tabularnewline
-117.621729234426 \tabularnewline
-34.7657183843761 \tabularnewline
-149.12647545675 \tabularnewline
-199.91810375095 \tabularnewline
-127.136508447439 \tabularnewline
-206.867232404469 \tabularnewline
133.874147922698 \tabularnewline
55.5244191358393 \tabularnewline
80.4795297759097 \tabularnewline
164.037879045045 \tabularnewline
-24.5816740560734 \tabularnewline
-58.8008939321405 \tabularnewline
-113.572241008257 \tabularnewline
25.703183146268 \tabularnewline
-62.7103808717797 \tabularnewline
84.2326498544654 \tabularnewline
100.306199439986 \tabularnewline
209.696564650749 \tabularnewline
56.7120527198395 \tabularnewline
85.0710594343293 \tabularnewline
108.308377077733 \tabularnewline
163.365441820615 \tabularnewline
-6.07288339216773 \tabularnewline
\hline
\end{tabular}
%Source: https://freestatistics.org/blog/index.php?pk=302006&T=2

[TABLE]
[ROW][C]Estimated ARIMA Residuals[/C][/ROW]
[ROW][C]Value[/C][/ROW]
[ROW][C]-12.6717636045141[/C][/ROW]
[ROW][C]281.836001490298[/C][/ROW]
[ROW][C]-19.2713474970321[/C][/ROW]
[ROW][C]-79.0942514434466[/C][/ROW]
[ROW][C]-33.7779988977482[/C][/ROW]
[ROW][C]-98.9063689345894[/C][/ROW]
[ROW][C]80.9515122134647[/C][/ROW]
[ROW][C]-39.6502376679887[/C][/ROW]
[ROW][C]-139.083342009642[/C][/ROW]
[ROW][C]22.6830146960968[/C][/ROW]
[ROW][C]5.47859936070996[/C][/ROW]
[ROW][C]82.6207101507092[/C][/ROW]
[ROW][C]-162.506468744174[/C][/ROW]
[ROW][C]-50.7152405923897[/C][/ROW]
[ROW][C]66.2730289208052[/C][/ROW]
[ROW][C]85.3934994019389[/C][/ROW]
[ROW][C]-26.2934838874595[/C][/ROW]
[ROW][C]-18.2518696029805[/C][/ROW]
[ROW][C]11.9794615957916[/C][/ROW]
[ROW][C]-104.547202145473[/C][/ROW]
[ROW][C]0.214304932747223[/C][/ROW]
[ROW][C]-122.959377045843[/C][/ROW]
[ROW][C]23.5488898686918[/C][/ROW]
[ROW][C]6.92649938077456[/C][/ROW]
[ROW][C]295.510440677473[/C][/ROW]
[ROW][C]-131.50175548341[/C][/ROW]
[ROW][C]-4.60521140078184[/C][/ROW]
[ROW][C]20.0295613852536[/C][/ROW]
[ROW][C]-17.8503713843057[/C][/ROW]
[ROW][C]-73.847309780364[/C][/ROW]
[ROW][C]-54.5202386461556[/C][/ROW]
[ROW][C]-136.137985418174[/C][/ROW]
[ROW][C]37.4341755993472[/C][/ROW]
[ROW][C]-30.5583765316013[/C][/ROW]
[ROW][C]-49.2991928454035[/C][/ROW]
[ROW][C]-53.4070977772655[/C][/ROW]
[ROW][C]22.155920783059[/C][/ROW]
[ROW][C]150.581012436026[/C][/ROW]
[ROW][C]43.9732705385084[/C][/ROW]
[ROW][C]-99.6289951895385[/C][/ROW]
[ROW][C]-108.673935311555[/C][/ROW]
[ROW][C]-174.095378221624[/C][/ROW]
[ROW][C]88.8277296534284[/C][/ROW]
[ROW][C]-267.177630355952[/C][/ROW]
[ROW][C]153.303513240688[/C][/ROW]
[ROW][C]462.86612182048[/C][/ROW]
[ROW][C]-238.024747689127[/C][/ROW]
[ROW][C]-45.1632104110258[/C][/ROW]
[ROW][C]-186.821965024855[/C][/ROW]
[ROW][C]-25.9635986308201[/C][/ROW]
[ROW][C]53.5172970460594[/C][/ROW]
[ROW][C]-30.5172058505804[/C][/ROW]
[ROW][C]47.8281747901321[/C][/ROW]
[ROW][C]-43.0505813941809[/C][/ROW]
[ROW][C]-117.498512493951[/C][/ROW]
[ROW][C]88.1076468014226[/C][/ROW]
[ROW][C]17.7651172466678[/C][/ROW]
[ROW][C]-142.474023600637[/C][/ROW]
[ROW][C]142.601270416639[/C][/ROW]
[ROW][C]44.7537572443615[/C][/ROW]
[ROW][C]7.30877758573721[/C][/ROW]
[ROW][C]-142.380733166332[/C][/ROW]
[ROW][C]-226.79002354645[/C][/ROW]
[ROW][C]182.140517889876[/C][/ROW]
[ROW][C]-113.700933895053[/C][/ROW]
[ROW][C]-22.0607538756588[/C][/ROW]
[ROW][C]-198.972985898243[/C][/ROW]
[ROW][C]22.4552331386478[/C][/ROW]
[ROW][C]-94.4527117153182[/C][/ROW]
[ROW][C]134.709582775348[/C][/ROW]
[ROW][C]-53.2991338577088[/C][/ROW]
[ROW][C]17.5335106719969[/C][/ROW]
[ROW][C]3.43192167817665[/C][/ROW]
[ROW][C]92.9543946244322[/C][/ROW]
[ROW][C]1.40787829764771[/C][/ROW]
[ROW][C]-167.48516144027[/C][/ROW]
[ROW][C]14.7089019292906[/C][/ROW]
[ROW][C]-64.869586603594[/C][/ROW]
[ROW][C]-90.5932265016299[/C][/ROW]
[ROW][C]-7.39610233575669[/C][/ROW]
[ROW][C]-171.762152833384[/C][/ROW]
[ROW][C]-117.621729234426[/C][/ROW]
[ROW][C]-34.7657183843761[/C][/ROW]
[ROW][C]-149.12647545675[/C][/ROW]
[ROW][C]-199.91810375095[/C][/ROW]
[ROW][C]-127.136508447439[/C][/ROW]
[ROW][C]-206.867232404469[/C][/ROW]
[ROW][C]133.874147922698[/C][/ROW]
[ROW][C]55.5244191358393[/C][/ROW]
[ROW][C]80.4795297759097[/C][/ROW]
[ROW][C]164.037879045045[/C][/ROW]
[ROW][C]-24.5816740560734[/C][/ROW]
[ROW][C]-58.8008939321405[/C][/ROW]
[ROW][C]-113.572241008257[/C][/ROW]
[ROW][C]25.703183146268[/C][/ROW]
[ROW][C]-62.7103808717797[/C][/ROW]
[ROW][C]84.2326498544654[/C][/ROW]
[ROW][C]100.306199439986[/C][/ROW]
[ROW][C]209.696564650749[/C][/ROW]
[ROW][C]56.7120527198395[/C][/ROW]
[ROW][C]85.0710594343293[/C][/ROW]
[ROW][C]108.308377077733[/C][/ROW]
[ROW][C]163.365441820615[/C][/ROW]
[ROW][C]-6.07288339216773[/C][/ROW]
[/TABLE]
Source: https://freestatistics.org/blog/index.php?pk=302006&T=2

Globally Unique Identifier (entire table): ba.freestatistics.org/blog/index.php?pk=302006&T=2

As an alternative you can also use a QR Code:  

The GUIDs for individual cells are displayed in the table below:

Estimated ARIMA Residuals
Value
-12.6717636045141
281.836001490298
-19.2713474970321
-79.0942514434466
-33.7779988977482
-98.9063689345894
80.9515122134647
-39.6502376679887
-139.083342009642
22.6830146960968
5.47859936070996
82.6207101507092
-162.506468744174
-50.7152405923897
66.2730289208052
85.3934994019389
-26.2934838874595
-18.2518696029805
11.9794615957916
-104.547202145473
0.214304932747223
-122.959377045843
23.5488898686918
6.92649938077456
295.510440677473
-131.50175548341
-4.60521140078184
20.0295613852536
-17.8503713843057
-73.847309780364
-54.5202386461556
-136.137985418174
37.4341755993472
-30.5583765316013
-49.2991928454035
-53.4070977772655
22.155920783059
150.581012436026
43.9732705385084
-99.6289951895385
-108.673935311555
-174.095378221624
88.8277296534284
-267.177630355952
153.303513240688
462.86612182048
-238.024747689127
-45.1632104110258
-186.821965024855
-25.9635986308201
53.5172970460594
-30.5172058505804
47.8281747901321
-43.0505813941809
-117.498512493951
88.1076468014226
17.7651172466678
-142.474023600637
142.601270416639
44.7537572443615
7.30877758573721
-142.380733166332
-226.79002354645
182.140517889876
-113.700933895053
-22.0607538756588
-198.972985898243
22.4552331386478
-94.4527117153182
134.709582775348
-53.2991338577088
17.5335106719969
3.43192167817665
92.9543946244322
1.40787829764771
-167.48516144027
14.7089019292906
-64.869586603594
-90.5932265016299
-7.39610233575669
-171.762152833384
-117.621729234426
-34.7657183843761
-149.12647545675
-199.91810375095
-127.136508447439
-206.867232404469
133.874147922698
55.5244191358393
80.4795297759097
164.037879045045
-24.5816740560734
-58.8008939321405
-113.572241008257
25.703183146268
-62.7103808717797
84.2326498544654
100.306199439986
209.696564650749
56.7120527198395
85.0710594343293
108.308377077733
163.365441820615
-6.07288339216773


Parameters (Session):
par1 = 12 ;
Parameters (R input):
par1 = FALSE ; par2 = 1.0 ; par3 = 1 ; par4 = 1 ; par5 = 12 ; par6 = 3 ; par7 = 1 ; par8 = 2 ; par9 = 1 ;
R code (references can be found in the software module):
par9 <- '1'
par8 <- '2'
par7 <- '1'
par6 <- '3'
par5 <- '12'
par4 <- '1'
par3 <- '1'
par2 <- '0.9'
par1 <- 'FALSE'
library(lattice)
if (par1 == 'TRUE') par1 <- TRUE
if (par1 == 'FALSE') par1 <- FALSE
par2 <- as.numeric(par2) #Box-Cox lambda transformation parameter
par3 <- as.numeric(par3) #degree of non-seasonal differencing
par4 <- as.numeric(par4) #degree of seasonal differencing
par5 <- as.numeric(par5) #seasonal period
par6 <- as.numeric(par6) #degree (p) of the non-seasonal AR(p) polynomial
par7 <- as.numeric(par7) #degree (q) of the non-seasonal MA(q) polynomial
par8 <- as.numeric(par8) #degree (P) of the seasonal AR(P) polynomial
par9 <- as.numeric(par9) #degree (Q) of the seasonal MA(Q) polynomial
armaGR <- function(arima.out, names, n){
try1 <- arima.out$coef
try2 <- sqrt(diag(arima.out$var.coef))
try.data.frame <- data.frame(matrix(NA,ncol=4,nrow=length(names)))
dimnames(try.data.frame) <- list(names,c('coef','std','tstat','pv'))
try.data.frame[,1] <- try1
for(i in 1:length(try2)) try.data.frame[which(rownames(try.data.frame)==names(try2)[i]),2] <- try2[i]
try.data.frame[,3] <- try.data.frame[,1] / try.data.frame[,2]
try.data.frame[,4] <- round((1-pt(abs(try.data.frame[,3]),df=n-(length(try2)+1)))*2,5)
vector <- rep(NA,length(names))
vector[is.na(try.data.frame[,4])] <- 0
maxi <- which.max(try.data.frame[,4])
continue <- max(try.data.frame[,4],na.rm=TRUE) > .05
vector[maxi] <- 0
list(summary=try.data.frame,next.vector=vector,continue=continue)
}
arimaSelect <- function(series, order=c(13,0,0), seasonal=list(order=c(2,0,0),period=12), include.mean=F){
nrc <- order[1]+order[3]+seasonal$order[1]+seasonal$order[3]
coeff <- matrix(NA, nrow=nrc*2, ncol=nrc)
pval <- matrix(NA, nrow=nrc*2, ncol=nrc)
mylist <- rep(list(NULL), nrc)
names <- NULL
if(order[1] > 0) names <- paste('ar',1:order[1],sep='')
if(order[3] > 0) names <- c( names , paste('ma',1:order[3],sep='') )
if(seasonal$order[1] > 0) names <- c(names, paste('sar',1:seasonal$order[1],sep=''))
if(seasonal$order[3] > 0) names <- c(names, paste('sma',1:seasonal$order[3],sep=''))
arima.out <- arima(series, order=order, seasonal=seasonal, include.mean=include.mean, method='ML')
mylist[[1]] <- arima.out
last.arma <- armaGR(arima.out, names, length(series))
mystop <- FALSE
i <- 1
coeff[i,] <- last.arma[[1]][,1]
pval [i,] <- last.arma[[1]][,4]
i <- 2
aic <- arima.out$aic
while(!mystop){
mylist[[i]] <- arima.out
arima.out <- arima(series, order=order, seasonal=seasonal, include.mean=include.mean, method='ML', fixed=last.arma$next.vector)
aic <- c(aic, arima.out$aic)
last.arma <- armaGR(arima.out, names, length(series))
mystop <- !last.arma$continue
coeff[i,] <- last.arma[[1]][,1]
pval [i,] <- last.arma[[1]][,4]
i <- i+1
}
list(coeff, pval, mylist, aic=aic)
}
arimaSelectplot <- function(arimaSelect.out,noms,choix){
noms <- names(arimaSelect.out[[3]][[1]]$coef)
coeff <- arimaSelect.out[[1]]
k <- min(which(is.na(coeff[,1])))-1
coeff <- coeff[1:k,]
pval <- arimaSelect.out[[2]][1:k,]
aic <- arimaSelect.out$aic[1:k]
coeff[coeff==0] <- NA
n <- ncol(coeff)
if(missing(choix)) choix <- k
layout(matrix(c(1,1,1,2,
3,3,3,2,
3,3,3,4,
5,6,7,7),nr=4),
widths=c(10,35,45,15),
heights=c(30,30,15,15))
couleurs <- rainbow(75)[1:50]#(50)
ticks <- pretty(coeff)
par(mar=c(1,1,3,1))
plot(aic,k:1-.5,type='o',pch=21,bg='blue',cex=2,axes=F,lty=2,xpd=NA)
points(aic[choix],k-choix+.5,pch=21,cex=4,bg=2,xpd=NA)
title('aic',line=2)
par(mar=c(3,0,0,0))
plot(0,axes=F,xlab='',ylab='',xlim=range(ticks),ylim=c(.1,1))
rect(xleft = min(ticks) + (0:49)/50*(max(ticks)-min(ticks)),
xright = min(ticks) + (1:50)/50*(max(ticks)-min(ticks)),
ytop = rep(1,50),
ybottom= rep(0,50),col=couleurs,border=NA)
axis(1,ticks)
rect(xleft=min(ticks),xright=max(ticks),ytop=1,ybottom=0)
text(mean(coeff,na.rm=T),.5,'coefficients',cex=2,font=2)
par(mar=c(1,1,3,1))
image(1:n,1:k,t(coeff[k:1,]),axes=F,col=couleurs,zlim=range(ticks))
for(i in 1:n) for(j in 1:k) if(!is.na(coeff[j,i])) {
if(pval[j,i]<.01) symb = 'green'
else if( (pval[j,i]<.05) & (pval[j,i]>=.01)) symb = 'orange'
else if( (pval[j,i]<.1) & (pval[j,i]>=.05)) symb = 'red'
else symb = 'black'
polygon(c(i+.5 ,i+.2 ,i+.5 ,i+.5),
c(k-j+0.5,k-j+0.5,k-j+0.8,k-j+0.5),
col=symb)
if(j==choix) {
rect(xleft=i-.5,
xright=i+.5,
ybottom=k-j+1.5,
ytop=k-j+.5,
lwd=4)
text(i,
k-j+1,
round(coeff[j,i],2),
cex=1.2,
font=2)
}
else{
rect(xleft=i-.5,xright=i+.5,ybottom=k-j+1.5,ytop=k-j+.5)
text(i,k-j+1,round(coeff[j,i],2),cex=1.2,font=1)
}
}
axis(3,1:n,noms)
par(mar=c(0.5,0,0,0.5))
plot(0,axes=F,xlab='',ylab='',type='n',xlim=c(0,8),ylim=c(-.2,.8))
cols <- c('green','orange','red','black')
niv <- c('0','0.01','0.05','0.1')
for(i in 0:3){
polygon(c(1+2*i ,1+2*i ,1+2*i-.5 ,1+2*i),
c(.4 ,.7 , .4 , .4),
col=cols[i+1])
text(2*i,0.5,niv[i+1],cex=1.5)
}
text(8,.5,1,cex=1.5)
text(4,0,'p-value',cex=2)
box()
residus <- arimaSelect.out[[3]][[choix]]$res
par(mar=c(1,2,4,1))
acf(residus,main='')
title('acf',line=.5)
par(mar=c(1,2,4,1))
pacf(residus,main='')
title('pacf',line=.5)
par(mar=c(2,2,4,1))
qqnorm(residus,main='')
title('qq-norm',line=.5)
qqline(residus)
residus
}
if (par2 == 0) x <- log(x)
if (par2 != 0) x <- x^par2
(selection <- arimaSelect(x, order=c(par6,par3,par7), seasonal=list(order=c(par8,par4,par9), period=par5)))
bitmap(file='test1.png')
resid <- arimaSelectplot(selection)
dev.off()
resid
bitmap(file='test2.png')
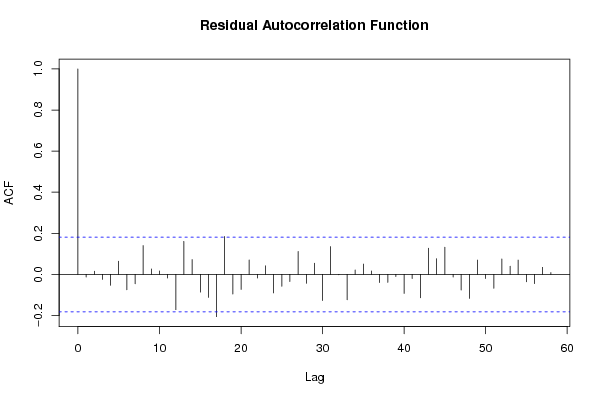
acf(resid,length(resid)/2, main='Residual Autocorrelation Function')
dev.off()
bitmap(file='test3.png')
pacf(resid,length(resid)/2, main='Residual Partial Autocorrelation Function')
dev.off()
bitmap(file='test4.png')
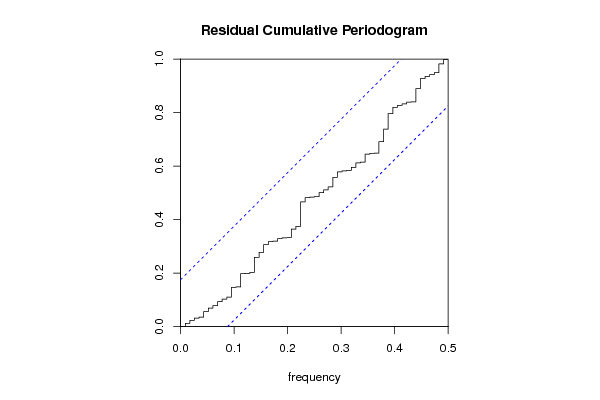
cpgram(resid, main='Residual Cumulative Periodogram')
dev.off()
bitmap(file='test5.png')
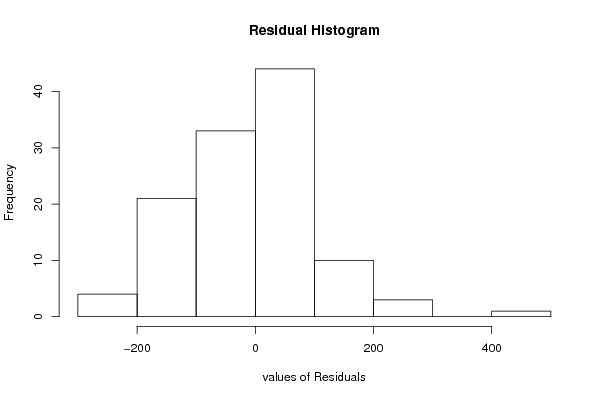
hist(resid, main='Residual Histogram', xlab='values of Residuals')
dev.off()
bitmap(file='test6.png')
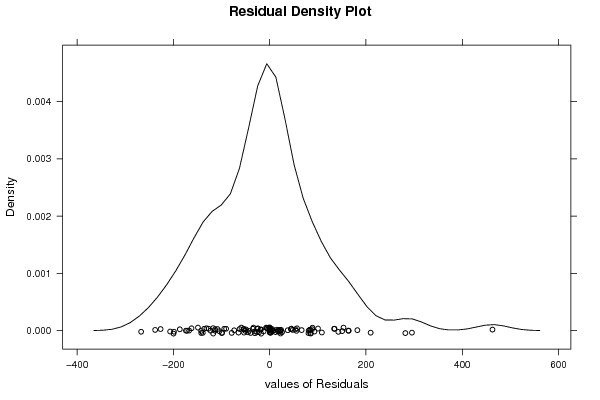
densityplot(~resid,col='black',main='Residual Density Plot', xlab='values of Residuals')
dev.off()
bitmap(file='test7.png')
qqnorm(resid, main='Residual Normal Q-Q Plot')
qqline(resid)
dev.off()
ncols <- length(selection[[1]][1,])
nrows <- length(selection[[2]][,1])-1
load(file='createtable')
a<-table.start()
a<-table.row.start(a)
a<-table.element(a,'ARIMA Parameter Estimation and Backward Selection', ncols+1,TRUE)
a<-table.row.end(a)
a<-table.row.start(a)
a<-table.element(a,'Iteration', header=TRUE)
for (i in 1:ncols) {
a<-table.element(a,names(selection[[3]][[1]]$coef)[i],header=TRUE)
}
a<-table.row.end(a)
for (j in 1:nrows) {
a<-table.row.start(a)
mydum <- 'Estimates ('
mydum <- paste(mydum,j)
mydum <- paste(mydum,')')
a<-table.element(a,mydum, header=TRUE)
for (i in 1:ncols) {
a<-table.element(a,round(selection[[1]][j,i],4))
}
a<-table.row.end(a)
a<-table.row.start(a)
a<-table.element(a,'(p-val)', header=TRUE)
for (i in 1:ncols) {
mydum <- '('
mydum <- paste(mydum,round(selection[[2]][j,i],4),sep='')
mydum <- paste(mydum,')')
a<-table.element(a,mydum)
}
a<-table.row.end(a)
}
a<-table.end(a)
table.save(a,file='mytable.tab')
a<-table.start()
a<-table.row.start(a)
a<-table.element(a,'Estimated ARIMA Residuals', 1,TRUE)
a<-table.row.end(a)
a<-table.row.start(a)
a<-table.element(a,'Value', 1,TRUE)
a<-table.row.end(a)
for (i in (par4*par5+par3):length(resid)) {
a<-table.row.start(a)
a<-table.element(a,resid[i])
a<-table.row.end(a)
}
a<-table.end(a)
table.save(a,file='mytable1.tab')