Free Statistics

of Irreproducible Research!

Author's title

Author*The author of this computation has been verified*
R Software Modulerwasp_arimabackwardselection.wasp
Title produced by softwareARIMA Backward Selection
Date of computationMon, 19 Dec 2016 20:20:03 +0100
Cite this page as followsStatistical Computations at FreeStatistics.org, Office for Research Development and Education, URL https://freestatistics.org/blog/index.php?v=date/2016/Dec/19/t14821752441x9ftp60slglqrl.htm/, Retrieved Fri, 01 Nov 2024 03:29:55 +0000
Statistical Computations at FreeStatistics.org, Office for Research Development and Education, URL https://freestatistics.org/blog/index.php?pk=301465, Retrieved Fri, 01 Nov 2024 03:29:55 +0000
QR Codes:

Original text written by user:
IsPrivate?No (this computation is public)
User-defined keywords
Estimated Impact98
Family? (F = Feedback message, R = changed R code, M = changed R Module, P = changed Parameters, D = changed Data)
-       [ARIMA Backward Selection] [n2141 - ARIMA 1.0] [2016-12-19 19:20:03] [f8e2c3c70b883e93ecb746821352be11] [Current]
Feedback Forum

Post a new message
Dataseries X:
4976
4994
5478
4712
4388
4210
3844
3850
3770
3584
3490
3060
3324
3406
4346
4076
4310
4148
3958
4296
4370
4476
4406
4076
4430
4534
5200
4960
5188
4958
4554
4310
3890
4214
3720
3606
4360
4262
4788
4780
4836
4492
4514
4770
4664
4906
4684
4320
4588
4372
4674
4794
4558
4260
3994
3394
3334
3412
3198
3196
3536
3272
3562
3900
3744
3886
3708
3700
3878
4152
3830
3864
3880
4230
4394
4076
4224
4026
3950
4086
4166
4270
4162
4030
4128
3958
4216
4096
4168
3948
3394
3660
3808
3684
3610
3598
3918
3764
3872
3710
4056
4010
3656
3884
3886
3880
3642
3272
3602
3198
3802
3402
3344
3508
3426
3394
3448
3554
3522
3472
3692
3690
3802
3814
3408
3650


Summary of computational transaction
Raw Input view raw input (R code)
Raw Outputview raw output of R engine
Computing time12 seconds
R ServerBig Analytics Cloud Computing Center

\begin{tabular}{lllllllll}
\hline
Summary of computational transaction \tabularnewline
Raw Input view raw input (R code)  \tabularnewline
Raw Outputview raw output of R engine  \tabularnewline
Computing time12 seconds \tabularnewline
R ServerBig Analytics Cloud Computing Center \tabularnewline
\hline
\end{tabular}
%Source: https://freestatistics.org/blog/index.php?pk=301465&T=0

[TABLE]
[ROW]
Summary of computational transaction[/C][/ROW] [ROW]Raw Input[/C] view raw input (R code) [/C][/ROW] [ROW]Raw Output[/C]view raw output of R engine [/C][/ROW] [ROW]Computing time[/C]12 seconds[/C][/ROW] [ROW]R Server[/C]Big Analytics Cloud Computing Center[/C][/ROW] [/TABLE] Source: https://freestatistics.org/blog/index.php?pk=301465&T=0

Globally Unique Identifier (entire table): ba.freestatistics.org/blog/index.php?pk=301465&T=0

As an alternative you can also use a QR Code:  

The GUIDs for individual cells are displayed in the table below:

Summary of computational transaction
Raw Input view raw input (R code)
Raw Outputview raw output of R engine
Computing time12 seconds
R ServerBig Analytics Cloud Computing Center


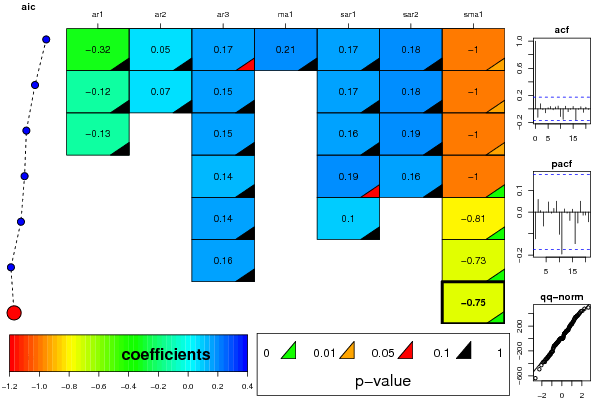
ARIMA Parameter Estimation and Backward Selection
Iterationar1ar2ar3ma1sar1sar2sma1
Estimates ( 1 )-0.31750.05130.1650.20550.17090.1782-0.9998
(p-val)(0.5002 )(0.6584 )(0.0921 )(0.6639 )(0.1484 )(0.1456 )(0.0119 )
Estimates ( 2 )-0.11670.07450.15200.17480.1788-0.9997
(p-val)(0.2353 )(0.4439 )(0.1239 )(NA )(0.1382 )(0.1431 )(0.0108 )
Estimates ( 3 )-0.128100.146700.1610.1925-1.0003
(p-val)(0.1915 )(NA )(0.137 )(NA )(0.1686 )(0.113 )(0.0326 )
Estimates ( 4 )000.136500.19340.1598-1.0001
(p-val)(NA )(NA )(0.1688 )(NA )(0.0895 )(0.1791 )(0.0088 )
Estimates ( 5 )000.144600.09870-0.8051
(p-val)(NA )(NA )(0.1552 )(NA )(0.5434 )(NA )(0 )
Estimates ( 6 )000.1578000-0.7255
(p-val)(NA )(NA )(0.1125 )(NA )(NA )(NA )(0 )
Estimates ( 7 )000000-0.7476
(p-val)(NA )(NA )(NA )(NA )(NA )(NA )(0 )
Estimates ( 8 )NANANANANANANA
(p-val)(NA )(NA )(NA )(NA )(NA )(NA )(NA )
Estimates ( 9 )NANANANANANANA
(p-val)(NA )(NA )(NA )(NA )(NA )(NA )(NA )
Estimates ( 10 )NANANANANANANA
(p-val)(NA )(NA )(NA )(NA )(NA )(NA )(NA )
Estimates ( 11 )NANANANANANANA
(p-val)(NA )(NA )(NA )(NA )(NA )(NA )(NA )
Estimates ( 12 )NANANANANANANA
(p-val)(NA )(NA )(NA )(NA )(NA )(NA )(NA )
Estimates ( 13 )NANANANANANANA
(p-val)(NA )(NA )(NA )(NA )(NA )(NA )(NA )

\begin{tabular}{lllllllll}
\hline
ARIMA Parameter Estimation and Backward Selection \tabularnewline
Iteration & ar1 & ar2 & ar3 & ma1 & sar1 & sar2 & sma1 \tabularnewline
Estimates ( 1 ) & -0.3175 & 0.0513 & 0.165 & 0.2055 & 0.1709 & 0.1782 & -0.9998 \tabularnewline
(p-val) & (0.5002 ) & (0.6584 ) & (0.0921 ) & (0.6639 ) & (0.1484 ) & (0.1456 ) & (0.0119 ) \tabularnewline
Estimates ( 2 ) & -0.1167 & 0.0745 & 0.152 & 0 & 0.1748 & 0.1788 & -0.9997 \tabularnewline
(p-val) & (0.2353 ) & (0.4439 ) & (0.1239 ) & (NA ) & (0.1382 ) & (0.1431 ) & (0.0108 ) \tabularnewline
Estimates ( 3 ) & -0.1281 & 0 & 0.1467 & 0 & 0.161 & 0.1925 & -1.0003 \tabularnewline
(p-val) & (0.1915 ) & (NA ) & (0.137 ) & (NA ) & (0.1686 ) & (0.113 ) & (0.0326 ) \tabularnewline
Estimates ( 4 ) & 0 & 0 & 0.1365 & 0 & 0.1934 & 0.1598 & -1.0001 \tabularnewline
(p-val) & (NA ) & (NA ) & (0.1688 ) & (NA ) & (0.0895 ) & (0.1791 ) & (0.0088 ) \tabularnewline
Estimates ( 5 ) & 0 & 0 & 0.1446 & 0 & 0.0987 & 0 & -0.8051 \tabularnewline
(p-val) & (NA ) & (NA ) & (0.1552 ) & (NA ) & (0.5434 ) & (NA ) & (0 ) \tabularnewline
Estimates ( 6 ) & 0 & 0 & 0.1578 & 0 & 0 & 0 & -0.7255 \tabularnewline
(p-val) & (NA ) & (NA ) & (0.1125 ) & (NA ) & (NA ) & (NA ) & (0 ) \tabularnewline
Estimates ( 7 ) & 0 & 0 & 0 & 0 & 0 & 0 & -0.7476 \tabularnewline
(p-val) & (NA ) & (NA ) & (NA ) & (NA ) & (NA ) & (NA ) & (0 ) \tabularnewline
Estimates ( 8 ) & NA & NA & NA & NA & NA & NA & NA \tabularnewline
(p-val) & (NA ) & (NA ) & (NA ) & (NA ) & (NA ) & (NA ) & (NA ) \tabularnewline
Estimates ( 9 ) & NA & NA & NA & NA & NA & NA & NA \tabularnewline
(p-val) & (NA ) & (NA ) & (NA ) & (NA ) & (NA ) & (NA ) & (NA ) \tabularnewline
Estimates ( 10 ) & NA & NA & NA & NA & NA & NA & NA \tabularnewline
(p-val) & (NA ) & (NA ) & (NA ) & (NA ) & (NA ) & (NA ) & (NA ) \tabularnewline
Estimates ( 11 ) & NA & NA & NA & NA & NA & NA & NA \tabularnewline
(p-val) & (NA ) & (NA ) & (NA ) & (NA ) & (NA ) & (NA ) & (NA ) \tabularnewline
Estimates ( 12 ) & NA & NA & NA & NA & NA & NA & NA \tabularnewline
(p-val) & (NA ) & (NA ) & (NA ) & (NA ) & (NA ) & (NA ) & (NA ) \tabularnewline
Estimates ( 13 ) & NA & NA & NA & NA & NA & NA & NA \tabularnewline
(p-val) & (NA ) & (NA ) & (NA ) & (NA ) & (NA ) & (NA ) & (NA ) \tabularnewline
\hline
\end{tabular}
%Source: https://freestatistics.org/blog/index.php?pk=301465&T=1

[TABLE]
[ROW][C]ARIMA Parameter Estimation and Backward Selection[/C][/ROW]
[ROW][C]Iteration[/C][C]ar1[/C][C]ar2[/C][C]ar3[/C][C]ma1[/C][C]sar1[/C][C]sar2[/C][C]sma1[/C][/ROW]
[ROW][C]Estimates ( 1 )[/C][C]-0.3175[/C][C]0.0513[/C][C]0.165[/C][C]0.2055[/C][C]0.1709[/C][C]0.1782[/C][C]-0.9998[/C][/ROW]
[ROW][C](p-val)[/C][C](0.5002 )[/C][C](0.6584 )[/C][C](0.0921 )[/C][C](0.6639 )[/C][C](0.1484 )[/C][C](0.1456 )[/C][C](0.0119 )[/C][/ROW]
[ROW][C]Estimates ( 2 )[/C][C]-0.1167[/C][C]0.0745[/C][C]0.152[/C][C]0[/C][C]0.1748[/C][C]0.1788[/C][C]-0.9997[/C][/ROW]
[ROW][C](p-val)[/C][C](0.2353 )[/C][C](0.4439 )[/C][C](0.1239 )[/C][C](NA )[/C][C](0.1382 )[/C][C](0.1431 )[/C][C](0.0108 )[/C][/ROW]
[ROW][C]Estimates ( 3 )[/C][C]-0.1281[/C][C]0[/C][C]0.1467[/C][C]0[/C][C]0.161[/C][C]0.1925[/C][C]-1.0003[/C][/ROW]
[ROW][C](p-val)[/C][C](0.1915 )[/C][C](NA )[/C][C](0.137 )[/C][C](NA )[/C][C](0.1686 )[/C][C](0.113 )[/C][C](0.0326 )[/C][/ROW]
[ROW][C]Estimates ( 4 )[/C][C]0[/C][C]0[/C][C]0.1365[/C][C]0[/C][C]0.1934[/C][C]0.1598[/C][C]-1.0001[/C][/ROW]
[ROW][C](p-val)[/C][C](NA )[/C][C](NA )[/C][C](0.1688 )[/C][C](NA )[/C][C](0.0895 )[/C][C](0.1791 )[/C][C](0.0088 )[/C][/ROW]
[ROW][C]Estimates ( 5 )[/C][C]0[/C][C]0[/C][C]0.1446[/C][C]0[/C][C]0.0987[/C][C]0[/C][C]-0.8051[/C][/ROW]
[ROW][C](p-val)[/C][C](NA )[/C][C](NA )[/C][C](0.1552 )[/C][C](NA )[/C][C](0.5434 )[/C][C](NA )[/C][C](0 )[/C][/ROW]
[ROW][C]Estimates ( 6 )[/C][C]0[/C][C]0[/C][C]0.1578[/C][C]0[/C][C]0[/C][C]0[/C][C]-0.7255[/C][/ROW]
[ROW][C](p-val)[/C][C](NA )[/C][C](NA )[/C][C](0.1125 )[/C][C](NA )[/C][C](NA )[/C][C](NA )[/C][C](0 )[/C][/ROW]
[ROW][C]Estimates ( 7 )[/C][C]0[/C][C]0[/C][C]0[/C][C]0[/C][C]0[/C][C]0[/C][C]-0.7476[/C][/ROW]
[ROW][C](p-val)[/C][C](NA )[/C][C](NA )[/C][C](NA )[/C][C](NA )[/C][C](NA )[/C][C](NA )[/C][C](0 )[/C][/ROW]
[ROW][C]Estimates ( 8 )[/C][C]NA[/C][C]NA[/C][C]NA[/C][C]NA[/C][C]NA[/C][C]NA[/C][C]NA[/C][/ROW]
[ROW][C](p-val)[/C][C](NA )[/C][C](NA )[/C][C](NA )[/C][C](NA )[/C][C](NA )[/C][C](NA )[/C][C](NA )[/C][/ROW]
[ROW][C]Estimates ( 9 )[/C][C]NA[/C][C]NA[/C][C]NA[/C][C]NA[/C][C]NA[/C][C]NA[/C][C]NA[/C][/ROW]
[ROW][C](p-val)[/C][C](NA )[/C][C](NA )[/C][C](NA )[/C][C](NA )[/C][C](NA )[/C][C](NA )[/C][C](NA )[/C][/ROW]
[ROW][C]Estimates ( 10 )[/C][C]NA[/C][C]NA[/C][C]NA[/C][C]NA[/C][C]NA[/C][C]NA[/C][C]NA[/C][/ROW]
[ROW][C](p-val)[/C][C](NA )[/C][C](NA )[/C][C](NA )[/C][C](NA )[/C][C](NA )[/C][C](NA )[/C][C](NA )[/C][/ROW]
[ROW][C]Estimates ( 11 )[/C][C]NA[/C][C]NA[/C][C]NA[/C][C]NA[/C][C]NA[/C][C]NA[/C][C]NA[/C][/ROW]
[ROW][C](p-val)[/C][C](NA )[/C][C](NA )[/C][C](NA )[/C][C](NA )[/C][C](NA )[/C][C](NA )[/C][C](NA )[/C][/ROW]
[ROW][C]Estimates ( 12 )[/C][C]NA[/C][C]NA[/C][C]NA[/C][C]NA[/C][C]NA[/C][C]NA[/C][C]NA[/C][/ROW]
[ROW][C](p-val)[/C][C](NA )[/C][C](NA )[/C][C](NA )[/C][C](NA )[/C][C](NA )[/C][C](NA )[/C][C](NA )[/C][/ROW]
[ROW][C]Estimates ( 13 )[/C][C]NA[/C][C]NA[/C][C]NA[/C][C]NA[/C][C]NA[/C][C]NA[/C][C]NA[/C][/ROW]
[ROW][C](p-val)[/C][C](NA )[/C][C](NA )[/C][C](NA )[/C][C](NA )[/C][C](NA )[/C][C](NA )[/C][C](NA )[/C][/ROW]
[/TABLE]
Source: https://freestatistics.org/blog/index.php?pk=301465&T=1

Globally Unique Identifier (entire table): ba.freestatistics.org/blog/index.php?pk=301465&T=1

As an alternative you can also use a QR Code:  

The GUIDs for individual cells are displayed in the table below:

ARIMA Parameter Estimation and Backward Selection
Iterationar1ar2ar3ma1sar1sar2sma1
Estimates ( 1 )-0.31750.05130.1650.20550.17090.1782-0.9998
(p-val)(0.5002 )(0.6584 )(0.0921 )(0.6639 )(0.1484 )(0.1456 )(0.0119 )
Estimates ( 2 )-0.11670.07450.15200.17480.1788-0.9997
(p-val)(0.2353 )(0.4439 )(0.1239 )(NA )(0.1382 )(0.1431 )(0.0108 )
Estimates ( 3 )-0.128100.146700.1610.1925-1.0003
(p-val)(0.1915 )(NA )(0.137 )(NA )(0.1686 )(0.113 )(0.0326 )
Estimates ( 4 )000.136500.19340.1598-1.0001
(p-val)(NA )(NA )(0.1688 )(NA )(0.0895 )(0.1791 )(0.0088 )
Estimates ( 5 )000.144600.09870-0.8051
(p-val)(NA )(NA )(0.1552 )(NA )(0.5434 )(NA )(0 )
Estimates ( 6 )000.1578000-0.7255
(p-val)(NA )(NA )(0.1125 )(NA )(NA )(NA )(0 )
Estimates ( 7 )000000-0.7476
(p-val)(NA )(NA )(NA )(NA )(NA )(NA )(0 )
Estimates ( 8 )NANANANANANANA
(p-val)(NA )(NA )(NA )(NA )(NA )(NA )(NA )
Estimates ( 9 )NANANANANANANA
(p-val)(NA )(NA )(NA )(NA )(NA )(NA )(NA )
Estimates ( 10 )NANANANANANANA
(p-val)(NA )(NA )(NA )(NA )(NA )(NA )(NA )
Estimates ( 11 )NANANANANANANA
(p-val)(NA )(NA )(NA )(NA )(NA )(NA )(NA )
Estimates ( 12 )NANANANANANANA
(p-val)(NA )(NA )(NA )(NA )(NA )(NA )(NA )
Estimates ( 13 )NANANANANANANA
(p-val)(NA )(NA )(NA )(NA )(NA )(NA )(NA )


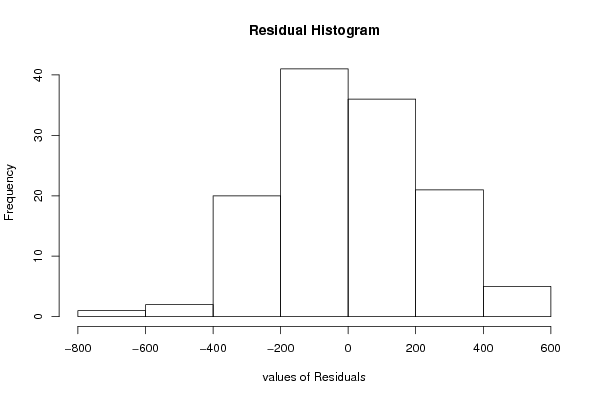
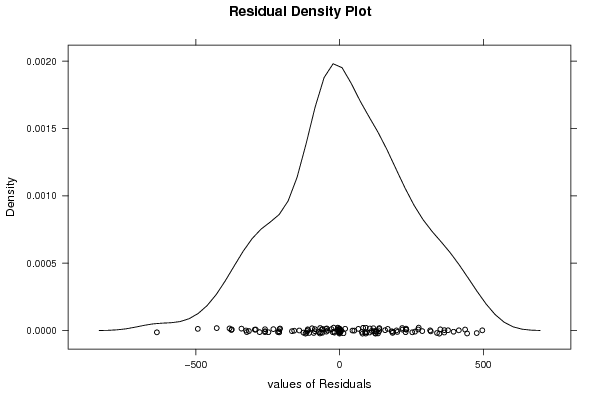
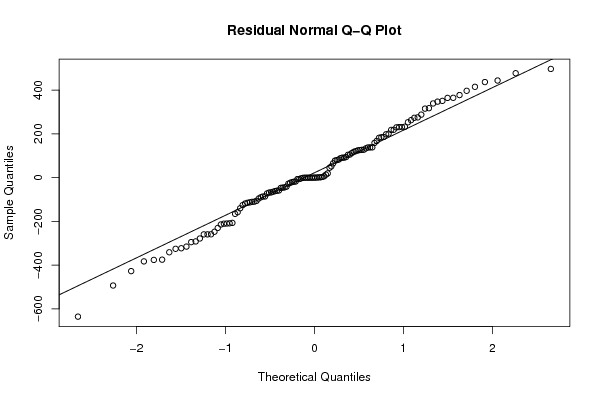
Estimated ARIMA Residuals
Value
-20.7255792605697
51.1730083230995
364.584954309629
396.563324072351
443.560523351816
-44.6408477162737
79.8148182471269
198.055660824557
126.841023560082
218.488009710104
-19.0392656090287
88.5911378698456
65.2682360897622
44.8579293496602
-67.5979344216213
229.55317954745
230.940813859739
-46.9302004742101
-157.984268694817
-427.429402856871
-376.276372590741
350.480307508112
-315.405812226057
317.174039569544
377.125686734109
-106.297889098779
-206.985390295338
314.973420636291
13.4375086992769
-118.572243688164
273.21026206406
232.421530049615
77.5413025670385
82.0021738996598
-17.8562608585248
-86.1468827769171
-209.971829705431
-230.300217913333
-322.869855017402
414.796154022729
-258.980935417113
-1.40561721985836
-115.26061689122
-635.51249349541
90.8577745286899
-59.9163597942485
127.125983517245
287.706910297163
-46.0856744097104
-210.86790477281
-294.884539205336
496.462598535023
-95.776885205666
436.550984814557
-28.110827360023
125.837926523645
230.861478076635
138.267986113014
-110.273816889196
200.660100389585
-382.94131501803
476.961454220868
-341.305598174038
-247.5642276766
137.629188374798
-6.50185068553642
184.356419128732
185.554691185865
120.811803580155
-86.3776188142889
111.994006864084
-6.70128318929939
-165.712809760531
-208.870558761589
-125.769200009303
6.2507639061747
105.097142024869
-41.4149059368903
-375.175218500479
275.165499790399
158.234598181987
-214.354188779043
93.9674056507312
104.091831199731
137.997046485534
-140.223899331786
-259.50405282694
-72.363837812229
347.02919379578
167.465609911943
-64.7331872160749
117.688476015313
-58.8944643161926
-68.5537161520938
-89.928379544078
-259.36279164381
91.0829412408438
-325.474442242352
364.165090490723
-291.76469604537
-113.068008567998
252.877017936257
262.461378075562
-110.924111448509
-23.7746770525645
19.3995423157701
181.692183966881
123.861123302996
-61.6834591526375
133.519085116483
-278.375191728305
217.757984142686
-493.202800738359
338.814436106487

\begin{tabular}{lllllllll}
\hline
Estimated ARIMA Residuals \tabularnewline
Value \tabularnewline
-20.7255792605697 \tabularnewline
51.1730083230995 \tabularnewline
364.584954309629 \tabularnewline
396.563324072351 \tabularnewline
443.560523351816 \tabularnewline
-44.6408477162737 \tabularnewline
79.8148182471269 \tabularnewline
198.055660824557 \tabularnewline
126.841023560082 \tabularnewline
218.488009710104 \tabularnewline
-19.0392656090287 \tabularnewline
88.5911378698456 \tabularnewline
65.2682360897622 \tabularnewline
44.8579293496602 \tabularnewline
-67.5979344216213 \tabularnewline
229.55317954745 \tabularnewline
230.940813859739 \tabularnewline
-46.9302004742101 \tabularnewline
-157.984268694817 \tabularnewline
-427.429402856871 \tabularnewline
-376.276372590741 \tabularnewline
350.480307508112 \tabularnewline
-315.405812226057 \tabularnewline
317.174039569544 \tabularnewline
377.125686734109 \tabularnewline
-106.297889098779 \tabularnewline
-206.985390295338 \tabularnewline
314.973420636291 \tabularnewline
13.4375086992769 \tabularnewline
-118.572243688164 \tabularnewline
273.21026206406 \tabularnewline
232.421530049615 \tabularnewline
77.5413025670385 \tabularnewline
82.0021738996598 \tabularnewline
-17.8562608585248 \tabularnewline
-86.1468827769171 \tabularnewline
-209.971829705431 \tabularnewline
-230.300217913333 \tabularnewline
-322.869855017402 \tabularnewline
414.796154022729 \tabularnewline
-258.980935417113 \tabularnewline
-1.40561721985836 \tabularnewline
-115.26061689122 \tabularnewline
-635.51249349541 \tabularnewline
90.8577745286899 \tabularnewline
-59.9163597942485 \tabularnewline
127.125983517245 \tabularnewline
287.706910297163 \tabularnewline
-46.0856744097104 \tabularnewline
-210.86790477281 \tabularnewline
-294.884539205336 \tabularnewline
496.462598535023 \tabularnewline
-95.776885205666 \tabularnewline
436.550984814557 \tabularnewline
-28.110827360023 \tabularnewline
125.837926523645 \tabularnewline
230.861478076635 \tabularnewline
138.267986113014 \tabularnewline
-110.273816889196 \tabularnewline
200.660100389585 \tabularnewline
-382.94131501803 \tabularnewline
476.961454220868 \tabularnewline
-341.305598174038 \tabularnewline
-247.5642276766 \tabularnewline
137.629188374798 \tabularnewline
-6.50185068553642 \tabularnewline
184.356419128732 \tabularnewline
185.554691185865 \tabularnewline
120.811803580155 \tabularnewline
-86.3776188142889 \tabularnewline
111.994006864084 \tabularnewline
-6.70128318929939 \tabularnewline
-165.712809760531 \tabularnewline
-208.870558761589 \tabularnewline
-125.769200009303 \tabularnewline
6.2507639061747 \tabularnewline
105.097142024869 \tabularnewline
-41.4149059368903 \tabularnewline
-375.175218500479 \tabularnewline
275.165499790399 \tabularnewline
158.234598181987 \tabularnewline
-214.354188779043 \tabularnewline
93.9674056507312 \tabularnewline
104.091831199731 \tabularnewline
137.997046485534 \tabularnewline
-140.223899331786 \tabularnewline
-259.50405282694 \tabularnewline
-72.363837812229 \tabularnewline
347.02919379578 \tabularnewline
167.465609911943 \tabularnewline
-64.7331872160749 \tabularnewline
117.688476015313 \tabularnewline
-58.8944643161926 \tabularnewline
-68.5537161520938 \tabularnewline
-89.928379544078 \tabularnewline
-259.36279164381 \tabularnewline
91.0829412408438 \tabularnewline
-325.474442242352 \tabularnewline
364.165090490723 \tabularnewline
-291.76469604537 \tabularnewline
-113.068008567998 \tabularnewline
252.877017936257 \tabularnewline
262.461378075562 \tabularnewline
-110.924111448509 \tabularnewline
-23.7746770525645 \tabularnewline
19.3995423157701 \tabularnewline
181.692183966881 \tabularnewline
123.861123302996 \tabularnewline
-61.6834591526375 \tabularnewline
133.519085116483 \tabularnewline
-278.375191728305 \tabularnewline
217.757984142686 \tabularnewline
-493.202800738359 \tabularnewline
338.814436106487 \tabularnewline
\hline
\end{tabular}
%Source: https://freestatistics.org/blog/index.php?pk=301465&T=2

[TABLE]
[ROW][C]Estimated ARIMA Residuals[/C][/ROW]
[ROW][C]Value[/C][/ROW]
[ROW][C]-20.7255792605697[/C][/ROW]
[ROW][C]51.1730083230995[/C][/ROW]
[ROW][C]364.584954309629[/C][/ROW]
[ROW][C]396.563324072351[/C][/ROW]
[ROW][C]443.560523351816[/C][/ROW]
[ROW][C]-44.6408477162737[/C][/ROW]
[ROW][C]79.8148182471269[/C][/ROW]
[ROW][C]198.055660824557[/C][/ROW]
[ROW][C]126.841023560082[/C][/ROW]
[ROW][C]218.488009710104[/C][/ROW]
[ROW][C]-19.0392656090287[/C][/ROW]
[ROW][C]88.5911378698456[/C][/ROW]
[ROW][C]65.2682360897622[/C][/ROW]
[ROW][C]44.8579293496602[/C][/ROW]
[ROW][C]-67.5979344216213[/C][/ROW]
[ROW][C]229.55317954745[/C][/ROW]
[ROW][C]230.940813859739[/C][/ROW]
[ROW][C]-46.9302004742101[/C][/ROW]
[ROW][C]-157.984268694817[/C][/ROW]
[ROW][C]-427.429402856871[/C][/ROW]
[ROW][C]-376.276372590741[/C][/ROW]
[ROW][C]350.480307508112[/C][/ROW]
[ROW][C]-315.405812226057[/C][/ROW]
[ROW][C]317.174039569544[/C][/ROW]
[ROW][C]377.125686734109[/C][/ROW]
[ROW][C]-106.297889098779[/C][/ROW]
[ROW][C]-206.985390295338[/C][/ROW]
[ROW][C]314.973420636291[/C][/ROW]
[ROW][C]13.4375086992769[/C][/ROW]
[ROW][C]-118.572243688164[/C][/ROW]
[ROW][C]273.21026206406[/C][/ROW]
[ROW][C]232.421530049615[/C][/ROW]
[ROW][C]77.5413025670385[/C][/ROW]
[ROW][C]82.0021738996598[/C][/ROW]
[ROW][C]-17.8562608585248[/C][/ROW]
[ROW][C]-86.1468827769171[/C][/ROW]
[ROW][C]-209.971829705431[/C][/ROW]
[ROW][C]-230.300217913333[/C][/ROW]
[ROW][C]-322.869855017402[/C][/ROW]
[ROW][C]414.796154022729[/C][/ROW]
[ROW][C]-258.980935417113[/C][/ROW]
[ROW][C]-1.40561721985836[/C][/ROW]
[ROW][C]-115.26061689122[/C][/ROW]
[ROW][C]-635.51249349541[/C][/ROW]
[ROW][C]90.8577745286899[/C][/ROW]
[ROW][C]-59.9163597942485[/C][/ROW]
[ROW][C]127.125983517245[/C][/ROW]
[ROW][C]287.706910297163[/C][/ROW]
[ROW][C]-46.0856744097104[/C][/ROW]
[ROW][C]-210.86790477281[/C][/ROW]
[ROW][C]-294.884539205336[/C][/ROW]
[ROW][C]496.462598535023[/C][/ROW]
[ROW][C]-95.776885205666[/C][/ROW]
[ROW][C]436.550984814557[/C][/ROW]
[ROW][C]-28.110827360023[/C][/ROW]
[ROW][C]125.837926523645[/C][/ROW]
[ROW][C]230.861478076635[/C][/ROW]
[ROW][C]138.267986113014[/C][/ROW]
[ROW][C]-110.273816889196[/C][/ROW]
[ROW][C]200.660100389585[/C][/ROW]
[ROW][C]-382.94131501803[/C][/ROW]
[ROW][C]476.961454220868[/C][/ROW]
[ROW][C]-341.305598174038[/C][/ROW]
[ROW][C]-247.5642276766[/C][/ROW]
[ROW][C]137.629188374798[/C][/ROW]
[ROW][C]-6.50185068553642[/C][/ROW]
[ROW][C]184.356419128732[/C][/ROW]
[ROW][C]185.554691185865[/C][/ROW]
[ROW][C]120.811803580155[/C][/ROW]
[ROW][C]-86.3776188142889[/C][/ROW]
[ROW][C]111.994006864084[/C][/ROW]
[ROW][C]-6.70128318929939[/C][/ROW]
[ROW][C]-165.712809760531[/C][/ROW]
[ROW][C]-208.870558761589[/C][/ROW]
[ROW][C]-125.769200009303[/C][/ROW]
[ROW][C]6.2507639061747[/C][/ROW]
[ROW][C]105.097142024869[/C][/ROW]
[ROW][C]-41.4149059368903[/C][/ROW]
[ROW][C]-375.175218500479[/C][/ROW]
[ROW][C]275.165499790399[/C][/ROW]
[ROW][C]158.234598181987[/C][/ROW]
[ROW][C]-214.354188779043[/C][/ROW]
[ROW][C]93.9674056507312[/C][/ROW]
[ROW][C]104.091831199731[/C][/ROW]
[ROW][C]137.997046485534[/C][/ROW]
[ROW][C]-140.223899331786[/C][/ROW]
[ROW][C]-259.50405282694[/C][/ROW]
[ROW][C]-72.363837812229[/C][/ROW]
[ROW][C]347.02919379578[/C][/ROW]
[ROW][C]167.465609911943[/C][/ROW]
[ROW][C]-64.7331872160749[/C][/ROW]
[ROW][C]117.688476015313[/C][/ROW]
[ROW][C]-58.8944643161926[/C][/ROW]
[ROW][C]-68.5537161520938[/C][/ROW]
[ROW][C]-89.928379544078[/C][/ROW]
[ROW][C]-259.36279164381[/C][/ROW]
[ROW][C]91.0829412408438[/C][/ROW]
[ROW][C]-325.474442242352[/C][/ROW]
[ROW][C]364.165090490723[/C][/ROW]
[ROW][C]-291.76469604537[/C][/ROW]
[ROW][C]-113.068008567998[/C][/ROW]
[ROW][C]252.877017936257[/C][/ROW]
[ROW][C]262.461378075562[/C][/ROW]
[ROW][C]-110.924111448509[/C][/ROW]
[ROW][C]-23.7746770525645[/C][/ROW]
[ROW][C]19.3995423157701[/C][/ROW]
[ROW][C]181.692183966881[/C][/ROW]
[ROW][C]123.861123302996[/C][/ROW]
[ROW][C]-61.6834591526375[/C][/ROW]
[ROW][C]133.519085116483[/C][/ROW]
[ROW][C]-278.375191728305[/C][/ROW]
[ROW][C]217.757984142686[/C][/ROW]
[ROW][C]-493.202800738359[/C][/ROW]
[ROW][C]338.814436106487[/C][/ROW]
[/TABLE]
Source: https://freestatistics.org/blog/index.php?pk=301465&T=2

Globally Unique Identifier (entire table): ba.freestatistics.org/blog/index.php?pk=301465&T=2

As an alternative you can also use a QR Code:  

The GUIDs for individual cells are displayed in the table below:

Estimated ARIMA Residuals
Value
-20.7255792605697
51.1730083230995
364.584954309629
396.563324072351
443.560523351816
-44.6408477162737
79.8148182471269
198.055660824557
126.841023560082
218.488009710104
-19.0392656090287
88.5911378698456
65.2682360897622
44.8579293496602
-67.5979344216213
229.55317954745
230.940813859739
-46.9302004742101
-157.984268694817
-427.429402856871
-376.276372590741
350.480307508112
-315.405812226057
317.174039569544
377.125686734109
-106.297889098779
-206.985390295338
314.973420636291
13.4375086992769
-118.572243688164
273.21026206406
232.421530049615
77.5413025670385
82.0021738996598
-17.8562608585248
-86.1468827769171
-209.971829705431
-230.300217913333
-322.869855017402
414.796154022729
-258.980935417113
-1.40561721985836
-115.26061689122
-635.51249349541
90.8577745286899
-59.9163597942485
127.125983517245
287.706910297163
-46.0856744097104
-210.86790477281
-294.884539205336
496.462598535023
-95.776885205666
436.550984814557
-28.110827360023
125.837926523645
230.861478076635
138.267986113014
-110.273816889196
200.660100389585
-382.94131501803
476.961454220868
-341.305598174038
-247.5642276766
137.629188374798
-6.50185068553642
184.356419128732
185.554691185865
120.811803580155
-86.3776188142889
111.994006864084
-6.70128318929939
-165.712809760531
-208.870558761589
-125.769200009303
6.2507639061747
105.097142024869
-41.4149059368903
-375.175218500479
275.165499790399
158.234598181987
-214.354188779043
93.9674056507312
104.091831199731
137.997046485534
-140.223899331786
-259.50405282694
-72.363837812229
347.02919379578
167.465609911943
-64.7331872160749
117.688476015313
-58.8944643161926
-68.5537161520938
-89.928379544078
-259.36279164381
91.0829412408438
-325.474442242352
364.165090490723
-291.76469604537
-113.068008567998
252.877017936257
262.461378075562
-110.924111448509
-23.7746770525645
19.3995423157701
181.692183966881
123.861123302996
-61.6834591526375
133.519085116483
-278.375191728305
217.757984142686
-493.202800738359
338.814436106487


Parameters (Session):
par1 = Default ; par2 = 1 ; par3 = 1 ; par4 = 0 ; par5 = 12 ; par6 = White Noise ; par7 = 0.95 ;
Parameters (R input):
par1 = FALSE ; par2 = 1 ; par3 = 1 ; par4 = 1 ; par5 = 12 ; par6 = 3 ; par7 = 1 ; par8 = 2 ; par9 = 1 ;
R code (references can be found in the software module):
par9 <- '0'
par8 <- '2'
par7 <- '0'
par6 <- '1'
par5 <- '1'
par4 <- '1'
par3 <- '1'
par2 <- '1'
par1 <- 'FALSE'
library(lattice)
if (par1 == 'TRUE') par1 <- TRUE
if (par1 == 'FALSE') par1 <- FALSE
par2 <- as.numeric(par2) #Box-Cox lambda transformation parameter
par3 <- as.numeric(par3) #degree of non-seasonal differencing
par4 <- as.numeric(par4) #degree of seasonal differencing
par5 <- as.numeric(par5) #seasonal period
par6 <- as.numeric(par6) #degree (p) of the non-seasonal AR(p) polynomial
par7 <- as.numeric(par7) #degree (q) of the non-seasonal MA(q) polynomial
par8 <- as.numeric(par8) #degree (P) of the seasonal AR(P) polynomial
par9 <- as.numeric(par9) #degree (Q) of the seasonal MA(Q) polynomial
armaGR <- function(arima.out, names, n){
try1 <- arima.out$coef
try2 <- sqrt(diag(arima.out$var.coef))
try.data.frame <- data.frame(matrix(NA,ncol=4,nrow=length(names)))
dimnames(try.data.frame) <- list(names,c('coef','std','tstat','pv'))
try.data.frame[,1] <- try1
for(i in 1:length(try2)) try.data.frame[which(rownames(try.data.frame)==names(try2)[i]),2] <- try2[i]
try.data.frame[,3] <- try.data.frame[,1] / try.data.frame[,2]
try.data.frame[,4] <- round((1-pt(abs(try.data.frame[,3]),df=n-(length(try2)+1)))*2,5)
vector <- rep(NA,length(names))
vector[is.na(try.data.frame[,4])] <- 0
maxi <- which.max(try.data.frame[,4])
continue <- max(try.data.frame[,4],na.rm=TRUE) > .05
vector[maxi] <- 0
list(summary=try.data.frame,next.vector=vector,continue=continue)
}
arimaSelect <- function(series, order=c(13,0,0), seasonal=list(order=c(2,0,0),period=12), include.mean=F){
nrc <- order[1]+order[3]+seasonal$order[1]+seasonal$order[3]
coeff <- matrix(NA, nrow=nrc*2, ncol=nrc)
pval <- matrix(NA, nrow=nrc*2, ncol=nrc)
mylist <- rep(list(NULL), nrc)
names <- NULL
if(order[1] > 0) names <- paste('ar',1:order[1],sep='')
if(order[3] > 0) names <- c( names , paste('ma',1:order[3],sep='') )
if(seasonal$order[1] > 0) names <- c(names, paste('sar',1:seasonal$order[1],sep=''))
if(seasonal$order[3] > 0) names <- c(names, paste('sma',1:seasonal$order[3],sep=''))
arima.out <- arima(series, order=order, seasonal=seasonal, include.mean=include.mean, method='ML')
mylist[[1]] <- arima.out
last.arma <- armaGR(arima.out, names, length(series))
mystop <- FALSE
i <- 1
coeff[i,] <- last.arma[[1]][,1]
pval [i,] <- last.arma[[1]][,4]
i <- 2
aic <- arima.out$aic
while(!mystop){
mylist[[i]] <- arima.out
arima.out <- arima(series, order=order, seasonal=seasonal, include.mean=include.mean, method='ML', fixed=last.arma$next.vector)
aic <- c(aic, arima.out$aic)
last.arma <- armaGR(arima.out, names, length(series))
mystop <- !last.arma$continue
coeff[i,] <- last.arma[[1]][,1]
pval [i,] <- last.arma[[1]][,4]
i <- i+1
}
list(coeff, pval, mylist, aic=aic)
}
arimaSelectplot <- function(arimaSelect.out,noms,choix){
noms <- names(arimaSelect.out[[3]][[1]]$coef)
coeff <- arimaSelect.out[[1]]
k <- min(which(is.na(coeff[,1])))-1
coeff <- coeff[1:k,]
pval <- arimaSelect.out[[2]][1:k,]
aic <- arimaSelect.out$aic[1:k]
coeff[coeff==0] <- NA
n <- ncol(coeff)
if(missing(choix)) choix <- k
layout(matrix(c(1,1,1,2,
3,3,3,2,
3,3,3,4,
5,6,7,7),nr=4),
widths=c(10,35,45,15),
heights=c(30,30,15,15))
couleurs <- rainbow(75)[1:50]#(50)
ticks <- pretty(coeff)
par(mar=c(1,1,3,1))
plot(aic,k:1-.5,type='o',pch=21,bg='blue',cex=2,axes=F,lty=2,xpd=NA)
points(aic[choix],k-choix+.5,pch=21,cex=4,bg=2,xpd=NA)
title('aic',line=2)
par(mar=c(3,0,0,0))
plot(0,axes=F,xlab='',ylab='',xlim=range(ticks),ylim=c(.1,1))
rect(xleft = min(ticks) + (0:49)/50*(max(ticks)-min(ticks)),
xright = min(ticks) + (1:50)/50*(max(ticks)-min(ticks)),
ytop = rep(1,50),
ybottom= rep(0,50),col=couleurs,border=NA)
axis(1,ticks)
rect(xleft=min(ticks),xright=max(ticks),ytop=1,ybottom=0)
text(mean(coeff,na.rm=T),.5,'coefficients',cex=2,font=2)
par(mar=c(1,1,3,1))
image(1:n,1:k,t(coeff[k:1,]),axes=F,col=couleurs,zlim=range(ticks))
for(i in 1:n) for(j in 1:k) if(!is.na(coeff[j,i])) {
if(pval[j,i]<.01) symb = 'green'
else if( (pval[j,i]<.05) & (pval[j,i]>=.01)) symb = 'orange'
else if( (pval[j,i]<.1) & (pval[j,i]>=.05)) symb = 'red'
else symb = 'black'
polygon(c(i+.5 ,i+.2 ,i+.5 ,i+.5),
c(k-j+0.5,k-j+0.5,k-j+0.8,k-j+0.5),
col=symb)
if(j==choix) {
rect(xleft=i-.5,
xright=i+.5,
ybottom=k-j+1.5,
ytop=k-j+.5,
lwd=4)
text(i,
k-j+1,
round(coeff[j,i],2),
cex=1.2,
font=2)
}
else{
rect(xleft=i-.5,xright=i+.5,ybottom=k-j+1.5,ytop=k-j+.5)
text(i,k-j+1,round(coeff[j,i],2),cex=1.2,font=1)
}
}
axis(3,1:n,noms)
par(mar=c(0.5,0,0,0.5))
plot(0,axes=F,xlab='',ylab='',type='n',xlim=c(0,8),ylim=c(-.2,.8))
cols <- c('green','orange','red','black')
niv <- c('0','0.01','0.05','0.1')
for(i in 0:3){
polygon(c(1+2*i ,1+2*i ,1+2*i-.5 ,1+2*i),
c(.4 ,.7 , .4 , .4),
col=cols[i+1])
text(2*i,0.5,niv[i+1],cex=1.5)
}
text(8,.5,1,cex=1.5)
text(4,0,'p-value',cex=2)
box()
residus <- arimaSelect.out[[3]][[choix]]$res
par(mar=c(1,2,4,1))
acf(residus,main='')
title('acf',line=.5)
par(mar=c(1,2,4,1))
pacf(residus,main='')
title('pacf',line=.5)
par(mar=c(2,2,4,1))
qqnorm(residus,main='')
title('qq-norm',line=.5)
qqline(residus)
residus
}
if (par2 == 0) x <- log(x)
if (par2 != 0) x <- x^par2
(selection <- arimaSelect(x, order=c(par6,par3,par7), seasonal=list(order=c(par8,par4,par9), period=par5)))
bitmap(file='test1.png')
resid <- arimaSelectplot(selection)
dev.off()
resid
bitmap(file='test2.png')
acf(resid,length(resid)/2, main='Residual Autocorrelation Function')
dev.off()
bitmap(file='test3.png')
pacf(resid,length(resid)/2, main='Residual Partial Autocorrelation Function')
dev.off()
bitmap(file='test4.png')
cpgram(resid, main='Residual Cumulative Periodogram')
dev.off()
bitmap(file='test5.png')
hist(resid, main='Residual Histogram', xlab='values of Residuals')
dev.off()
bitmap(file='test6.png')
densityplot(~resid,col='black',main='Residual Density Plot', xlab='values of Residuals')
dev.off()
bitmap(file='test7.png')
qqnorm(resid, main='Residual Normal Q-Q Plot')
qqline(resid)
dev.off()
ncols <- length(selection[[1]][1,])
nrows <- length(selection[[2]][,1])-1
load(file='createtable')
a<-table.start()
a<-table.row.start(a)
a<-table.element(a,'ARIMA Parameter Estimation and Backward Selection', ncols+1,TRUE)
a<-table.row.end(a)
a<-table.row.start(a)
a<-table.element(a,'Iteration', header=TRUE)
for (i in 1:ncols) {
a<-table.element(a,names(selection[[3]][[1]]$coef)[i],header=TRUE)
}
a<-table.row.end(a)
for (j in 1:nrows) {
a<-table.row.start(a)
mydum <- 'Estimates ('
mydum <- paste(mydum,j)
mydum <- paste(mydum,')')
a<-table.element(a,mydum, header=TRUE)
for (i in 1:ncols) {
a<-table.element(a,round(selection[[1]][j,i],4))
}
a<-table.row.end(a)
a<-table.row.start(a)
a<-table.element(a,'(p-val)', header=TRUE)
for (i in 1:ncols) {
mydum <- '('
mydum <- paste(mydum,round(selection[[2]][j,i],4),sep='')
mydum <- paste(mydum,')')
a<-table.element(a,mydum)
}
a<-table.row.end(a)
}
a<-table.end(a)
table.save(a,file='mytable.tab')
a<-table.start()
a<-table.row.start(a)
a<-table.element(a,'Estimated ARIMA Residuals', 1,TRUE)
a<-table.row.end(a)
a<-table.row.start(a)
a<-table.element(a,'Value', 1,TRUE)
a<-table.row.end(a)
for (i in (par4*par5+par3):length(resid)) {
a<-table.row.start(a)
a<-table.element(a,resid[i])
a<-table.row.end(a)
}
a<-table.end(a)
table.save(a,file='mytable1.tab')