Free Statistics

of Irreproducible Research!

Author's title

Author*The author of this computation has been verified*
R Software Modulerwasp_autocorrelation.wasp
Title produced by software(Partial) Autocorrelation Function
Date of computationMon, 19 Dec 2016 17:52:24 +0100
Cite this page as followsStatistical Computations at FreeStatistics.org, Office for Research Development and Education, URL https://freestatistics.org/blog/index.php?v=date/2016/Dec/19/t1482166540tld5hza47rb0ds6.htm/, Retrieved Fri, 01 Nov 2024 03:30:55 +0000
Statistical Computations at FreeStatistics.org, Office for Research Development and Education, URL https://freestatistics.org/blog/index.php?pk=301425, Retrieved Fri, 01 Nov 2024 03:30:55 +0000
QR Codes:

Original text written by user:
IsPrivate?No (this computation is public)
User-defined keywords
Estimated Impact104
Family? (F = Feedback message, R = changed R code, M = changed R Module, P = changed Parameters, D = changed Data)
-       [(Partial) Autocorrelation Function] [Auto d =1] [2016-12-19 16:52:24] [e8b5e2ae4a4517822f644e6c122e1af0] [Current]
Feedback Forum

Post a new message
Dataseries X:
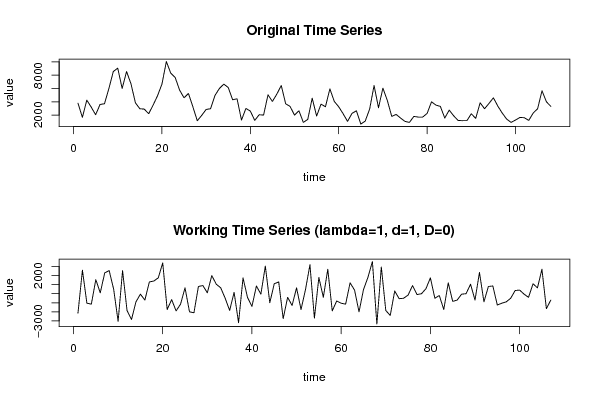
3800
1650
4250
3200
2050
3600
3700
6000
8550
9050
6000
8550
6700
3850
2950
2900
2200
3500
4900
6650
10050
8300
7650
5750
4600
5250
3250
1150
1950
2850
2950
4950
6000
6650
6150
4300
4450
1250
3000
2600
1200
2050
2000
5050
4050
5150
6450
3700
3300
2000
2650
900
1350
4550
1850
3650
3250
5950
4050
3250
2200
1050
2250
2650
650
1100
2900
6450
3100
6050
4200
1800
2100
1550
1050
900
1800
1700
1700
2250
4000
3500
3300
1550
2750
1900
1200
1150
1150
2200
1500
3850
2950
3750
4600
3350
2300
1400
900
1250
1650
1600
1200
2300
2950
5650
4000
3300


Summary of computational transaction
Raw Input view raw input (R code)
Raw Outputview raw output of R engine
Computing time1 seconds
R ServerBig Analytics Cloud Computing Center

\begin{tabular}{lllllllll}
\hline
Summary of computational transaction \tabularnewline
Raw Input view raw input (R code)  \tabularnewline
Raw Outputview raw output of R engine  \tabularnewline
Computing time1 seconds \tabularnewline
R ServerBig Analytics Cloud Computing Center \tabularnewline
\hline
\end{tabular}
%Source: https://freestatistics.org/blog/index.php?pk=301425&T=0

[TABLE]
[ROW]
Summary of computational transaction[/C][/ROW] [ROW]Raw Input[/C] view raw input (R code) [/C][/ROW] [ROW]Raw Output[/C]view raw output of R engine [/C][/ROW] [ROW]Computing time[/C]1 seconds[/C][/ROW] [ROW]R Server[/C]Big Analytics Cloud Computing Center[/C][/ROW] [/TABLE] Source: https://freestatistics.org/blog/index.php?pk=301425&T=0

Globally Unique Identifier (entire table): ba.freestatistics.org/blog/index.php?pk=301425&T=0

As an alternative you can also use a QR Code:  

The GUIDs for individual cells are displayed in the table below:

Summary of computational transaction
Raw Input view raw input (R code)
Raw Outputview raw output of R engine
Computing time1 seconds
R ServerBig Analytics Cloud Computing Center


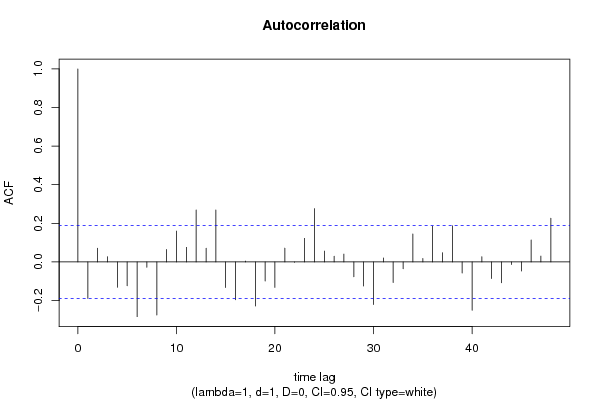
Autocorrelation Function
Time lag kACF(k)T-STATP-value
1-0.188779-1.95270.026731
20.0706640.73090.233204
30.0265770.27490.391955
4-0.131542-1.36070.088237
5-0.123724-1.27980.10169
6-0.283622-2.93380.002049
7-0.027929-0.28890.38661
8-0.275419-2.8490.002631
90.0645370.66760.25292
100.159841.65340.05059
110.075620.78220.217908
120.2691512.78410.003174
130.0709220.73360.232391
140.2689152.78170.003196
15-0.132779-1.37350.086237
16-0.19619-2.02940.02245
170.0042320.04380.482582
18-0.228713-2.36580.009895
19-0.099327-1.02740.153264
20-0.131871-1.36410.087701
210.0713540.73810.231037
22-0.001849-0.01910.492389
230.122041.26240.104777
240.2761792.85680.002571
250.0558650.57790.282284
260.0295820.3060.380099
270.0403690.41760.338546
28-0.076679-0.79320.214715
29-0.125264-1.29570.098926
30-0.220927-2.28530.012134
310.020790.2150.415069
32-0.106335-1.09990.136913
33-0.035696-0.36920.35634
340.1445391.49510.068913
350.0178820.1850.426799
360.1848481.91210.02927
370.0475990.49240.311734
380.1869831.93420.027867
39-0.057389-0.59360.277003
40-0.25046-2.59080.005455
410.0264910.2740.392298
42-0.085948-0.88910.187984
43-0.107744-1.11450.133779
44-0.013702-0.14170.443778
45-0.047511-0.49150.312053
460.1133751.17280.121748
470.030260.3130.377441
480.2261382.33920.010591

\begin{tabular}{lllllllll}
\hline
Autocorrelation Function \tabularnewline
Time lag k & ACF(k) & T-STAT & P-value \tabularnewline
1 & -0.188779 & -1.9527 & 0.026731 \tabularnewline
2 & 0.070664 & 0.7309 & 0.233204 \tabularnewline
3 & 0.026577 & 0.2749 & 0.391955 \tabularnewline
4 & -0.131542 & -1.3607 & 0.088237 \tabularnewline
5 & -0.123724 & -1.2798 & 0.10169 \tabularnewline
6 & -0.283622 & -2.9338 & 0.002049 \tabularnewline
7 & -0.027929 & -0.2889 & 0.38661 \tabularnewline
8 & -0.275419 & -2.849 & 0.002631 \tabularnewline
9 & 0.064537 & 0.6676 & 0.25292 \tabularnewline
10 & 0.15984 & 1.6534 & 0.05059 \tabularnewline
11 & 0.07562 & 0.7822 & 0.217908 \tabularnewline
12 & 0.269151 & 2.7841 & 0.003174 \tabularnewline
13 & 0.070922 & 0.7336 & 0.232391 \tabularnewline
14 & 0.268915 & 2.7817 & 0.003196 \tabularnewline
15 & -0.132779 & -1.3735 & 0.086237 \tabularnewline
16 & -0.19619 & -2.0294 & 0.02245 \tabularnewline
17 & 0.004232 & 0.0438 & 0.482582 \tabularnewline
18 & -0.228713 & -2.3658 & 0.009895 \tabularnewline
19 & -0.099327 & -1.0274 & 0.153264 \tabularnewline
20 & -0.131871 & -1.3641 & 0.087701 \tabularnewline
21 & 0.071354 & 0.7381 & 0.231037 \tabularnewline
22 & -0.001849 & -0.0191 & 0.492389 \tabularnewline
23 & 0.12204 & 1.2624 & 0.104777 \tabularnewline
24 & 0.276179 & 2.8568 & 0.002571 \tabularnewline
25 & 0.055865 & 0.5779 & 0.282284 \tabularnewline
26 & 0.029582 & 0.306 & 0.380099 \tabularnewline
27 & 0.040369 & 0.4176 & 0.338546 \tabularnewline
28 & -0.076679 & -0.7932 & 0.214715 \tabularnewline
29 & -0.125264 & -1.2957 & 0.098926 \tabularnewline
30 & -0.220927 & -2.2853 & 0.012134 \tabularnewline
31 & 0.02079 & 0.215 & 0.415069 \tabularnewline
32 & -0.106335 & -1.0999 & 0.136913 \tabularnewline
33 & -0.035696 & -0.3692 & 0.35634 \tabularnewline
34 & 0.144539 & 1.4951 & 0.068913 \tabularnewline
35 & 0.017882 & 0.185 & 0.426799 \tabularnewline
36 & 0.184848 & 1.9121 & 0.02927 \tabularnewline
37 & 0.047599 & 0.4924 & 0.311734 \tabularnewline
38 & 0.186983 & 1.9342 & 0.027867 \tabularnewline
39 & -0.057389 & -0.5936 & 0.277003 \tabularnewline
40 & -0.25046 & -2.5908 & 0.005455 \tabularnewline
41 & 0.026491 & 0.274 & 0.392298 \tabularnewline
42 & -0.085948 & -0.8891 & 0.187984 \tabularnewline
43 & -0.107744 & -1.1145 & 0.133779 \tabularnewline
44 & -0.013702 & -0.1417 & 0.443778 \tabularnewline
45 & -0.047511 & -0.4915 & 0.312053 \tabularnewline
46 & 0.113375 & 1.1728 & 0.121748 \tabularnewline
47 & 0.03026 & 0.313 & 0.377441 \tabularnewline
48 & 0.226138 & 2.3392 & 0.010591 \tabularnewline
\hline
\end{tabular}
%Source: https://freestatistics.org/blog/index.php?pk=301425&T=1

[TABLE]
[ROW][C]Autocorrelation Function[/C][/ROW]
[ROW][C]Time lag k[/C][C]ACF(k)[/C][C]T-STAT[/C][C]P-value[/C][/ROW]
[ROW][C]1[/C][C]-0.188779[/C][C]-1.9527[/C][C]0.026731[/C][/ROW]
[ROW][C]2[/C][C]0.070664[/C][C]0.7309[/C][C]0.233204[/C][/ROW]
[ROW][C]3[/C][C]0.026577[/C][C]0.2749[/C][C]0.391955[/C][/ROW]
[ROW][C]4[/C][C]-0.131542[/C][C]-1.3607[/C][C]0.088237[/C][/ROW]
[ROW][C]5[/C][C]-0.123724[/C][C]-1.2798[/C][C]0.10169[/C][/ROW]
[ROW][C]6[/C][C]-0.283622[/C][C]-2.9338[/C][C]0.002049[/C][/ROW]
[ROW][C]7[/C][C]-0.027929[/C][C]-0.2889[/C][C]0.38661[/C][/ROW]
[ROW][C]8[/C][C]-0.275419[/C][C]-2.849[/C][C]0.002631[/C][/ROW]
[ROW][C]9[/C][C]0.064537[/C][C]0.6676[/C][C]0.25292[/C][/ROW]
[ROW][C]10[/C][C]0.15984[/C][C]1.6534[/C][C]0.05059[/C][/ROW]
[ROW][C]11[/C][C]0.07562[/C][C]0.7822[/C][C]0.217908[/C][/ROW]
[ROW][C]12[/C][C]0.269151[/C][C]2.7841[/C][C]0.003174[/C][/ROW]
[ROW][C]13[/C][C]0.070922[/C][C]0.7336[/C][C]0.232391[/C][/ROW]
[ROW][C]14[/C][C]0.268915[/C][C]2.7817[/C][C]0.003196[/C][/ROW]
[ROW][C]15[/C][C]-0.132779[/C][C]-1.3735[/C][C]0.086237[/C][/ROW]
[ROW][C]16[/C][C]-0.19619[/C][C]-2.0294[/C][C]0.02245[/C][/ROW]
[ROW][C]17[/C][C]0.004232[/C][C]0.0438[/C][C]0.482582[/C][/ROW]
[ROW][C]18[/C][C]-0.228713[/C][C]-2.3658[/C][C]0.009895[/C][/ROW]
[ROW][C]19[/C][C]-0.099327[/C][C]-1.0274[/C][C]0.153264[/C][/ROW]
[ROW][C]20[/C][C]-0.131871[/C][C]-1.3641[/C][C]0.087701[/C][/ROW]
[ROW][C]21[/C][C]0.071354[/C][C]0.7381[/C][C]0.231037[/C][/ROW]
[ROW][C]22[/C][C]-0.001849[/C][C]-0.0191[/C][C]0.492389[/C][/ROW]
[ROW][C]23[/C][C]0.12204[/C][C]1.2624[/C][C]0.104777[/C][/ROW]
[ROW][C]24[/C][C]0.276179[/C][C]2.8568[/C][C]0.002571[/C][/ROW]
[ROW][C]25[/C][C]0.055865[/C][C]0.5779[/C][C]0.282284[/C][/ROW]
[ROW][C]26[/C][C]0.029582[/C][C]0.306[/C][C]0.380099[/C][/ROW]
[ROW][C]27[/C][C]0.040369[/C][C]0.4176[/C][C]0.338546[/C][/ROW]
[ROW][C]28[/C][C]-0.076679[/C][C]-0.7932[/C][C]0.214715[/C][/ROW]
[ROW][C]29[/C][C]-0.125264[/C][C]-1.2957[/C][C]0.098926[/C][/ROW]
[ROW][C]30[/C][C]-0.220927[/C][C]-2.2853[/C][C]0.012134[/C][/ROW]
[ROW][C]31[/C][C]0.02079[/C][C]0.215[/C][C]0.415069[/C][/ROW]
[ROW][C]32[/C][C]-0.106335[/C][C]-1.0999[/C][C]0.136913[/C][/ROW]
[ROW][C]33[/C][C]-0.035696[/C][C]-0.3692[/C][C]0.35634[/C][/ROW]
[ROW][C]34[/C][C]0.144539[/C][C]1.4951[/C][C]0.068913[/C][/ROW]
[ROW][C]35[/C][C]0.017882[/C][C]0.185[/C][C]0.426799[/C][/ROW]
[ROW][C]36[/C][C]0.184848[/C][C]1.9121[/C][C]0.02927[/C][/ROW]
[ROW][C]37[/C][C]0.047599[/C][C]0.4924[/C][C]0.311734[/C][/ROW]
[ROW][C]38[/C][C]0.186983[/C][C]1.9342[/C][C]0.027867[/C][/ROW]
[ROW][C]39[/C][C]-0.057389[/C][C]-0.5936[/C][C]0.277003[/C][/ROW]
[ROW][C]40[/C][C]-0.25046[/C][C]-2.5908[/C][C]0.005455[/C][/ROW]
[ROW][C]41[/C][C]0.026491[/C][C]0.274[/C][C]0.392298[/C][/ROW]
[ROW][C]42[/C][C]-0.085948[/C][C]-0.8891[/C][C]0.187984[/C][/ROW]
[ROW][C]43[/C][C]-0.107744[/C][C]-1.1145[/C][C]0.133779[/C][/ROW]
[ROW][C]44[/C][C]-0.013702[/C][C]-0.1417[/C][C]0.443778[/C][/ROW]
[ROW][C]45[/C][C]-0.047511[/C][C]-0.4915[/C][C]0.312053[/C][/ROW]
[ROW][C]46[/C][C]0.113375[/C][C]1.1728[/C][C]0.121748[/C][/ROW]
[ROW][C]47[/C][C]0.03026[/C][C]0.313[/C][C]0.377441[/C][/ROW]
[ROW][C]48[/C][C]0.226138[/C][C]2.3392[/C][C]0.010591[/C][/ROW]
[/TABLE]
Source: https://freestatistics.org/blog/index.php?pk=301425&T=1

Globally Unique Identifier (entire table): ba.freestatistics.org/blog/index.php?pk=301425&T=1

As an alternative you can also use a QR Code:  

The GUIDs for individual cells are displayed in the table below:

Autocorrelation Function
Time lag kACF(k)T-STATP-value
1-0.188779-1.95270.026731
20.0706640.73090.233204
30.0265770.27490.391955
4-0.131542-1.36070.088237
5-0.123724-1.27980.10169
6-0.283622-2.93380.002049
7-0.027929-0.28890.38661
8-0.275419-2.8490.002631
90.0645370.66760.25292
100.159841.65340.05059
110.075620.78220.217908
120.2691512.78410.003174
130.0709220.73360.232391
140.2689152.78170.003196
15-0.132779-1.37350.086237
16-0.19619-2.02940.02245
170.0042320.04380.482582
18-0.228713-2.36580.009895
19-0.099327-1.02740.153264
20-0.131871-1.36410.087701
210.0713540.73810.231037
22-0.001849-0.01910.492389
230.122041.26240.104777
240.2761792.85680.002571
250.0558650.57790.282284
260.0295820.3060.380099
270.0403690.41760.338546
28-0.076679-0.79320.214715
29-0.125264-1.29570.098926
30-0.220927-2.28530.012134
310.020790.2150.415069
32-0.106335-1.09990.136913
33-0.035696-0.36920.35634
340.1445391.49510.068913
350.0178820.1850.426799
360.1848481.91210.02927
370.0475990.49240.311734
380.1869831.93420.027867
39-0.057389-0.59360.277003
40-0.25046-2.59080.005455
410.0264910.2740.392298
42-0.085948-0.88910.187984
43-0.107744-1.11450.133779
44-0.013702-0.14170.443778
45-0.047511-0.49150.312053
460.1133751.17280.121748
470.030260.3130.377441
480.2261382.33920.010591


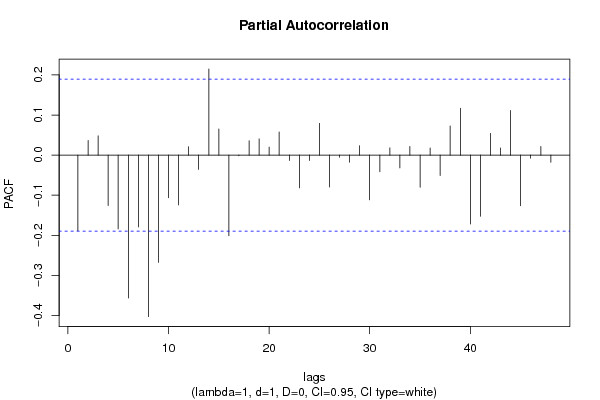
Partial Autocorrelation Function
Time lag kPACF(k)T-STATP-value
1-0.188779-1.95270.026731
20.036320.37570.353941
30.0480630.49720.310045
4-0.125691-1.30020.098171
5-0.18392-1.90250.029898
6-0.35638-3.68640.000179
7-0.17929-1.85460.033204
8-0.402714-4.16573.2e-05
9-0.26748-2.76680.003335
10-0.106133-1.09780.137367
11-0.124055-1.28320.10109
120.0209040.21620.414608
13-0.035527-0.36750.356989
140.2148632.22260.014174
150.0653760.67620.250171
16-0.201234-2.08160.019883
17-0.001637-0.01690.49326
180.0360420.37280.35501
190.0405220.41920.337969
200.020040.20730.418088
210.0578650.59860.275367
22-0.01332-0.13780.445334
23-0.081608-0.84420.200231
24-0.013399-0.13860.445015
250.0792370.81960.207124
26-0.079549-0.82290.20621
27-0.005267-0.05450.478327
28-0.017563-0.18170.42809
290.0235990.24410.403808
30-0.111492-1.15330.125681
31-0.041259-0.42680.335198
320.0181450.18770.425734
33-0.031868-0.32960.371156
340.0215660.22310.411947
35-0.080127-0.82880.204519
360.0179180.18530.426656
37-0.050769-0.52520.300279
380.0724740.74970.227548
390.1167851.2080.114849
40-0.171773-1.77680.039219
41-0.15225-1.57490.059117
420.054160.56020.288244
430.0179640.18580.426469
440.1113281.15160.126029
45-0.126248-1.30590.09719
46-0.007492-0.07750.469188
470.0214610.2220.412369
48-0.017809-0.18420.427097

\begin{tabular}{lllllllll}
\hline
Partial Autocorrelation Function \tabularnewline
Time lag k & PACF(k) & T-STAT & P-value \tabularnewline
1 & -0.188779 & -1.9527 & 0.026731 \tabularnewline
2 & 0.03632 & 0.3757 & 0.353941 \tabularnewline
3 & 0.048063 & 0.4972 & 0.310045 \tabularnewline
4 & -0.125691 & -1.3002 & 0.098171 \tabularnewline
5 & -0.18392 & -1.9025 & 0.029898 \tabularnewline
6 & -0.35638 & -3.6864 & 0.000179 \tabularnewline
7 & -0.17929 & -1.8546 & 0.033204 \tabularnewline
8 & -0.402714 & -4.1657 & 3.2e-05 \tabularnewline
9 & -0.26748 & -2.7668 & 0.003335 \tabularnewline
10 & -0.106133 & -1.0978 & 0.137367 \tabularnewline
11 & -0.124055 & -1.2832 & 0.10109 \tabularnewline
12 & 0.020904 & 0.2162 & 0.414608 \tabularnewline
13 & -0.035527 & -0.3675 & 0.356989 \tabularnewline
14 & 0.214863 & 2.2226 & 0.014174 \tabularnewline
15 & 0.065376 & 0.6762 & 0.250171 \tabularnewline
16 & -0.201234 & -2.0816 & 0.019883 \tabularnewline
17 & -0.001637 & -0.0169 & 0.49326 \tabularnewline
18 & 0.036042 & 0.3728 & 0.35501 \tabularnewline
19 & 0.040522 & 0.4192 & 0.337969 \tabularnewline
20 & 0.02004 & 0.2073 & 0.418088 \tabularnewline
21 & 0.057865 & 0.5986 & 0.275367 \tabularnewline
22 & -0.01332 & -0.1378 & 0.445334 \tabularnewline
23 & -0.081608 & -0.8442 & 0.200231 \tabularnewline
24 & -0.013399 & -0.1386 & 0.445015 \tabularnewline
25 & 0.079237 & 0.8196 & 0.207124 \tabularnewline
26 & -0.079549 & -0.8229 & 0.20621 \tabularnewline
27 & -0.005267 & -0.0545 & 0.478327 \tabularnewline
28 & -0.017563 & -0.1817 & 0.42809 \tabularnewline
29 & 0.023599 & 0.2441 & 0.403808 \tabularnewline
30 & -0.111492 & -1.1533 & 0.125681 \tabularnewline
31 & -0.041259 & -0.4268 & 0.335198 \tabularnewline
32 & 0.018145 & 0.1877 & 0.425734 \tabularnewline
33 & -0.031868 & -0.3296 & 0.371156 \tabularnewline
34 & 0.021566 & 0.2231 & 0.411947 \tabularnewline
35 & -0.080127 & -0.8288 & 0.204519 \tabularnewline
36 & 0.017918 & 0.1853 & 0.426656 \tabularnewline
37 & -0.050769 & -0.5252 & 0.300279 \tabularnewline
38 & 0.072474 & 0.7497 & 0.227548 \tabularnewline
39 & 0.116785 & 1.208 & 0.114849 \tabularnewline
40 & -0.171773 & -1.7768 & 0.039219 \tabularnewline
41 & -0.15225 & -1.5749 & 0.059117 \tabularnewline
42 & 0.05416 & 0.5602 & 0.288244 \tabularnewline
43 & 0.017964 & 0.1858 & 0.426469 \tabularnewline
44 & 0.111328 & 1.1516 & 0.126029 \tabularnewline
45 & -0.126248 & -1.3059 & 0.09719 \tabularnewline
46 & -0.007492 & -0.0775 & 0.469188 \tabularnewline
47 & 0.021461 & 0.222 & 0.412369 \tabularnewline
48 & -0.017809 & -0.1842 & 0.427097 \tabularnewline
\hline
\end{tabular}
%Source: https://freestatistics.org/blog/index.php?pk=301425&T=2

[TABLE]
[ROW][C]Partial Autocorrelation Function[/C][/ROW]
[ROW][C]Time lag k[/C][C]PACF(k)[/C][C]T-STAT[/C][C]P-value[/C][/ROW]
[ROW][C]1[/C][C]-0.188779[/C][C]-1.9527[/C][C]0.026731[/C][/ROW]
[ROW][C]2[/C][C]0.03632[/C][C]0.3757[/C][C]0.353941[/C][/ROW]
[ROW][C]3[/C][C]0.048063[/C][C]0.4972[/C][C]0.310045[/C][/ROW]
[ROW][C]4[/C][C]-0.125691[/C][C]-1.3002[/C][C]0.098171[/C][/ROW]
[ROW][C]5[/C][C]-0.18392[/C][C]-1.9025[/C][C]0.029898[/C][/ROW]
[ROW][C]6[/C][C]-0.35638[/C][C]-3.6864[/C][C]0.000179[/C][/ROW]
[ROW][C]7[/C][C]-0.17929[/C][C]-1.8546[/C][C]0.033204[/C][/ROW]
[ROW][C]8[/C][C]-0.402714[/C][C]-4.1657[/C][C]3.2e-05[/C][/ROW]
[ROW][C]9[/C][C]-0.26748[/C][C]-2.7668[/C][C]0.003335[/C][/ROW]
[ROW][C]10[/C][C]-0.106133[/C][C]-1.0978[/C][C]0.137367[/C][/ROW]
[ROW][C]11[/C][C]-0.124055[/C][C]-1.2832[/C][C]0.10109[/C][/ROW]
[ROW][C]12[/C][C]0.020904[/C][C]0.2162[/C][C]0.414608[/C][/ROW]
[ROW][C]13[/C][C]-0.035527[/C][C]-0.3675[/C][C]0.356989[/C][/ROW]
[ROW][C]14[/C][C]0.214863[/C][C]2.2226[/C][C]0.014174[/C][/ROW]
[ROW][C]15[/C][C]0.065376[/C][C]0.6762[/C][C]0.250171[/C][/ROW]
[ROW][C]16[/C][C]-0.201234[/C][C]-2.0816[/C][C]0.019883[/C][/ROW]
[ROW][C]17[/C][C]-0.001637[/C][C]-0.0169[/C][C]0.49326[/C][/ROW]
[ROW][C]18[/C][C]0.036042[/C][C]0.3728[/C][C]0.35501[/C][/ROW]
[ROW][C]19[/C][C]0.040522[/C][C]0.4192[/C][C]0.337969[/C][/ROW]
[ROW][C]20[/C][C]0.02004[/C][C]0.2073[/C][C]0.418088[/C][/ROW]
[ROW][C]21[/C][C]0.057865[/C][C]0.5986[/C][C]0.275367[/C][/ROW]
[ROW][C]22[/C][C]-0.01332[/C][C]-0.1378[/C][C]0.445334[/C][/ROW]
[ROW][C]23[/C][C]-0.081608[/C][C]-0.8442[/C][C]0.200231[/C][/ROW]
[ROW][C]24[/C][C]-0.013399[/C][C]-0.1386[/C][C]0.445015[/C][/ROW]
[ROW][C]25[/C][C]0.079237[/C][C]0.8196[/C][C]0.207124[/C][/ROW]
[ROW][C]26[/C][C]-0.079549[/C][C]-0.8229[/C][C]0.20621[/C][/ROW]
[ROW][C]27[/C][C]-0.005267[/C][C]-0.0545[/C][C]0.478327[/C][/ROW]
[ROW][C]28[/C][C]-0.017563[/C][C]-0.1817[/C][C]0.42809[/C][/ROW]
[ROW][C]29[/C][C]0.023599[/C][C]0.2441[/C][C]0.403808[/C][/ROW]
[ROW][C]30[/C][C]-0.111492[/C][C]-1.1533[/C][C]0.125681[/C][/ROW]
[ROW][C]31[/C][C]-0.041259[/C][C]-0.4268[/C][C]0.335198[/C][/ROW]
[ROW][C]32[/C][C]0.018145[/C][C]0.1877[/C][C]0.425734[/C][/ROW]
[ROW][C]33[/C][C]-0.031868[/C][C]-0.3296[/C][C]0.371156[/C][/ROW]
[ROW][C]34[/C][C]0.021566[/C][C]0.2231[/C][C]0.411947[/C][/ROW]
[ROW][C]35[/C][C]-0.080127[/C][C]-0.8288[/C][C]0.204519[/C][/ROW]
[ROW][C]36[/C][C]0.017918[/C][C]0.1853[/C][C]0.426656[/C][/ROW]
[ROW][C]37[/C][C]-0.050769[/C][C]-0.5252[/C][C]0.300279[/C][/ROW]
[ROW][C]38[/C][C]0.072474[/C][C]0.7497[/C][C]0.227548[/C][/ROW]
[ROW][C]39[/C][C]0.116785[/C][C]1.208[/C][C]0.114849[/C][/ROW]
[ROW][C]40[/C][C]-0.171773[/C][C]-1.7768[/C][C]0.039219[/C][/ROW]
[ROW][C]41[/C][C]-0.15225[/C][C]-1.5749[/C][C]0.059117[/C][/ROW]
[ROW][C]42[/C][C]0.05416[/C][C]0.5602[/C][C]0.288244[/C][/ROW]
[ROW][C]43[/C][C]0.017964[/C][C]0.1858[/C][C]0.426469[/C][/ROW]
[ROW][C]44[/C][C]0.111328[/C][C]1.1516[/C][C]0.126029[/C][/ROW]
[ROW][C]45[/C][C]-0.126248[/C][C]-1.3059[/C][C]0.09719[/C][/ROW]
[ROW][C]46[/C][C]-0.007492[/C][C]-0.0775[/C][C]0.469188[/C][/ROW]
[ROW][C]47[/C][C]0.021461[/C][C]0.222[/C][C]0.412369[/C][/ROW]
[ROW][C]48[/C][C]-0.017809[/C][C]-0.1842[/C][C]0.427097[/C][/ROW]
[/TABLE]
Source: https://freestatistics.org/blog/index.php?pk=301425&T=2

Globally Unique Identifier (entire table): ba.freestatistics.org/blog/index.php?pk=301425&T=2

As an alternative you can also use a QR Code:  

The GUIDs for individual cells are displayed in the table below:

Partial Autocorrelation Function
Time lag kPACF(k)T-STATP-value
1-0.188779-1.95270.026731
20.036320.37570.353941
30.0480630.49720.310045
4-0.125691-1.30020.098171
5-0.18392-1.90250.029898
6-0.35638-3.68640.000179
7-0.17929-1.85460.033204
8-0.402714-4.16573.2e-05
9-0.26748-2.76680.003335
10-0.106133-1.09780.137367
11-0.124055-1.28320.10109
120.0209040.21620.414608
13-0.035527-0.36750.356989
140.2148632.22260.014174
150.0653760.67620.250171
16-0.201234-2.08160.019883
17-0.001637-0.01690.49326
180.0360420.37280.35501
190.0405220.41920.337969
200.020040.20730.418088
210.0578650.59860.275367
22-0.01332-0.13780.445334
23-0.081608-0.84420.200231
24-0.013399-0.13860.445015
250.0792370.81960.207124
26-0.079549-0.82290.20621
27-0.005267-0.05450.478327
28-0.017563-0.18170.42809
290.0235990.24410.403808
30-0.111492-1.15330.125681
31-0.041259-0.42680.335198
320.0181450.18770.425734
33-0.031868-0.32960.371156
340.0215660.22310.411947
35-0.080127-0.82880.204519
360.0179180.18530.426656
37-0.050769-0.52520.300279
380.0724740.74970.227548
390.1167851.2080.114849
40-0.171773-1.77680.039219
41-0.15225-1.57490.059117
420.054160.56020.288244
430.0179640.18580.426469
440.1113281.15160.126029
45-0.126248-1.30590.09719
46-0.007492-0.07750.469188
470.0214610.2220.412369
48-0.017809-0.18420.427097


Parameters (Session):
par1 = Default ; par2 = 0.1 ; par3 = 0 ; par4 = 0 ; par5 = 12 ; par6 = White Noise ; par7 = 0.95 ;
Parameters (R input):
par1 = 48 ; par2 = 1 ; par3 = 1 ; par4 = 0 ; par5 = 12 ; par6 = White Noise ; par7 = 0.95 ; par8 = ;
R code (references can be found in the software module):
par8 <- ''
par7 <- '0.95'
par6 <- 'White Noise'
par5 <- '12'
par4 <- '1'
par3 <- '2'
par2 <- '1'
par1 <- '48'
if (par1 == 'Default') {
par1 = 10*log10(length(x))
} else {
par1 <- as.numeric(par1)
}
par2 <- as.numeric(par2)
par3 <- as.numeric(par3)
par4 <- as.numeric(par4)
par5 <- as.numeric(par5)
if (par6 == 'White Noise') par6 <- 'white' else par6 <- 'ma'
par7 <- as.numeric(par7)
if (par8 != '') par8 <- as.numeric(par8)
x <- na.omit(x)
ox <- x
if (par8 == '') {
if (par2 == 0) {
x <- log(x)
} else {
x <- (x ^ par2 - 1) / par2
}
} else {
x <- log(x,base=par8)
}
if (par3 > 0) x <- diff(x,lag=1,difference=par3)
if (par4 > 0) x <- diff(x,lag=par5,difference=par4)
bitmap(file='picts.png')
op <- par(mfrow=c(2,1))
plot(ox,type='l',main='Original Time Series',xlab='time',ylab='value')
if (par8=='') {
mytitle <- paste('Working Time Series (lambda=',par2,', d=',par3,', D=',par4,')',sep='')
mysub <- paste('(lambda=',par2,', d=',par3,', D=',par4,', CI=', par7, ', CI type=',par6,')',sep='')
} else {
mytitle <- paste('Working Time Series (base=',par8,', d=',par3,', D=',par4,')',sep='')
mysub <- paste('(base=',par8,', d=',par3,', D=',par4,', CI=', par7, ', CI type=',par6,')',sep='')
}
plot(x,type='l', main=mytitle,xlab='time',ylab='value')
par(op)
dev.off()
bitmap(file='pic1.png')
racf <- acf(x, par1, main='Autocorrelation', xlab='time lag', ylab='ACF', ci.type=par6, ci=par7, sub=mysub)
dev.off()
bitmap(file='pic2.png')
rpacf <- pacf(x,par1,main='Partial Autocorrelation',xlab='lags',ylab='PACF',sub=mysub)
dev.off()
(myacf <- c(racf$acf))
(mypacf <- c(rpacf$acf))
lengthx <- length(x)
sqrtn <- sqrt(lengthx)
load(file='createtable')
a<-table.start()
a<-table.row.start(a)
a<-table.element(a,'Autocorrelation Function',4,TRUE)
a<-table.row.end(a)
a<-table.row.start(a)
a<-table.element(a,'Time lag k',header=TRUE)
a<-table.element(a,'ACF(k)',header=TRUE)
a<-table.element(a,'T-STAT',header=TRUE)
a<-table.element(a,'P-value',header=TRUE)
a<-table.row.end(a)
for (i in 2:(par1+1)) {
a<-table.row.start(a)
a<-table.element(a,i-1,header=TRUE)
a<-table.element(a,round(myacf[i],6))
mytstat <- myacf[i]*sqrtn
a<-table.element(a,round(mytstat,4))
a<-table.element(a,round(1-pt(abs(mytstat),lengthx),6))
a<-table.row.end(a)
}
a<-table.end(a)
table.save(a,file='mytable.tab')
a<-table.start()
a<-table.row.start(a)
a<-table.element(a,'Partial Autocorrelation Function',4,TRUE)
a<-table.row.end(a)
a<-table.row.start(a)
a<-table.element(a,'Time lag k',header=TRUE)
a<-table.element(a,'PACF(k)',header=TRUE)
a<-table.element(a,'T-STAT',header=TRUE)
a<-table.element(a,'P-value',header=TRUE)
a<-table.row.end(a)
for (i in 1:par1) {
a<-table.row.start(a)
a<-table.element(a,i,header=TRUE)
a<-table.element(a,round(mypacf[i],6))
mytstat <- mypacf[i]*sqrtn
a<-table.element(a,round(mytstat,4))
a<-table.element(a,round(1-pt(abs(mytstat),lengthx),6))
a<-table.row.end(a)
}
a<-table.end(a)
table.save(a,file='mytable1.tab')