Free Statistics

of Irreproducible Research!

Author's title

Author*The author of this computation has been verified*
R Software Modulerwasp_autocorrelation.wasp
Title produced by software(Partial) Autocorrelation Function
Date of computationMon, 19 Dec 2016 17:21:27 +0100
Cite this page as followsStatistical Computations at FreeStatistics.org, Office for Research Development and Education, URL https://freestatistics.org/blog/index.php?v=date/2016/Dec/19/t1482164510v9cyxns3xfbpcnu.htm/, Retrieved Fri, 01 Nov 2024 03:48:27 +0000
Statistical Computations at FreeStatistics.org, Office for Research Development and Education, URL https://freestatistics.org/blog/index.php?pk=301406, Retrieved Fri, 01 Nov 2024 03:48:27 +0000
QR Codes:

Original text written by user:
IsPrivate?No (this computation is public)
User-defined keywords
Estimated Impact77
Family? (F = Feedback message, R = changed R code, M = changed R Module, P = changed Parameters, D = changed Data)
-       [(Partial) Autocorrelation Function] [Autocorrelatie] [2016-12-19 16:21:27] [e8b5e2ae4a4517822f644e6c122e1af0] [Current]
Feedback Forum

Post a new message
Dataseries X:
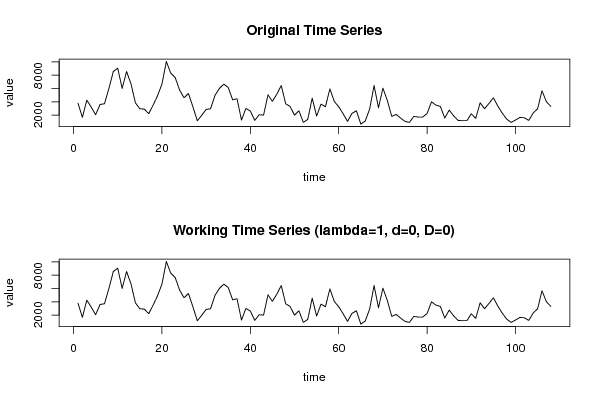
3800
1650
4250
3200
2050
3600
3700
6000
8550
9050
6000
8550
6700
3850
2950
2900
2200
3500
4900
6650
10050
8300
7650
5750
4600
5250
3250
1150
1950
2850
2950
4950
6000
6650
6150
4300
4450
1250
3000
2600
1200
2050
2000
5050
4050
5150
6450
3700
3300
2000
2650
900
1350
4550
1850
3650
3250
5950
4050
3250
2200
1050
2250
2650
650
1100
2900
6450
3100
6050
4200
1800
2100
1550
1050
900
1800
1700
1700
2250
4000
3500
3300
1550
2750
1900
1200
1150
1150
2200
1500
3850
2950
3750
4600
3350
2300
1400
900
1250
1650
1600
1200
2300
2950
5650
4000
3300


Summary of computational transaction
Raw Input view raw input (R code)
Raw Outputview raw output of R engine
Computing time1 seconds
R ServerBig Analytics Cloud Computing Center

\begin{tabular}{lllllllll}
\hline
Summary of computational transaction \tabularnewline
Raw Input view raw input (R code)  \tabularnewline
Raw Outputview raw output of R engine  \tabularnewline
Computing time1 seconds \tabularnewline
R ServerBig Analytics Cloud Computing Center \tabularnewline
\hline
\end{tabular}
%Source: https://freestatistics.org/blog/index.php?pk=301406&T=0

[TABLE]
[ROW]
Summary of computational transaction[/C][/ROW] [ROW]Raw Input[/C] view raw input (R code) [/C][/ROW] [ROW]Raw Output[/C]view raw output of R engine [/C][/ROW] [ROW]Computing time[/C]1 seconds[/C][/ROW] [ROW]R Server[/C]Big Analytics Cloud Computing Center[/C][/ROW] [/TABLE] Source: https://freestatistics.org/blog/index.php?pk=301406&T=0

Globally Unique Identifier (entire table): ba.freestatistics.org/blog/index.php?pk=301406&T=0

As an alternative you can also use a QR Code:  

The GUIDs for individual cells are displayed in the table below:

Summary of computational transaction
Raw Input view raw input (R code)
Raw Outputview raw output of R engine
Computing time1 seconds
R ServerBig Analytics Cloud Computing Center


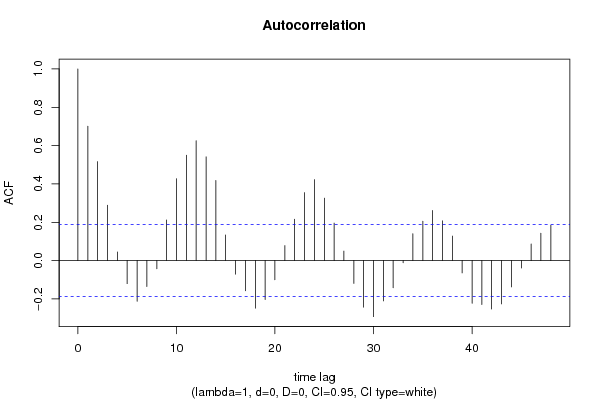
Autocorrelation Function
Time lag kACF(k)T-STATP-value
10.7008387.28330
20.5165175.36780
30.2884392.99750.001689
40.0444120.46150.322668
5-0.120255-1.24970.10705
6-0.212546-2.20880.014649
7-0.135204-1.40510.081433
8-0.043008-0.4470.327901
90.2116632.19970.014981
100.4271464.4391.1e-05
110.5495725.71130
120.6249916.49510
130.541235.62460
140.4177264.34111.6e-05
150.1338551.39110.083533
16-0.070837-0.73620.231613
17-0.157347-1.63520.05246
18-0.248204-2.57940.005621
19-0.203199-2.11170.018509
20-0.100582-1.04530.149113
210.0781120.81180.209357
220.2154612.23910.013598
230.3545963.68510.00018
240.42254.39081.3e-05
250.3257363.38510.000496
260.1956012.03270.022266
270.0494240.51360.304281
28-0.119042-1.23710.109362
29-0.242857-2.52380.006531
30-0.29267-3.04150.001477
31-0.210464-2.18720.015442
32-0.142271-1.47850.071089
33-0.01167-0.12130.451847
340.1397521.45230.074653
350.2052492.1330.017594
360.2616712.71940.003812
370.2073092.15440.016715
380.1278251.32840.093424
39-0.064221-0.66740.252969
40-0.222593-2.31330.011301
41-0.228939-2.37920.009553
42-0.252951-2.62870.00491
43-0.226127-2.350.010296
44-0.137478-1.42870.077986
45-0.039209-0.40750.342235
460.086440.89830.18551
470.1428131.48420.070341
480.1836211.90830.029507

\begin{tabular}{lllllllll}
\hline
Autocorrelation Function \tabularnewline
Time lag k & ACF(k) & T-STAT & P-value \tabularnewline
1 & 0.700838 & 7.2833 & 0 \tabularnewline
2 & 0.516517 & 5.3678 & 0 \tabularnewline
3 & 0.288439 & 2.9975 & 0.001689 \tabularnewline
4 & 0.044412 & 0.4615 & 0.322668 \tabularnewline
5 & -0.120255 & -1.2497 & 0.10705 \tabularnewline
6 & -0.212546 & -2.2088 & 0.014649 \tabularnewline
7 & -0.135204 & -1.4051 & 0.081433 \tabularnewline
8 & -0.043008 & -0.447 & 0.327901 \tabularnewline
9 & 0.211663 & 2.1997 & 0.014981 \tabularnewline
10 & 0.427146 & 4.439 & 1.1e-05 \tabularnewline
11 & 0.549572 & 5.7113 & 0 \tabularnewline
12 & 0.624991 & 6.4951 & 0 \tabularnewline
13 & 0.54123 & 5.6246 & 0 \tabularnewline
14 & 0.417726 & 4.3411 & 1.6e-05 \tabularnewline
15 & 0.133855 & 1.3911 & 0.083533 \tabularnewline
16 & -0.070837 & -0.7362 & 0.231613 \tabularnewline
17 & -0.157347 & -1.6352 & 0.05246 \tabularnewline
18 & -0.248204 & -2.5794 & 0.005621 \tabularnewline
19 & -0.203199 & -2.1117 & 0.018509 \tabularnewline
20 & -0.100582 & -1.0453 & 0.149113 \tabularnewline
21 & 0.078112 & 0.8118 & 0.209357 \tabularnewline
22 & 0.215461 & 2.2391 & 0.013598 \tabularnewline
23 & 0.354596 & 3.6851 & 0.00018 \tabularnewline
24 & 0.4225 & 4.3908 & 1.3e-05 \tabularnewline
25 & 0.325736 & 3.3851 & 0.000496 \tabularnewline
26 & 0.195601 & 2.0327 & 0.022266 \tabularnewline
27 & 0.049424 & 0.5136 & 0.304281 \tabularnewline
28 & -0.119042 & -1.2371 & 0.109362 \tabularnewline
29 & -0.242857 & -2.5238 & 0.006531 \tabularnewline
30 & -0.29267 & -3.0415 & 0.001477 \tabularnewline
31 & -0.210464 & -2.1872 & 0.015442 \tabularnewline
32 & -0.142271 & -1.4785 & 0.071089 \tabularnewline
33 & -0.01167 & -0.1213 & 0.451847 \tabularnewline
34 & 0.139752 & 1.4523 & 0.074653 \tabularnewline
35 & 0.205249 & 2.133 & 0.017594 \tabularnewline
36 & 0.261671 & 2.7194 & 0.003812 \tabularnewline
37 & 0.207309 & 2.1544 & 0.016715 \tabularnewline
38 & 0.127825 & 1.3284 & 0.093424 \tabularnewline
39 & -0.064221 & -0.6674 & 0.252969 \tabularnewline
40 & -0.222593 & -2.3133 & 0.011301 \tabularnewline
41 & -0.228939 & -2.3792 & 0.009553 \tabularnewline
42 & -0.252951 & -2.6287 & 0.00491 \tabularnewline
43 & -0.226127 & -2.35 & 0.010296 \tabularnewline
44 & -0.137478 & -1.4287 & 0.077986 \tabularnewline
45 & -0.039209 & -0.4075 & 0.342235 \tabularnewline
46 & 0.08644 & 0.8983 & 0.18551 \tabularnewline
47 & 0.142813 & 1.4842 & 0.070341 \tabularnewline
48 & 0.183621 & 1.9083 & 0.029507 \tabularnewline
\hline
\end{tabular}
%Source: https://freestatistics.org/blog/index.php?pk=301406&T=1

[TABLE]
[ROW][C]Autocorrelation Function[/C][/ROW]
[ROW][C]Time lag k[/C][C]ACF(k)[/C][C]T-STAT[/C][C]P-value[/C][/ROW]
[ROW][C]1[/C][C]0.700838[/C][C]7.2833[/C][C]0[/C][/ROW]
[ROW][C]2[/C][C]0.516517[/C][C]5.3678[/C][C]0[/C][/ROW]
[ROW][C]3[/C][C]0.288439[/C][C]2.9975[/C][C]0.001689[/C][/ROW]
[ROW][C]4[/C][C]0.044412[/C][C]0.4615[/C][C]0.322668[/C][/ROW]
[ROW][C]5[/C][C]-0.120255[/C][C]-1.2497[/C][C]0.10705[/C][/ROW]
[ROW][C]6[/C][C]-0.212546[/C][C]-2.2088[/C][C]0.014649[/C][/ROW]
[ROW][C]7[/C][C]-0.135204[/C][C]-1.4051[/C][C]0.081433[/C][/ROW]
[ROW][C]8[/C][C]-0.043008[/C][C]-0.447[/C][C]0.327901[/C][/ROW]
[ROW][C]9[/C][C]0.211663[/C][C]2.1997[/C][C]0.014981[/C][/ROW]
[ROW][C]10[/C][C]0.427146[/C][C]4.439[/C][C]1.1e-05[/C][/ROW]
[ROW][C]11[/C][C]0.549572[/C][C]5.7113[/C][C]0[/C][/ROW]
[ROW][C]12[/C][C]0.624991[/C][C]6.4951[/C][C]0[/C][/ROW]
[ROW][C]13[/C][C]0.54123[/C][C]5.6246[/C][C]0[/C][/ROW]
[ROW][C]14[/C][C]0.417726[/C][C]4.3411[/C][C]1.6e-05[/C][/ROW]
[ROW][C]15[/C][C]0.133855[/C][C]1.3911[/C][C]0.083533[/C][/ROW]
[ROW][C]16[/C][C]-0.070837[/C][C]-0.7362[/C][C]0.231613[/C][/ROW]
[ROW][C]17[/C][C]-0.157347[/C][C]-1.6352[/C][C]0.05246[/C][/ROW]
[ROW][C]18[/C][C]-0.248204[/C][C]-2.5794[/C][C]0.005621[/C][/ROW]
[ROW][C]19[/C][C]-0.203199[/C][C]-2.1117[/C][C]0.018509[/C][/ROW]
[ROW][C]20[/C][C]-0.100582[/C][C]-1.0453[/C][C]0.149113[/C][/ROW]
[ROW][C]21[/C][C]0.078112[/C][C]0.8118[/C][C]0.209357[/C][/ROW]
[ROW][C]22[/C][C]0.215461[/C][C]2.2391[/C][C]0.013598[/C][/ROW]
[ROW][C]23[/C][C]0.354596[/C][C]3.6851[/C][C]0.00018[/C][/ROW]
[ROW][C]24[/C][C]0.4225[/C][C]4.3908[/C][C]1.3e-05[/C][/ROW]
[ROW][C]25[/C][C]0.325736[/C][C]3.3851[/C][C]0.000496[/C][/ROW]
[ROW][C]26[/C][C]0.195601[/C][C]2.0327[/C][C]0.022266[/C][/ROW]
[ROW][C]27[/C][C]0.049424[/C][C]0.5136[/C][C]0.304281[/C][/ROW]
[ROW][C]28[/C][C]-0.119042[/C][C]-1.2371[/C][C]0.109362[/C][/ROW]
[ROW][C]29[/C][C]-0.242857[/C][C]-2.5238[/C][C]0.006531[/C][/ROW]
[ROW][C]30[/C][C]-0.29267[/C][C]-3.0415[/C][C]0.001477[/C][/ROW]
[ROW][C]31[/C][C]-0.210464[/C][C]-2.1872[/C][C]0.015442[/C][/ROW]
[ROW][C]32[/C][C]-0.142271[/C][C]-1.4785[/C][C]0.071089[/C][/ROW]
[ROW][C]33[/C][C]-0.01167[/C][C]-0.1213[/C][C]0.451847[/C][/ROW]
[ROW][C]34[/C][C]0.139752[/C][C]1.4523[/C][C]0.074653[/C][/ROW]
[ROW][C]35[/C][C]0.205249[/C][C]2.133[/C][C]0.017594[/C][/ROW]
[ROW][C]36[/C][C]0.261671[/C][C]2.7194[/C][C]0.003812[/C][/ROW]
[ROW][C]37[/C][C]0.207309[/C][C]2.1544[/C][C]0.016715[/C][/ROW]
[ROW][C]38[/C][C]0.127825[/C][C]1.3284[/C][C]0.093424[/C][/ROW]
[ROW][C]39[/C][C]-0.064221[/C][C]-0.6674[/C][C]0.252969[/C][/ROW]
[ROW][C]40[/C][C]-0.222593[/C][C]-2.3133[/C][C]0.011301[/C][/ROW]
[ROW][C]41[/C][C]-0.228939[/C][C]-2.3792[/C][C]0.009553[/C][/ROW]
[ROW][C]42[/C][C]-0.252951[/C][C]-2.6287[/C][C]0.00491[/C][/ROW]
[ROW][C]43[/C][C]-0.226127[/C][C]-2.35[/C][C]0.010296[/C][/ROW]
[ROW][C]44[/C][C]-0.137478[/C][C]-1.4287[/C][C]0.077986[/C][/ROW]
[ROW][C]45[/C][C]-0.039209[/C][C]-0.4075[/C][C]0.342235[/C][/ROW]
[ROW][C]46[/C][C]0.08644[/C][C]0.8983[/C][C]0.18551[/C][/ROW]
[ROW][C]47[/C][C]0.142813[/C][C]1.4842[/C][C]0.070341[/C][/ROW]
[ROW][C]48[/C][C]0.183621[/C][C]1.9083[/C][C]0.029507[/C][/ROW]
[/TABLE]
Source: https://freestatistics.org/blog/index.php?pk=301406&T=1

Globally Unique Identifier (entire table): ba.freestatistics.org/blog/index.php?pk=301406&T=1

As an alternative you can also use a QR Code:  

The GUIDs for individual cells are displayed in the table below:

Autocorrelation Function
Time lag kACF(k)T-STATP-value
10.7008387.28330
20.5165175.36780
30.2884392.99750.001689
40.0444120.46150.322668
5-0.120255-1.24970.10705
6-0.212546-2.20880.014649
7-0.135204-1.40510.081433
8-0.043008-0.4470.327901
90.2116632.19970.014981
100.4271464.4391.1e-05
110.5495725.71130
120.6249916.49510
130.541235.62460
140.4177264.34111.6e-05
150.1338551.39110.083533
16-0.070837-0.73620.231613
17-0.157347-1.63520.05246
18-0.248204-2.57940.005621
19-0.203199-2.11170.018509
20-0.100582-1.04530.149113
210.0781120.81180.209357
220.2154612.23910.013598
230.3545963.68510.00018
240.42254.39081.3e-05
250.3257363.38510.000496
260.1956012.03270.022266
270.0494240.51360.304281
28-0.119042-1.23710.109362
29-0.242857-2.52380.006531
30-0.29267-3.04150.001477
31-0.210464-2.18720.015442
32-0.142271-1.47850.071089
33-0.01167-0.12130.451847
340.1397521.45230.074653
350.2052492.1330.017594
360.2616712.71940.003812
370.2073092.15440.016715
380.1278251.32840.093424
39-0.064221-0.66740.252969
40-0.222593-2.31330.011301
41-0.228939-2.37920.009553
42-0.252951-2.62870.00491
43-0.226127-2.350.010296
44-0.137478-1.42870.077986
45-0.039209-0.40750.342235
460.086440.89830.18551
470.1428131.48420.070341
480.1836211.90830.029507


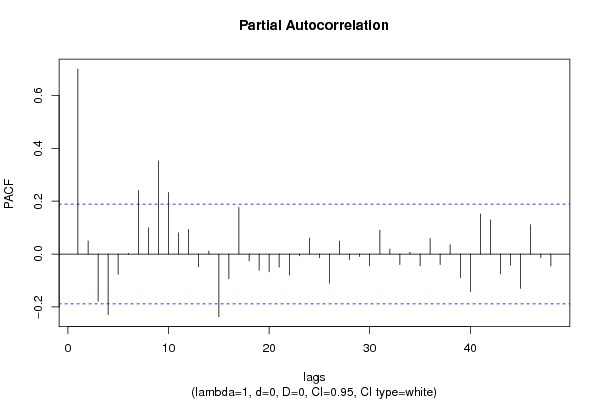
Partial Autocorrelation Function
Time lag kPACF(k)T-STATP-value
10.7008387.28330
20.0498060.51760.302898
3-0.17817-1.85160.033408
4-0.228649-2.37620.009627
5-0.076296-0.79290.214789
60.0030490.03170.487389
70.2406282.50070.006949
80.0997271.03640.151166
90.3521493.65960.000196
100.2329462.42080.008576
110.0806450.83810.201916
120.0928860.96530.168275
13-0.047919-0.4980.309751
140.0113670.11810.453092
15-0.237021-2.46320.007675
16-0.093649-0.97320.166308
170.1760711.82980.035021
18-0.025738-0.26750.394806
19-0.061195-0.6360.263076
20-0.066833-0.69460.244414
21-0.04945-0.51390.304186
22-0.07954-0.82660.205142
23-0.006445-0.0670.473361
240.0609360.63330.263949
25-0.014187-0.14740.441533
26-0.110451-1.14780.126785
270.0496360.51580.303513
28-0.020428-0.21230.416141
29-0.009276-0.09640.461691
30-0.045592-0.47380.318296
310.0899930.93520.175877
320.0190020.19750.421914
33-0.039678-0.41230.34045
340.0063870.06640.473602
35-0.044473-0.46220.322444
360.0590780.6140.270268
37-0.039405-0.40950.341489
380.0353030.36690.357213
39-0.089894-0.93420.176141
40-0.141626-1.47180.071989
410.1513731.57310.059309
420.1292081.34280.09108
43-0.075109-0.78060.218387
44-0.042029-0.43680.331572
45-0.129964-1.35060.089819
460.1113951.15760.124781
47-0.014319-0.14880.440993
48-0.045097-0.46870.320128

\begin{tabular}{lllllllll}
\hline
Partial Autocorrelation Function \tabularnewline
Time lag k & PACF(k) & T-STAT & P-value \tabularnewline
1 & 0.700838 & 7.2833 & 0 \tabularnewline
2 & 0.049806 & 0.5176 & 0.302898 \tabularnewline
3 & -0.17817 & -1.8516 & 0.033408 \tabularnewline
4 & -0.228649 & -2.3762 & 0.009627 \tabularnewline
5 & -0.076296 & -0.7929 & 0.214789 \tabularnewline
6 & 0.003049 & 0.0317 & 0.487389 \tabularnewline
7 & 0.240628 & 2.5007 & 0.006949 \tabularnewline
8 & 0.099727 & 1.0364 & 0.151166 \tabularnewline
9 & 0.352149 & 3.6596 & 0.000196 \tabularnewline
10 & 0.232946 & 2.4208 & 0.008576 \tabularnewline
11 & 0.080645 & 0.8381 & 0.201916 \tabularnewline
12 & 0.092886 & 0.9653 & 0.168275 \tabularnewline
13 & -0.047919 & -0.498 & 0.309751 \tabularnewline
14 & 0.011367 & 0.1181 & 0.453092 \tabularnewline
15 & -0.237021 & -2.4632 & 0.007675 \tabularnewline
16 & -0.093649 & -0.9732 & 0.166308 \tabularnewline
17 & 0.176071 & 1.8298 & 0.035021 \tabularnewline
18 & -0.025738 & -0.2675 & 0.394806 \tabularnewline
19 & -0.061195 & -0.636 & 0.263076 \tabularnewline
20 & -0.066833 & -0.6946 & 0.244414 \tabularnewline
21 & -0.04945 & -0.5139 & 0.304186 \tabularnewline
22 & -0.07954 & -0.8266 & 0.205142 \tabularnewline
23 & -0.006445 & -0.067 & 0.473361 \tabularnewline
24 & 0.060936 & 0.6333 & 0.263949 \tabularnewline
25 & -0.014187 & -0.1474 & 0.441533 \tabularnewline
26 & -0.110451 & -1.1478 & 0.126785 \tabularnewline
27 & 0.049636 & 0.5158 & 0.303513 \tabularnewline
28 & -0.020428 & -0.2123 & 0.416141 \tabularnewline
29 & -0.009276 & -0.0964 & 0.461691 \tabularnewline
30 & -0.045592 & -0.4738 & 0.318296 \tabularnewline
31 & 0.089993 & 0.9352 & 0.175877 \tabularnewline
32 & 0.019002 & 0.1975 & 0.421914 \tabularnewline
33 & -0.039678 & -0.4123 & 0.34045 \tabularnewline
34 & 0.006387 & 0.0664 & 0.473602 \tabularnewline
35 & -0.044473 & -0.4622 & 0.322444 \tabularnewline
36 & 0.059078 & 0.614 & 0.270268 \tabularnewline
37 & -0.039405 & -0.4095 & 0.341489 \tabularnewline
38 & 0.035303 & 0.3669 & 0.357213 \tabularnewline
39 & -0.089894 & -0.9342 & 0.176141 \tabularnewline
40 & -0.141626 & -1.4718 & 0.071989 \tabularnewline
41 & 0.151373 & 1.5731 & 0.059309 \tabularnewline
42 & 0.129208 & 1.3428 & 0.09108 \tabularnewline
43 & -0.075109 & -0.7806 & 0.218387 \tabularnewline
44 & -0.042029 & -0.4368 & 0.331572 \tabularnewline
45 & -0.129964 & -1.3506 & 0.089819 \tabularnewline
46 & 0.111395 & 1.1576 & 0.124781 \tabularnewline
47 & -0.014319 & -0.1488 & 0.440993 \tabularnewline
48 & -0.045097 & -0.4687 & 0.320128 \tabularnewline
\hline
\end{tabular}
%Source: https://freestatistics.org/blog/index.php?pk=301406&T=2

[TABLE]
[ROW][C]Partial Autocorrelation Function[/C][/ROW]
[ROW][C]Time lag k[/C][C]PACF(k)[/C][C]T-STAT[/C][C]P-value[/C][/ROW]
[ROW][C]1[/C][C]0.700838[/C][C]7.2833[/C][C]0[/C][/ROW]
[ROW][C]2[/C][C]0.049806[/C][C]0.5176[/C][C]0.302898[/C][/ROW]
[ROW][C]3[/C][C]-0.17817[/C][C]-1.8516[/C][C]0.033408[/C][/ROW]
[ROW][C]4[/C][C]-0.228649[/C][C]-2.3762[/C][C]0.009627[/C][/ROW]
[ROW][C]5[/C][C]-0.076296[/C][C]-0.7929[/C][C]0.214789[/C][/ROW]
[ROW][C]6[/C][C]0.003049[/C][C]0.0317[/C][C]0.487389[/C][/ROW]
[ROW][C]7[/C][C]0.240628[/C][C]2.5007[/C][C]0.006949[/C][/ROW]
[ROW][C]8[/C][C]0.099727[/C][C]1.0364[/C][C]0.151166[/C][/ROW]
[ROW][C]9[/C][C]0.352149[/C][C]3.6596[/C][C]0.000196[/C][/ROW]
[ROW][C]10[/C][C]0.232946[/C][C]2.4208[/C][C]0.008576[/C][/ROW]
[ROW][C]11[/C][C]0.080645[/C][C]0.8381[/C][C]0.201916[/C][/ROW]
[ROW][C]12[/C][C]0.092886[/C][C]0.9653[/C][C]0.168275[/C][/ROW]
[ROW][C]13[/C][C]-0.047919[/C][C]-0.498[/C][C]0.309751[/C][/ROW]
[ROW][C]14[/C][C]0.011367[/C][C]0.1181[/C][C]0.453092[/C][/ROW]
[ROW][C]15[/C][C]-0.237021[/C][C]-2.4632[/C][C]0.007675[/C][/ROW]
[ROW][C]16[/C][C]-0.093649[/C][C]-0.9732[/C][C]0.166308[/C][/ROW]
[ROW][C]17[/C][C]0.176071[/C][C]1.8298[/C][C]0.035021[/C][/ROW]
[ROW][C]18[/C][C]-0.025738[/C][C]-0.2675[/C][C]0.394806[/C][/ROW]
[ROW][C]19[/C][C]-0.061195[/C][C]-0.636[/C][C]0.263076[/C][/ROW]
[ROW][C]20[/C][C]-0.066833[/C][C]-0.6946[/C][C]0.244414[/C][/ROW]
[ROW][C]21[/C][C]-0.04945[/C][C]-0.5139[/C][C]0.304186[/C][/ROW]
[ROW][C]22[/C][C]-0.07954[/C][C]-0.8266[/C][C]0.205142[/C][/ROW]
[ROW][C]23[/C][C]-0.006445[/C][C]-0.067[/C][C]0.473361[/C][/ROW]
[ROW][C]24[/C][C]0.060936[/C][C]0.6333[/C][C]0.263949[/C][/ROW]
[ROW][C]25[/C][C]-0.014187[/C][C]-0.1474[/C][C]0.441533[/C][/ROW]
[ROW][C]26[/C][C]-0.110451[/C][C]-1.1478[/C][C]0.126785[/C][/ROW]
[ROW][C]27[/C][C]0.049636[/C][C]0.5158[/C][C]0.303513[/C][/ROW]
[ROW][C]28[/C][C]-0.020428[/C][C]-0.2123[/C][C]0.416141[/C][/ROW]
[ROW][C]29[/C][C]-0.009276[/C][C]-0.0964[/C][C]0.461691[/C][/ROW]
[ROW][C]30[/C][C]-0.045592[/C][C]-0.4738[/C][C]0.318296[/C][/ROW]
[ROW][C]31[/C][C]0.089993[/C][C]0.9352[/C][C]0.175877[/C][/ROW]
[ROW][C]32[/C][C]0.019002[/C][C]0.1975[/C][C]0.421914[/C][/ROW]
[ROW][C]33[/C][C]-0.039678[/C][C]-0.4123[/C][C]0.34045[/C][/ROW]
[ROW][C]34[/C][C]0.006387[/C][C]0.0664[/C][C]0.473602[/C][/ROW]
[ROW][C]35[/C][C]-0.044473[/C][C]-0.4622[/C][C]0.322444[/C][/ROW]
[ROW][C]36[/C][C]0.059078[/C][C]0.614[/C][C]0.270268[/C][/ROW]
[ROW][C]37[/C][C]-0.039405[/C][C]-0.4095[/C][C]0.341489[/C][/ROW]
[ROW][C]38[/C][C]0.035303[/C][C]0.3669[/C][C]0.357213[/C][/ROW]
[ROW][C]39[/C][C]-0.089894[/C][C]-0.9342[/C][C]0.176141[/C][/ROW]
[ROW][C]40[/C][C]-0.141626[/C][C]-1.4718[/C][C]0.071989[/C][/ROW]
[ROW][C]41[/C][C]0.151373[/C][C]1.5731[/C][C]0.059309[/C][/ROW]
[ROW][C]42[/C][C]0.129208[/C][C]1.3428[/C][C]0.09108[/C][/ROW]
[ROW][C]43[/C][C]-0.075109[/C][C]-0.7806[/C][C]0.218387[/C][/ROW]
[ROW][C]44[/C][C]-0.042029[/C][C]-0.4368[/C][C]0.331572[/C][/ROW]
[ROW][C]45[/C][C]-0.129964[/C][C]-1.3506[/C][C]0.089819[/C][/ROW]
[ROW][C]46[/C][C]0.111395[/C][C]1.1576[/C][C]0.124781[/C][/ROW]
[ROW][C]47[/C][C]-0.014319[/C][C]-0.1488[/C][C]0.440993[/C][/ROW]
[ROW][C]48[/C][C]-0.045097[/C][C]-0.4687[/C][C]0.320128[/C][/ROW]
[/TABLE]
Source: https://freestatistics.org/blog/index.php?pk=301406&T=2

Globally Unique Identifier (entire table): ba.freestatistics.org/blog/index.php?pk=301406&T=2

As an alternative you can also use a QR Code:  

The GUIDs for individual cells are displayed in the table below:

Partial Autocorrelation Function
Time lag kPACF(k)T-STATP-value
10.7008387.28330
20.0498060.51760.302898
3-0.17817-1.85160.033408
4-0.228649-2.37620.009627
5-0.076296-0.79290.214789
60.0030490.03170.487389
70.2406282.50070.006949
80.0997271.03640.151166
90.3521493.65960.000196
100.2329462.42080.008576
110.0806450.83810.201916
120.0928860.96530.168275
13-0.047919-0.4980.309751
140.0113670.11810.453092
15-0.237021-2.46320.007675
16-0.093649-0.97320.166308
170.1760711.82980.035021
18-0.025738-0.26750.394806
19-0.061195-0.6360.263076
20-0.066833-0.69460.244414
21-0.04945-0.51390.304186
22-0.07954-0.82660.205142
23-0.006445-0.0670.473361
240.0609360.63330.263949
25-0.014187-0.14740.441533
26-0.110451-1.14780.126785
270.0496360.51580.303513
28-0.020428-0.21230.416141
29-0.009276-0.09640.461691
30-0.045592-0.47380.318296
310.0899930.93520.175877
320.0190020.19750.421914
33-0.039678-0.41230.34045
340.0063870.06640.473602
35-0.044473-0.46220.322444
360.0590780.6140.270268
37-0.039405-0.40950.341489
380.0353030.36690.357213
39-0.089894-0.93420.176141
40-0.141626-1.47180.071989
410.1513731.57310.059309
420.1292081.34280.09108
43-0.075109-0.78060.218387
44-0.042029-0.43680.331572
45-0.129964-1.35060.089819
460.1113951.15760.124781
47-0.014319-0.14880.440993
48-0.045097-0.46870.320128


Parameters (Session):
par1 = 48 ; par2 = 1 ; par3 = 0 ; par4 = 0 ; par5 = 12 ; par6 = White Noise ; par7 = 0.95 ;
Parameters (R input):
par1 = 48 ; par2 = 1 ; par3 = 0 ; par4 = 0 ; par5 = 12 ; par6 = White Noise ; par7 = 0.95 ; par8 = ;
R code (references can be found in the software module):
par8 <- ''
par7 <- '0.95'
par6 <- 'White Noise'
par5 <- '12'
par4 <- '0'
par3 <- '0'
par2 <- '1'
par1 <- 'Default'
if (par1 == 'Default') {
par1 = 10*log10(length(x))
} else {
par1 <- as.numeric(par1)
}
par2 <- as.numeric(par2)
par3 <- as.numeric(par3)
par4 <- as.numeric(par4)
par5 <- as.numeric(par5)
if (par6 == 'White Noise') par6 <- 'white' else par6 <- 'ma'
par7 <- as.numeric(par7)
if (par8 != '') par8 <- as.numeric(par8)
x <- na.omit(x)
ox <- x
if (par8 == '') {
if (par2 == 0) {
x <- log(x)
} else {
x <- (x ^ par2 - 1) / par2
}
} else {
x <- log(x,base=par8)
}
if (par3 > 0) x <- diff(x,lag=1,difference=par3)
if (par4 > 0) x <- diff(x,lag=par5,difference=par4)
bitmap(file='picts.png')
op <- par(mfrow=c(2,1))
plot(ox,type='l',main='Original Time Series',xlab='time',ylab='value')
if (par8=='') {
mytitle <- paste('Working Time Series (lambda=',par2,', d=',par3,', D=',par4,')',sep='')
mysub <- paste('(lambda=',par2,', d=',par3,', D=',par4,', CI=', par7, ', CI type=',par6,')',sep='')
} else {
mytitle <- paste('Working Time Series (base=',par8,', d=',par3,', D=',par4,')',sep='')
mysub <- paste('(base=',par8,', d=',par3,', D=',par4,', CI=', par7, ', CI type=',par6,')',sep='')
}
plot(x,type='l', main=mytitle,xlab='time',ylab='value')
par(op)
dev.off()
bitmap(file='pic1.png')
racf <- acf(x, par1, main='Autocorrelation', xlab='time lag', ylab='ACF', ci.type=par6, ci=par7, sub=mysub)
dev.off()
bitmap(file='pic2.png')
rpacf <- pacf(x,par1,main='Partial Autocorrelation',xlab='lags',ylab='PACF',sub=mysub)
dev.off()
(myacf <- c(racf$acf))
(mypacf <- c(rpacf$acf))
lengthx <- length(x)
sqrtn <- sqrt(lengthx)
load(file='createtable')
a<-table.start()
a<-table.row.start(a)
a<-table.element(a,'Autocorrelation Function',4,TRUE)
a<-table.row.end(a)
a<-table.row.start(a)
a<-table.element(a,'Time lag k',header=TRUE)
a<-table.element(a,'ACF(k)',header=TRUE)
a<-table.element(a,'T-STAT',header=TRUE)
a<-table.element(a,'P-value',header=TRUE)
a<-table.row.end(a)
for (i in 2:(par1+1)) {
a<-table.row.start(a)
a<-table.element(a,i-1,header=TRUE)
a<-table.element(a,round(myacf[i],6))
mytstat <- myacf[i]*sqrtn
a<-table.element(a,round(mytstat,4))
a<-table.element(a,round(1-pt(abs(mytstat),lengthx),6))
a<-table.row.end(a)
}
a<-table.end(a)
table.save(a,file='mytable.tab')
a<-table.start()
a<-table.row.start(a)
a<-table.element(a,'Partial Autocorrelation Function',4,TRUE)
a<-table.row.end(a)
a<-table.row.start(a)
a<-table.element(a,'Time lag k',header=TRUE)
a<-table.element(a,'PACF(k)',header=TRUE)
a<-table.element(a,'T-STAT',header=TRUE)
a<-table.element(a,'P-value',header=TRUE)
a<-table.row.end(a)
for (i in 1:par1) {
a<-table.row.start(a)
a<-table.element(a,i,header=TRUE)
a<-table.element(a,round(mypacf[i],6))
mytstat <- mypacf[i]*sqrtn
a<-table.element(a,round(mytstat,4))
a<-table.element(a,round(1-pt(abs(mytstat),lengthx),6))
a<-table.row.end(a)
}
a<-table.end(a)
table.save(a,file='mytable1.tab')