Free Statistics

of Irreproducible Research!

Author's title

Author*The author of this computation has been verified*
R Software Modulerwasp_smp.wasp
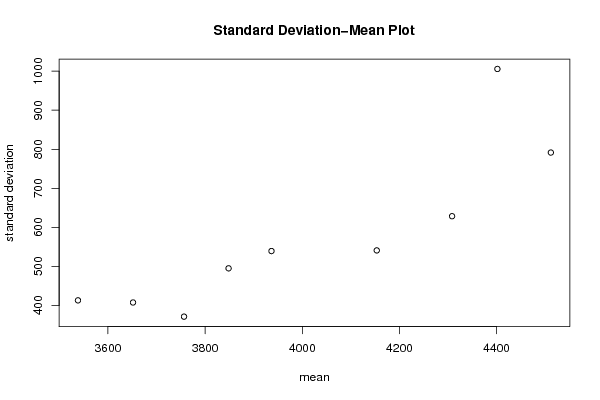
Title produced by softwareStandard Deviation-Mean Plot
Date of computationMon, 19 Dec 2016 14:30:39 +0100
Cite this page as followsStatistical Computations at FreeStatistics.org, Office for Research Development and Education, URL https://freestatistics.org/blog/index.php?v=date/2016/Dec/19/t1482154285bhkfkarp2d9d3c6.htm/, Retrieved Fri, 01 Nov 2024 03:33:03 +0000
Statistical Computations at FreeStatistics.org, Office for Research Development and Education, URL https://freestatistics.org/blog/index.php?pk=301344, Retrieved Fri, 01 Nov 2024 03:33:03 +0000
QR Codes:

Original text written by user:
IsPrivate?No (this computation is public)
User-defined keywords
Estimated Impact108
Family? (F = Feedback message, R = changed R code, M = changed R Module, P = changed Parameters, D = changed Data)
-       [Standard Deviation-Mean Plot] [Standard Deviatio...] [2016-12-19 13:30:39] [e0044ff8caf2d68149dcdb0ba8e86f31] [Current]
Feedback Forum

Post a new message
Dataseries X:
3440
3620
3600
4140
4820
3940
3860
4680
5000
4480
4600
3660
3660
3780
4140
4000
4340
6440
3880
4780
4960
5340
4640
4180
3860
3760
3860
3460
3620
7220
4480
4440
4940
4820
4420
3940
3560
3660
4140
3680
4540
3820
5680
4520
4640
4820
4740
3900
3300
3520
3840
3500
3300
3840
4000
4180
5020
4540
4520
3680
3580
3500
3440
3560
3320
3220
4180
4460
4420
4620
4220
3660
3440
3700
3500
3240
3200
4180
4100
4120
4240
4020
3780
3560
3360
3240
3540
3300
3280
4200
3340
3900
4380
4120
3780
3380
3260
3320
3380
3100
3240
3100
3240
3640
4140
4240
4040
3760
NA
NA
NA
NA
NA
NA
NA
NA
NA
NA
NA
NA
NA
NA
NA
NA
NA
NA
NA
NA
NA
NA
NA
NA
NA
NA
NA
NA
NA
NA
NA
NA
NA
NA
NA
NA


Summary of computational transaction
Raw Input view raw input (R code)
Raw Outputview raw output of R engine
Computing time1 seconds
R ServerBig Analytics Cloud Computing Center

\begin{tabular}{lllllllll}
\hline
Summary of computational transaction \tabularnewline
Raw Input view raw input (R code)  \tabularnewline
Raw Outputview raw output of R engine  \tabularnewline
Computing time1 seconds \tabularnewline
R ServerBig Analytics Cloud Computing Center \tabularnewline
\hline
\end{tabular}
%Source: https://freestatistics.org/blog/index.php?pk=301344&T=0

[TABLE]
[ROW]
Summary of computational transaction[/C][/ROW] [ROW]Raw Input[/C] view raw input (R code) [/C][/ROW] [ROW]Raw Output[/C]view raw output of R engine [/C][/ROW] [ROW]Computing time[/C]1 seconds[/C][/ROW] [ROW]R Server[/C]Big Analytics Cloud Computing Center[/C][/ROW] [/TABLE] Source: https://freestatistics.org/blog/index.php?pk=301344&T=0

Globally Unique Identifier (entire table): ba.freestatistics.org/blog/index.php?pk=301344&T=0

As an alternative you can also use a QR Code:  

The GUIDs for individual cells are displayed in the table below:

Summary of computational transaction
Raw Input view raw input (R code)
Raw Outputview raw output of R engine
Computing time1 seconds
R ServerBig Analytics Cloud Computing Center


Standard Deviation-Mean Plot
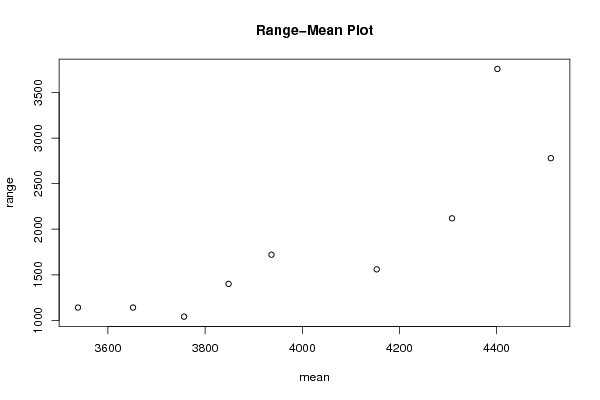
SectionMeanStandard DeviationRange
14153.33333333333540.9979555218191560
24511.66666666667791.6132358364882780
34401.666666666671005.673300768593760
44308.33333333333628.6180128349862120
53936.66666666667539.4160703665561720
63848.33333333333495.1736762964791400
73756.66666666667371.4182482747921040
83651.66666666667407.6949245638851140
93538.33333333333413.1879020787551140
10NaNNA-Inf
11NaNNA-Inf
12NaNNA-Inf

\begin{tabular}{lllllllll}
\hline
Standard Deviation-Mean Plot \tabularnewline
Section & Mean & Standard Deviation & Range \tabularnewline
1 & 4153.33333333333 & 540.997955521819 & 1560 \tabularnewline
2 & 4511.66666666667 & 791.613235836488 & 2780 \tabularnewline
3 & 4401.66666666667 & 1005.67330076859 & 3760 \tabularnewline
4 & 4308.33333333333 & 628.618012834986 & 2120 \tabularnewline
5 & 3936.66666666667 & 539.416070366556 & 1720 \tabularnewline
6 & 3848.33333333333 & 495.173676296479 & 1400 \tabularnewline
7 & 3756.66666666667 & 371.418248274792 & 1040 \tabularnewline
8 & 3651.66666666667 & 407.694924563885 & 1140 \tabularnewline
9 & 3538.33333333333 & 413.187902078755 & 1140 \tabularnewline
10 & NaN & NA & -Inf \tabularnewline
11 & NaN & NA & -Inf \tabularnewline
12 & NaN & NA & -Inf \tabularnewline
\hline
\end{tabular}
%Source: https://freestatistics.org/blog/index.php?pk=301344&T=1

[TABLE]
[ROW][C]Standard Deviation-Mean Plot[/C][/ROW]
[ROW][C]Section[/C][C]Mean[/C][C]Standard Deviation[/C][C]Range[/C][/ROW]
[ROW][C]1[/C][C]4153.33333333333[/C][C]540.997955521819[/C][C]1560[/C][/ROW]
[ROW][C]2[/C][C]4511.66666666667[/C][C]791.613235836488[/C][C]2780[/C][/ROW]
[ROW][C]3[/C][C]4401.66666666667[/C][C]1005.67330076859[/C][C]3760[/C][/ROW]
[ROW][C]4[/C][C]4308.33333333333[/C][C]628.618012834986[/C][C]2120[/C][/ROW]
[ROW][C]5[/C][C]3936.66666666667[/C][C]539.416070366556[/C][C]1720[/C][/ROW]
[ROW][C]6[/C][C]3848.33333333333[/C][C]495.173676296479[/C][C]1400[/C][/ROW]
[ROW][C]7[/C][C]3756.66666666667[/C][C]371.418248274792[/C][C]1040[/C][/ROW]
[ROW][C]8[/C][C]3651.66666666667[/C][C]407.694924563885[/C][C]1140[/C][/ROW]
[ROW][C]9[/C][C]3538.33333333333[/C][C]413.187902078755[/C][C]1140[/C][/ROW]
[ROW][C]10[/C][C]NaN[/C][C]NA[/C][C]-Inf[/C][/ROW]
[ROW][C]11[/C][C]NaN[/C][C]NA[/C][C]-Inf[/C][/ROW]
[ROW][C]12[/C][C]NaN[/C][C]NA[/C][C]-Inf[/C][/ROW]
[/TABLE]
Source: https://freestatistics.org/blog/index.php?pk=301344&T=1

Globally Unique Identifier (entire table): ba.freestatistics.org/blog/index.php?pk=301344&T=1

As an alternative you can also use a QR Code:  

The GUIDs for individual cells are displayed in the table below:

Standard Deviation-Mean Plot
SectionMeanStandard DeviationRange
14153.33333333333540.9979555218191560
24511.66666666667791.6132358364882780
34401.666666666671005.673300768593760
44308.33333333333628.6180128349862120
53936.66666666667539.4160703665561720
63848.33333333333495.1736762964791400
73756.66666666667371.4182482747921040
83651.66666666667407.6949245638851140
93538.33333333333413.1879020787551140
10NaNNA-Inf
11NaNNA-Inf
12NaNNA-Inf


Regression: S.E.(k) = alpha + beta * Mean(k)
alpha-1475.67232534055
beta0.511674046933363
S.D.0.114372985902752
T-STAT4.47373164995816
p-value0.00288795002517905

\begin{tabular}{lllllllll}
\hline
Regression: S.E.(k) = alpha + beta * Mean(k) \tabularnewline
alpha & -1475.67232534055 \tabularnewline
beta & 0.511674046933363 \tabularnewline
S.D. & 0.114372985902752 \tabularnewline
T-STAT & 4.47373164995816 \tabularnewline
p-value & 0.00288795002517905 \tabularnewline
\hline
\end{tabular}
%Source: https://freestatistics.org/blog/index.php?pk=301344&T=2

[TABLE]
[ROW][C]Regression: S.E.(k) = alpha + beta * Mean(k)[/C][/ROW]
[ROW][C]alpha[/C][C]-1475.67232534055[/C][/ROW]
[ROW][C]beta[/C][C]0.511674046933363[/C][/ROW]
[ROW][C]S.D.[/C][C]0.114372985902752[/C][/ROW]
[ROW][C]T-STAT[/C][C]4.47373164995816[/C][/ROW]
[ROW][C]p-value[/C][C]0.00288795002517905[/C][/ROW]
[/TABLE]
Source: https://freestatistics.org/blog/index.php?pk=301344&T=2

Globally Unique Identifier (entire table): ba.freestatistics.org/blog/index.php?pk=301344&T=2

As an alternative you can also use a QR Code:  

The GUIDs for individual cells are displayed in the table below:

Regression: S.E.(k) = alpha + beta * Mean(k)
alpha-1475.67232534055
beta0.511674046933363
S.D.0.114372985902752
T-STAT4.47373164995816
p-value0.00288795002517905


Regression: ln S.E.(k) = alpha + beta * ln Mean(k)
alpha-21.8334437387262
beta3.39310714561454
S.D.0.630115544231732
T-STAT5.38489674897892
p-value0.00102496359985362
Lambda-2.39310714561454

\begin{tabular}{lllllllll}
\hline
Regression: ln S.E.(k) = alpha + beta * ln Mean(k) \tabularnewline
alpha & -21.8334437387262 \tabularnewline
beta & 3.39310714561454 \tabularnewline
S.D. & 0.630115544231732 \tabularnewline
T-STAT & 5.38489674897892 \tabularnewline
p-value & 0.00102496359985362 \tabularnewline
Lambda & -2.39310714561454 \tabularnewline
\hline
\end{tabular}
%Source: https://freestatistics.org/blog/index.php?pk=301344&T=3

[TABLE]
[ROW][C]Regression: ln S.E.(k) = alpha + beta * ln Mean(k)[/C][/ROW]
[ROW][C]alpha[/C][C]-21.8334437387262[/C][/ROW]
[ROW][C]beta[/C][C]3.39310714561454[/C][/ROW]
[ROW][C]S.D.[/C][C]0.630115544231732[/C][/ROW]
[ROW][C]T-STAT[/C][C]5.38489674897892[/C][/ROW]
[ROW][C]p-value[/C][C]0.00102496359985362[/C][/ROW]
[ROW][C]Lambda[/C][C]-2.39310714561454[/C][/ROW]
[/TABLE]
Source: https://freestatistics.org/blog/index.php?pk=301344&T=3

Globally Unique Identifier (entire table): ba.freestatistics.org/blog/index.php?pk=301344&T=3

As an alternative you can also use a QR Code:  

The GUIDs for individual cells are displayed in the table below:

Regression: ln S.E.(k) = alpha + beta * ln Mean(k)
alpha-21.8334437387262
beta3.39310714561454
S.D.0.630115544231732
T-STAT5.38489674897892
p-value0.00102496359985362
Lambda-2.39310714561454


Parameters (Session):
par1 = 12 ;
Parameters (R input):
par1 = 12 ;
R code (references can be found in the software module):
par1 <- as.numeric(par1)
(n <- length(x))
(np <- floor(n / par1))
arr <- array(NA,dim=c(par1,np))
j <- 0
k <- 1
for (i in 1:(np*par1))
{
j = j + 1
arr[j,k] <- x[i]
if (j == par1) {
j = 0
k=k+1
}
}
arr
arr.mean <- array(NA,dim=np)
arr.sd <- array(NA,dim=np)
arr.range <- array(NA,dim=np)
for (j in 1:np)
{
arr.mean[j] <- mean(arr[,j],na.rm=TRUE)
arr.sd[j] <- sd(arr[,j],na.rm=TRUE)
arr.range[j] <- max(arr[,j],na.rm=TRUE) - min(arr[,j],na.rm=TRUE)
}
arr.mean
arr.sd
arr.range
(lm1 <- lm(arr.sd~arr.mean))
(lnlm1 <- lm(log(arr.sd)~log(arr.mean)))
(lm2 <- lm(arr.range~arr.mean))
bitmap(file='test1.png')
plot(arr.mean,arr.sd,main='Standard Deviation-Mean Plot',xlab='mean',ylab='standard deviation')
dev.off()
bitmap(file='test2.png')
plot(arr.mean,arr.range,main='Range-Mean Plot',xlab='mean',ylab='range')
dev.off()
load(file='createtable')
a<-table.start()
a<-table.row.start(a)
a<-table.element(a,'Standard Deviation-Mean Plot',4,TRUE)
a<-table.row.end(a)
a<-table.row.start(a)
a<-table.element(a,'Section',header=TRUE)
a<-table.element(a,'Mean',header=TRUE)
a<-table.element(a,'Standard Deviation',header=TRUE)
a<-table.element(a,'Range',header=TRUE)
a<-table.row.end(a)
for (j in 1:np) {
a<-table.row.start(a)
a<-table.element(a,j,header=TRUE)
a<-table.element(a,arr.mean[j])
a<-table.element(a,arr.sd[j] )
a<-table.element(a,arr.range[j] )
a<-table.row.end(a)
}
a<-table.end(a)
table.save(a,file='mytable.tab')
a<-table.start()
a<-table.row.start(a)
a<-table.element(a,'Regression: S.E.(k) = alpha + beta * Mean(k)',2,TRUE)
a<-table.row.end(a)
a<-table.row.start(a)
a<-table.element(a,'alpha',header=TRUE)
a<-table.element(a,lm1$coefficients[[1]])
a<-table.row.end(a)
a<-table.row.start(a)
a<-table.element(a,'beta',header=TRUE)
a<-table.element(a,lm1$coefficients[[2]])
a<-table.row.end(a)
a<-table.row.start(a)
a<-table.element(a,'S.D.',header=TRUE)
a<-table.element(a,summary(lm1)$coefficients[2,2])
a<-table.row.end(a)
a<-table.row.start(a)
a<-table.element(a,'T-STAT',header=TRUE)
a<-table.element(a,summary(lm1)$coefficients[2,3])
a<-table.row.end(a)
a<-table.row.start(a)
a<-table.element(a,'p-value',header=TRUE)
a<-table.element(a,summary(lm1)$coefficients[2,4])
a<-table.row.end(a)
a<-table.end(a)
table.save(a,file='mytable1.tab')
a<-table.start()
a<-table.row.start(a)
a<-table.element(a,'Regression: ln S.E.(k) = alpha + beta * ln Mean(k)',2,TRUE)
a<-table.row.end(a)
a<-table.row.start(a)
a<-table.element(a,'alpha',header=TRUE)
a<-table.element(a,lnlm1$coefficients[[1]])
a<-table.row.end(a)
a<-table.row.start(a)
a<-table.element(a,'beta',header=TRUE)
a<-table.element(a,lnlm1$coefficients[[2]])
a<-table.row.end(a)
a<-table.row.start(a)
a<-table.element(a,'S.D.',header=TRUE)
a<-table.element(a,summary(lnlm1)$coefficients[2,2])
a<-table.row.end(a)
a<-table.row.start(a)
a<-table.element(a,'T-STAT',header=TRUE)
a<-table.element(a,summary(lnlm1)$coefficients[2,3])
a<-table.row.end(a)
a<-table.row.start(a)
a<-table.element(a,'p-value',header=TRUE)
a<-table.element(a,summary(lnlm1)$coefficients[2,4])
a<-table.row.end(a)
a<-table.row.start(a)
a<-table.element(a,'Lambda',header=TRUE)
a<-table.element(a,1-lnlm1$coefficients[[2]])
a<-table.row.end(a)
a<-table.end(a)
table.save(a,file='mytable2.tab')