Free Statistics

of Irreproducible Research!

Author's title

Author*The author of this computation has been verified*
R Software Modulerwasp_autocorrelation.wasp
Title produced by software(Partial) Autocorrelation Function
Date of computationSun, 18 Dec 2016 14:25:37 +0100
Cite this page as followsStatistical Computations at FreeStatistics.org, Office for Research Development and Education, URL https://freestatistics.org/blog/index.php?v=date/2016/Dec/18/t1482067553vvs4c8sx3ct78j5.htm/, Retrieved Sun, 10 Nov 2024 20:53:51 +0000
Statistical Computations at FreeStatistics.org, Office for Research Development and Education, URL https://freestatistics.org/blog/index.php?pk=301067, Retrieved Sun, 10 Nov 2024 20:53:51 +0000
QR Codes:

Original text written by user:
IsPrivate?No (this computation is public)
User-defined keywords
Estimated Impact132
Family? (F = Feedback message, R = changed R code, M = changed R Module, P = changed Parameters, D = changed Data)
-     [Exponential Smoothing] [] [2016-12-18 12:31:12] [683f400e1b95307fc738e729f07c4fce]
- RM D    [(Partial) Autocorrelation Function] [] [2016-12-18 13:25:37] [404ac5ee4f7301873f6a96ef36861981] [Current]
- R P       [(Partial) Autocorrelation Function] [] [2016-12-20 22:53:44] [683f400e1b95307fc738e729f07c4fce]
-   P       [(Partial) Autocorrelation Function] [] [2016-12-20 22:57:51] [683f400e1b95307fc738e729f07c4fce]
- RMP       [Spectral Analysis] [] [2016-12-20 23:03:30] [683f400e1b95307fc738e729f07c4fce]
Feedback Forum

Post a new message
Dataseries X:
2280
3640
3950
3860
3500
4740
3690
4810
6150
4530
4760
4670
3510
2990
3240
2700
2610
3280
3170
3440
4710
4320
3650
3340
3050
2960
2810
2670
2440
2580
2520
2860
3500
3460
3310
3050
2730
2760
2800
2490
2310
2350
2370
2560
2740
2830
3010
2500
2630
2270
2410
2210
2330
2690
3150
2330
2260
2330
2240
2230
2270
2220
2290
2240
2110
2240
2230
2320
2320
2540
2530
2400
2470
2290
2110
2050
2170
2070
2330
2190
2260
2300
2220
2220
2380
2280
2150
2190
2080
2120
2140
2130
2210
2210
2190
2160
2290
2270
2200
2120
2050
2080
2180
2070
2170
2240
2320
2250


Summary of computational transaction
Raw Input view raw input (R code)
Raw Outputview raw output of R engine
Computing time1 seconds
R ServerBig Analytics Cloud Computing Center

\begin{tabular}{lllllllll}
\hline
Summary of computational transaction \tabularnewline
Raw Input view raw input (R code)  \tabularnewline
Raw Outputview raw output of R engine  \tabularnewline
Computing time1 seconds \tabularnewline
R ServerBig Analytics Cloud Computing Center \tabularnewline
\hline
\end{tabular}
%Source: https://freestatistics.org/blog/index.php?pk=301067&T=0

[TABLE]
[ROW]
Summary of computational transaction[/C][/ROW] [ROW]Raw Input[/C] view raw input (R code) [/C][/ROW] [ROW]Raw Output[/C]view raw output of R engine [/C][/ROW] [ROW]Computing time[/C]1 seconds[/C][/ROW] [ROW]R Server[/C]Big Analytics Cloud Computing Center[/C][/ROW] [/TABLE] Source: https://freestatistics.org/blog/index.php?pk=301067&T=0

Globally Unique Identifier (entire table): ba.freestatistics.org/blog/index.php?pk=301067&T=0

As an alternative you can also use a QR Code:  

The GUIDs for individual cells are displayed in the table below:

Summary of computational transaction
Raw Input view raw input (R code)
Raw Outputview raw output of R engine
Computing time1 seconds
R ServerBig Analytics Cloud Computing Center


Autocorrelation Function
Time lag kACF(k)T-STATP-value
1-0.013819-0.14090.4441
20.1593091.62460.053633
3-0.379578-3.87099.5e-05
4-0.150051-1.53020.064499
5-0.044428-0.45310.325718
6-0.127861-1.30390.097568
70.04670.47620.31745
8-0.109992-1.12170.132286
9-0.044855-0.45740.324158
10-0.007495-0.07640.469609
110.0695830.70960.239767
120.2518112.5680.005825
130.2059482.10030.019062
14-0.051201-0.52210.30134
15-0.104926-1.070.143539
16-0.169454-1.72810.043469
170.060970.62180.267726
18-0.041026-0.41840.338264
190.0340610.34740.364513
20-0.068268-0.69620.24393

\begin{tabular}{lllllllll}
\hline
Autocorrelation Function \tabularnewline
Time lag k & ACF(k) & T-STAT & P-value \tabularnewline
1 & -0.013819 & -0.1409 & 0.4441 \tabularnewline
2 & 0.159309 & 1.6246 & 0.053633 \tabularnewline
3 & -0.379578 & -3.8709 & 9.5e-05 \tabularnewline
4 & -0.150051 & -1.5302 & 0.064499 \tabularnewline
5 & -0.044428 & -0.4531 & 0.325718 \tabularnewline
6 & -0.127861 & -1.3039 & 0.097568 \tabularnewline
7 & 0.0467 & 0.4762 & 0.31745 \tabularnewline
8 & -0.109992 & -1.1217 & 0.132286 \tabularnewline
9 & -0.044855 & -0.4574 & 0.324158 \tabularnewline
10 & -0.007495 & -0.0764 & 0.469609 \tabularnewline
11 & 0.069583 & 0.7096 & 0.239767 \tabularnewline
12 & 0.251811 & 2.568 & 0.005825 \tabularnewline
13 & 0.205948 & 2.1003 & 0.019062 \tabularnewline
14 & -0.051201 & -0.5221 & 0.30134 \tabularnewline
15 & -0.104926 & -1.07 & 0.143539 \tabularnewline
16 & -0.169454 & -1.7281 & 0.043469 \tabularnewline
17 & 0.06097 & 0.6218 & 0.267726 \tabularnewline
18 & -0.041026 & -0.4184 & 0.338264 \tabularnewline
19 & 0.034061 & 0.3474 & 0.364513 \tabularnewline
20 & -0.068268 & -0.6962 & 0.24393 \tabularnewline
\hline
\end{tabular}
%Source: https://freestatistics.org/blog/index.php?pk=301067&T=1

[TABLE]
[ROW][C]Autocorrelation Function[/C][/ROW]
[ROW][C]Time lag k[/C][C]ACF(k)[/C][C]T-STAT[/C][C]P-value[/C][/ROW]
[ROW][C]1[/C][C]-0.013819[/C][C]-0.1409[/C][C]0.4441[/C][/ROW]
[ROW][C]2[/C][C]0.159309[/C][C]1.6246[/C][C]0.053633[/C][/ROW]
[ROW][C]3[/C][C]-0.379578[/C][C]-3.8709[/C][C]9.5e-05[/C][/ROW]
[ROW][C]4[/C][C]-0.150051[/C][C]-1.5302[/C][C]0.064499[/C][/ROW]
[ROW][C]5[/C][C]-0.044428[/C][C]-0.4531[/C][C]0.325718[/C][/ROW]
[ROW][C]6[/C][C]-0.127861[/C][C]-1.3039[/C][C]0.097568[/C][/ROW]
[ROW][C]7[/C][C]0.0467[/C][C]0.4762[/C][C]0.31745[/C][/ROW]
[ROW][C]8[/C][C]-0.109992[/C][C]-1.1217[/C][C]0.132286[/C][/ROW]
[ROW][C]9[/C][C]-0.044855[/C][C]-0.4574[/C][C]0.324158[/C][/ROW]
[ROW][C]10[/C][C]-0.007495[/C][C]-0.0764[/C][C]0.469609[/C][/ROW]
[ROW][C]11[/C][C]0.069583[/C][C]0.7096[/C][C]0.239767[/C][/ROW]
[ROW][C]12[/C][C]0.251811[/C][C]2.568[/C][C]0.005825[/C][/ROW]
[ROW][C]13[/C][C]0.205948[/C][C]2.1003[/C][C]0.019062[/C][/ROW]
[ROW][C]14[/C][C]-0.051201[/C][C]-0.5221[/C][C]0.30134[/C][/ROW]
[ROW][C]15[/C][C]-0.104926[/C][C]-1.07[/C][C]0.143539[/C][/ROW]
[ROW][C]16[/C][C]-0.169454[/C][C]-1.7281[/C][C]0.043469[/C][/ROW]
[ROW][C]17[/C][C]0.06097[/C][C]0.6218[/C][C]0.267726[/C][/ROW]
[ROW][C]18[/C][C]-0.041026[/C][C]-0.4184[/C][C]0.338264[/C][/ROW]
[ROW][C]19[/C][C]0.034061[/C][C]0.3474[/C][C]0.364513[/C][/ROW]
[ROW][C]20[/C][C]-0.068268[/C][C]-0.6962[/C][C]0.24393[/C][/ROW]
[/TABLE]
Source: https://freestatistics.org/blog/index.php?pk=301067&T=1

Globally Unique Identifier (entire table): ba.freestatistics.org/blog/index.php?pk=301067&T=1

As an alternative you can also use a QR Code:  

The GUIDs for individual cells are displayed in the table below:

Autocorrelation Function
Time lag kACF(k)T-STATP-value
1-0.013819-0.14090.4441
20.1593091.62460.053633
3-0.379578-3.87099.5e-05
4-0.150051-1.53020.064499
5-0.044428-0.45310.325718
6-0.127861-1.30390.097568
70.04670.47620.31745
8-0.109992-1.12170.132286
9-0.044855-0.45740.324158
10-0.007495-0.07640.469609
110.0695830.70960.239767
120.2518112.5680.005825
130.2059482.10030.019062
14-0.051201-0.52210.30134
15-0.104926-1.070.143539
16-0.169454-1.72810.043469
170.060970.62180.267726
18-0.041026-0.41840.338264
190.0340610.34740.364513
20-0.068268-0.69620.24393


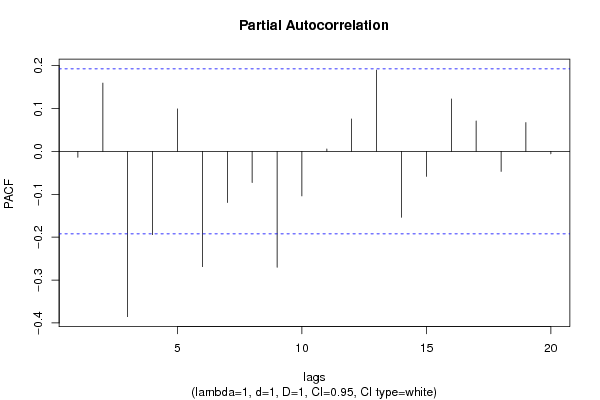
Partial Autocorrelation Function
Time lag kPACF(k)T-STATP-value
1-0.013819-0.14090.4441
20.1591491.6230.053808
3-0.385359-3.92997.7e-05
4-0.194207-1.98050.025142
50.0990411.010.157413
6-0.268725-2.74050.003611
7-0.119232-1.21590.113381
8-0.072446-0.73880.230845
9-0.270375-2.75730.003443
10-0.10381-1.05870.146105
110.0055910.0570.477319
120.0756510.77150.221083
130.1894251.93180.028055
14-0.153552-1.56590.060201
15-0.058295-0.59450.276736
160.1220241.24440.108073
170.0710220.72430.235259
18-0.046675-0.4760.317537
190.0670310.68360.247878
20-0.005757-0.05870.476649

\begin{tabular}{lllllllll}
\hline
Partial Autocorrelation Function \tabularnewline
Time lag k & PACF(k) & T-STAT & P-value \tabularnewline
1 & -0.013819 & -0.1409 & 0.4441 \tabularnewline
2 & 0.159149 & 1.623 & 0.053808 \tabularnewline
3 & -0.385359 & -3.9299 & 7.7e-05 \tabularnewline
4 & -0.194207 & -1.9805 & 0.025142 \tabularnewline
5 & 0.099041 & 1.01 & 0.157413 \tabularnewline
6 & -0.268725 & -2.7405 & 0.003611 \tabularnewline
7 & -0.119232 & -1.2159 & 0.113381 \tabularnewline
8 & -0.072446 & -0.7388 & 0.230845 \tabularnewline
9 & -0.270375 & -2.7573 & 0.003443 \tabularnewline
10 & -0.10381 & -1.0587 & 0.146105 \tabularnewline
11 & 0.005591 & 0.057 & 0.477319 \tabularnewline
12 & 0.075651 & 0.7715 & 0.221083 \tabularnewline
13 & 0.189425 & 1.9318 & 0.028055 \tabularnewline
14 & -0.153552 & -1.5659 & 0.060201 \tabularnewline
15 & -0.058295 & -0.5945 & 0.276736 \tabularnewline
16 & 0.122024 & 1.2444 & 0.108073 \tabularnewline
17 & 0.071022 & 0.7243 & 0.235259 \tabularnewline
18 & -0.046675 & -0.476 & 0.317537 \tabularnewline
19 & 0.067031 & 0.6836 & 0.247878 \tabularnewline
20 & -0.005757 & -0.0587 & 0.476649 \tabularnewline
\hline
\end{tabular}
%Source: https://freestatistics.org/blog/index.php?pk=301067&T=2

[TABLE]
[ROW][C]Partial Autocorrelation Function[/C][/ROW]
[ROW][C]Time lag k[/C][C]PACF(k)[/C][C]T-STAT[/C][C]P-value[/C][/ROW]
[ROW][C]1[/C][C]-0.013819[/C][C]-0.1409[/C][C]0.4441[/C][/ROW]
[ROW][C]2[/C][C]0.159149[/C][C]1.623[/C][C]0.053808[/C][/ROW]
[ROW][C]3[/C][C]-0.385359[/C][C]-3.9299[/C][C]7.7e-05[/C][/ROW]
[ROW][C]4[/C][C]-0.194207[/C][C]-1.9805[/C][C]0.025142[/C][/ROW]
[ROW][C]5[/C][C]0.099041[/C][C]1.01[/C][C]0.157413[/C][/ROW]
[ROW][C]6[/C][C]-0.268725[/C][C]-2.7405[/C][C]0.003611[/C][/ROW]
[ROW][C]7[/C][C]-0.119232[/C][C]-1.2159[/C][C]0.113381[/C][/ROW]
[ROW][C]8[/C][C]-0.072446[/C][C]-0.7388[/C][C]0.230845[/C][/ROW]
[ROW][C]9[/C][C]-0.270375[/C][C]-2.7573[/C][C]0.003443[/C][/ROW]
[ROW][C]10[/C][C]-0.10381[/C][C]-1.0587[/C][C]0.146105[/C][/ROW]
[ROW][C]11[/C][C]0.005591[/C][C]0.057[/C][C]0.477319[/C][/ROW]
[ROW][C]12[/C][C]0.075651[/C][C]0.7715[/C][C]0.221083[/C][/ROW]
[ROW][C]13[/C][C]0.189425[/C][C]1.9318[/C][C]0.028055[/C][/ROW]
[ROW][C]14[/C][C]-0.153552[/C][C]-1.5659[/C][C]0.060201[/C][/ROW]
[ROW][C]15[/C][C]-0.058295[/C][C]-0.5945[/C][C]0.276736[/C][/ROW]
[ROW][C]16[/C][C]0.122024[/C][C]1.2444[/C][C]0.108073[/C][/ROW]
[ROW][C]17[/C][C]0.071022[/C][C]0.7243[/C][C]0.235259[/C][/ROW]
[ROW][C]18[/C][C]-0.046675[/C][C]-0.476[/C][C]0.317537[/C][/ROW]
[ROW][C]19[/C][C]0.067031[/C][C]0.6836[/C][C]0.247878[/C][/ROW]
[ROW][C]20[/C][C]-0.005757[/C][C]-0.0587[/C][C]0.476649[/C][/ROW]
[/TABLE]
Source: https://freestatistics.org/blog/index.php?pk=301067&T=2

Globally Unique Identifier (entire table): ba.freestatistics.org/blog/index.php?pk=301067&T=2

As an alternative you can also use a QR Code:  

The GUIDs for individual cells are displayed in the table below:

Partial Autocorrelation Function
Time lag kPACF(k)T-STATP-value
1-0.013819-0.14090.4441
20.1591491.6230.053808
3-0.385359-3.92997.7e-05
4-0.194207-1.98050.025142
50.0990411.010.157413
6-0.268725-2.74050.003611
7-0.119232-1.21590.113381
8-0.072446-0.73880.230845
9-0.270375-2.75730.003443
10-0.10381-1.05870.146105
110.0055910.0570.477319
120.0756510.77150.221083
130.1894251.93180.028055
14-0.153552-1.56590.060201
15-0.058295-0.59450.276736
160.1220241.24440.108073
170.0710220.72430.235259
18-0.046675-0.4760.317537
190.0670310.68360.247878
20-0.005757-0.05870.476649


Parameters (Session):
par1 = 12 ; par2 = Double ; par3 = additive ; par4 = 12 ;
Parameters (R input):
par1 = Default ; par2 = 1 ; par3 = 1 ; par4 = 1 ; par5 = 3 ; par6 = White Noise ; par7 = 0.95 ; par8 = ;
R code (references can be found in the software module):
par8 <- ''
par7 <- '0.95'
par6 <- 'White Noise'
par5 <- '12'
par4 <- '0'
par3 <- '1'
par2 <- '1'
par1 <- 'Default'
if (par1 == 'Default') {
par1 = 10*log10(length(x))
} else {
par1 <- as.numeric(par1)
}
par2 <- as.numeric(par2)
par3 <- as.numeric(par3)
par4 <- as.numeric(par4)
par5 <- as.numeric(par5)
if (par6 == 'White Noise') par6 <- 'white' else par6 <- 'ma'
par7 <- as.numeric(par7)
if (par8 != '') par8 <- as.numeric(par8)
x <- na.omit(x)
ox <- x
if (par8 == '') {
if (par2 == 0) {
x <- log(x)
} else {
x <- (x ^ par2 - 1) / par2
}
} else {
x <- log(x,base=par8)
}
if (par3 > 0) x <- diff(x,lag=1,difference=par3)
if (par4 > 0) x <- diff(x,lag=par5,difference=par4)
bitmap(file='picts.png')
op <- par(mfrow=c(2,1))
plot(ox,type='l',main='Original Time Series',xlab='time',ylab='value')
if (par8=='') {
mytitle <- paste('Working Time Series (lambda=',par2,', d=',par3,', D=',par4,')',sep='')
mysub <- paste('(lambda=',par2,', d=',par3,', D=',par4,', CI=', par7, ', CI type=',par6,')',sep='')
} else {
mytitle <- paste('Working Time Series (base=',par8,', d=',par3,', D=',par4,')',sep='')
mysub <- paste('(base=',par8,', d=',par3,', D=',par4,', CI=', par7, ', CI type=',par6,')',sep='')
}
plot(x,type='l', main=mytitle,xlab='time',ylab='value')
par(op)
dev.off()
bitmap(file='pic1.png')
racf <- acf(x, par1, main='Autocorrelation', xlab='time lag', ylab='ACF', ci.type=par6, ci=par7, sub=mysub)
dev.off()
bitmap(file='pic2.png')
rpacf <- pacf(x,par1,main='Partial Autocorrelation',xlab='lags',ylab='PACF',sub=mysub)
dev.off()
(myacf <- c(racf$acf))
(mypacf <- c(rpacf$acf))
lengthx <- length(x)
sqrtn <- sqrt(lengthx)
load(file='createtable')
a<-table.start()
a<-table.row.start(a)
a<-table.element(a,'Autocorrelation Function',4,TRUE)
a<-table.row.end(a)
a<-table.row.start(a)
a<-table.element(a,'Time lag k',header=TRUE)
a<-table.element(a,'ACF(k)',header=TRUE)
a<-table.element(a,'T-STAT',header=TRUE)
a<-table.element(a,'P-value',header=TRUE)
a<-table.row.end(a)
for (i in 2:(par1+1)) {
a<-table.row.start(a)
a<-table.element(a,i-1,header=TRUE)
a<-table.element(a,round(myacf[i],6))
mytstat <- myacf[i]*sqrtn
a<-table.element(a,round(mytstat,4))
a<-table.element(a,round(1-pt(abs(mytstat),lengthx),6))
a<-table.row.end(a)
}
a<-table.end(a)
table.save(a,file='mytable.tab')
a<-table.start()
a<-table.row.start(a)
a<-table.element(a,'Partial Autocorrelation Function',4,TRUE)
a<-table.row.end(a)
a<-table.row.start(a)
a<-table.element(a,'Time lag k',header=TRUE)
a<-table.element(a,'PACF(k)',header=TRUE)
a<-table.element(a,'T-STAT',header=TRUE)
a<-table.element(a,'P-value',header=TRUE)
a<-table.row.end(a)
for (i in 1:par1) {
a<-table.row.start(a)
a<-table.element(a,i,header=TRUE)
a<-table.element(a,round(mypacf[i],6))
mytstat <- mypacf[i]*sqrtn
a<-table.element(a,round(mytstat,4))
a<-table.element(a,round(1-pt(abs(mytstat),lengthx),6))
a<-table.row.end(a)
}
a<-table.end(a)
table.save(a,file='mytable1.tab')