Free Statistics

of Irreproducible Research!

Author's title

Author*The author of this computation has been verified*
R Software Modulerwasp_autocorrelation.wasp
Title produced by software(Partial) Autocorrelation Function
Date of computationSat, 17 Dec 2016 12:18:13 +0100
Cite this page as followsStatistical Computations at FreeStatistics.org, Office for Research Development and Education, URL https://freestatistics.org/blog/index.php?v=date/2016/Dec/17/t1481973535soooz6fqkdev0eo.htm/, Retrieved Fri, 01 Nov 2024 03:48:12 +0000
Statistical Computations at FreeStatistics.org, Office for Research Development and Education, URL https://freestatistics.org/blog/index.php?pk=300700, Retrieved Fri, 01 Nov 2024 03:48:12 +0000
QR Codes:

Original text written by user:
IsPrivate?No (this computation is public)
User-defined keywords
Estimated Impact61
Family? (F = Feedback message, R = changed R code, M = changed R Module, P = changed Parameters, D = changed Data)
-       [(Partial) Autocorrelation Function] [] [2016-12-17 11:18:13] [404ac5ee4f7301873f6a96ef36861981] [Current]
Feedback Forum

Post a new message
Dataseries X:
9290
6160
8320
8310
6750
8710
6300
5710
5740
6710
7310
7240
8650
8330
7810
8260
6680
5580
6340
4490
5000
7030
6100
9740
7940
7740
7820
7820
5380
7070
6970
4080
4930
4820
6220
6360
7630
5130
6960
5350
6290
4630
5130
3620
3980
3120
4310
4250
5730
3630
5680


Summary of computational transaction
Raw Input view raw input (R code)
Raw Outputview raw output of R engine
Computing time1 seconds
R ServerBig Analytics Cloud Computing Center

\begin{tabular}{lllllllll}
\hline
Summary of computational transaction \tabularnewline
Raw Input view raw input (R code)  \tabularnewline
Raw Outputview raw output of R engine  \tabularnewline
Computing time1 seconds \tabularnewline
R ServerBig Analytics Cloud Computing Center \tabularnewline
\hline
\end{tabular}
%Source: https://freestatistics.org/blog/index.php?pk=300700&T=0

[TABLE]
[ROW]
Summary of computational transaction[/C][/ROW] [ROW]Raw Input[/C] view raw input (R code) [/C][/ROW] [ROW]Raw Output[/C]view raw output of R engine [/C][/ROW] [ROW]Computing time[/C]1 seconds[/C][/ROW] [ROW]R Server[/C]Big Analytics Cloud Computing Center[/C][/ROW] [/TABLE] Source: https://freestatistics.org/blog/index.php?pk=300700&T=0

Globally Unique Identifier (entire table): ba.freestatistics.org/blog/index.php?pk=300700&T=0

As an alternative you can also use a QR Code:  

The GUIDs for individual cells are displayed in the table below:

Summary of computational transaction
Raw Input view raw input (R code)
Raw Outputview raw output of R engine
Computing time1 seconds
R ServerBig Analytics Cloud Computing Center


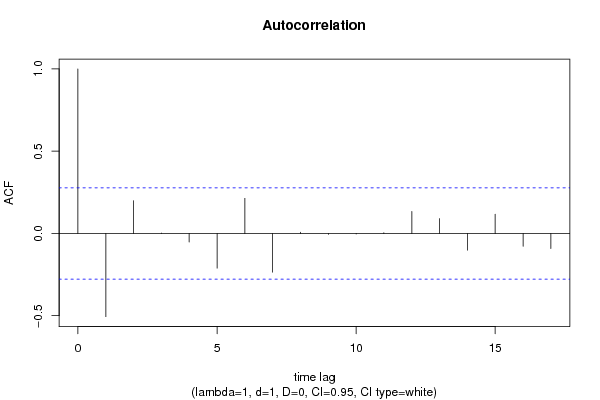
Autocorrelation Function
Time lag kACF(k)T-STATP-value
1-0.50577-3.57630.000392
20.1987991.40570.082996
30.0009050.00640.497459
4-0.051553-0.36450.358499
5-0.210967-1.49180.071022
60.2133181.50840.068875
7-0.235361-1.66430.051159
80.0078490.05550.477981
9-0.005442-0.03850.48473
10-0.003881-0.02740.489107
110.004750.03360.486669
120.1338120.94620.1743
130.0900710.63690.263548
14-0.101572-0.71820.237983
150.1171070.82810.205782
16-0.078016-0.55170.291821
17-0.091518-0.64710.260254

\begin{tabular}{lllllllll}
\hline
Autocorrelation Function \tabularnewline
Time lag k & ACF(k) & T-STAT & P-value \tabularnewline
1 & -0.50577 & -3.5763 & 0.000392 \tabularnewline
2 & 0.198799 & 1.4057 & 0.082996 \tabularnewline
3 & 0.000905 & 0.0064 & 0.497459 \tabularnewline
4 & -0.051553 & -0.3645 & 0.358499 \tabularnewline
5 & -0.210967 & -1.4918 & 0.071022 \tabularnewline
6 & 0.213318 & 1.5084 & 0.068875 \tabularnewline
7 & -0.235361 & -1.6643 & 0.051159 \tabularnewline
8 & 0.007849 & 0.0555 & 0.477981 \tabularnewline
9 & -0.005442 & -0.0385 & 0.48473 \tabularnewline
10 & -0.003881 & -0.0274 & 0.489107 \tabularnewline
11 & 0.00475 & 0.0336 & 0.486669 \tabularnewline
12 & 0.133812 & 0.9462 & 0.1743 \tabularnewline
13 & 0.090071 & 0.6369 & 0.263548 \tabularnewline
14 & -0.101572 & -0.7182 & 0.237983 \tabularnewline
15 & 0.117107 & 0.8281 & 0.205782 \tabularnewline
16 & -0.078016 & -0.5517 & 0.291821 \tabularnewline
17 & -0.091518 & -0.6471 & 0.260254 \tabularnewline
\hline
\end{tabular}
%Source: https://freestatistics.org/blog/index.php?pk=300700&T=1

[TABLE]
[ROW][C]Autocorrelation Function[/C][/ROW]
[ROW][C]Time lag k[/C][C]ACF(k)[/C][C]T-STAT[/C][C]P-value[/C][/ROW]
[ROW][C]1[/C][C]-0.50577[/C][C]-3.5763[/C][C]0.000392[/C][/ROW]
[ROW][C]2[/C][C]0.198799[/C][C]1.4057[/C][C]0.082996[/C][/ROW]
[ROW][C]3[/C][C]0.000905[/C][C]0.0064[/C][C]0.497459[/C][/ROW]
[ROW][C]4[/C][C]-0.051553[/C][C]-0.3645[/C][C]0.358499[/C][/ROW]
[ROW][C]5[/C][C]-0.210967[/C][C]-1.4918[/C][C]0.071022[/C][/ROW]
[ROW][C]6[/C][C]0.213318[/C][C]1.5084[/C][C]0.068875[/C][/ROW]
[ROW][C]7[/C][C]-0.235361[/C][C]-1.6643[/C][C]0.051159[/C][/ROW]
[ROW][C]8[/C][C]0.007849[/C][C]0.0555[/C][C]0.477981[/C][/ROW]
[ROW][C]9[/C][C]-0.005442[/C][C]-0.0385[/C][C]0.48473[/C][/ROW]
[ROW][C]10[/C][C]-0.003881[/C][C]-0.0274[/C][C]0.489107[/C][/ROW]
[ROW][C]11[/C][C]0.00475[/C][C]0.0336[/C][C]0.486669[/C][/ROW]
[ROW][C]12[/C][C]0.133812[/C][C]0.9462[/C][C]0.1743[/C][/ROW]
[ROW][C]13[/C][C]0.090071[/C][C]0.6369[/C][C]0.263548[/C][/ROW]
[ROW][C]14[/C][C]-0.101572[/C][C]-0.7182[/C][C]0.237983[/C][/ROW]
[ROW][C]15[/C][C]0.117107[/C][C]0.8281[/C][C]0.205782[/C][/ROW]
[ROW][C]16[/C][C]-0.078016[/C][C]-0.5517[/C][C]0.291821[/C][/ROW]
[ROW][C]17[/C][C]-0.091518[/C][C]-0.6471[/C][C]0.260254[/C][/ROW]
[/TABLE]
Source: https://freestatistics.org/blog/index.php?pk=300700&T=1

Globally Unique Identifier (entire table): ba.freestatistics.org/blog/index.php?pk=300700&T=1

As an alternative you can also use a QR Code:  

The GUIDs for individual cells are displayed in the table below:

Autocorrelation Function
Time lag kACF(k)T-STATP-value
1-0.50577-3.57630.000392
20.1987991.40570.082996
30.0009050.00640.497459
4-0.051553-0.36450.358499
5-0.210967-1.49180.071022
60.2133181.50840.068875
7-0.235361-1.66430.051159
80.0078490.05550.477981
9-0.005442-0.03850.48473
10-0.003881-0.02740.489107
110.004750.03360.486669
120.1338120.94620.1743
130.0900710.63690.263548
14-0.101572-0.71820.237983
150.1171070.82810.205782
16-0.078016-0.55170.291821
17-0.091518-0.64710.260254


Partial Autocorrelation Function
Time lag kPACF(k)T-STATP-value
1-0.50577-3.57630.000392
2-0.076599-0.54160.295238
30.0951730.6730.252031
40.0027210.01920.492364
5-0.349857-2.47390.008403
6-0.061531-0.43510.332685
7-0.104262-0.73720.232209
8-0.217618-1.53880.06508
9-0.237783-1.68140.049463
10-0.167783-1.18640.120535
11-0.067157-0.47490.318472
12-0.003397-0.0240.490467
130.1915211.35430.090871
14-0.016848-0.11910.452825
15-0.034565-0.24440.403958
16-0.017934-0.12680.4498
17-0.097598-0.69010.246654

\begin{tabular}{lllllllll}
\hline
Partial Autocorrelation Function \tabularnewline
Time lag k & PACF(k) & T-STAT & P-value \tabularnewline
1 & -0.50577 & -3.5763 & 0.000392 \tabularnewline
2 & -0.076599 & -0.5416 & 0.295238 \tabularnewline
3 & 0.095173 & 0.673 & 0.252031 \tabularnewline
4 & 0.002721 & 0.0192 & 0.492364 \tabularnewline
5 & -0.349857 & -2.4739 & 0.008403 \tabularnewline
6 & -0.061531 & -0.4351 & 0.332685 \tabularnewline
7 & -0.104262 & -0.7372 & 0.232209 \tabularnewline
8 & -0.217618 & -1.5388 & 0.06508 \tabularnewline
9 & -0.237783 & -1.6814 & 0.049463 \tabularnewline
10 & -0.167783 & -1.1864 & 0.120535 \tabularnewline
11 & -0.067157 & -0.4749 & 0.318472 \tabularnewline
12 & -0.003397 & -0.024 & 0.490467 \tabularnewline
13 & 0.191521 & 1.3543 & 0.090871 \tabularnewline
14 & -0.016848 & -0.1191 & 0.452825 \tabularnewline
15 & -0.034565 & -0.2444 & 0.403958 \tabularnewline
16 & -0.017934 & -0.1268 & 0.4498 \tabularnewline
17 & -0.097598 & -0.6901 & 0.246654 \tabularnewline
\hline
\end{tabular}
%Source: https://freestatistics.org/blog/index.php?pk=300700&T=2

[TABLE]
[ROW][C]Partial Autocorrelation Function[/C][/ROW]
[ROW][C]Time lag k[/C][C]PACF(k)[/C][C]T-STAT[/C][C]P-value[/C][/ROW]
[ROW][C]1[/C][C]-0.50577[/C][C]-3.5763[/C][C]0.000392[/C][/ROW]
[ROW][C]2[/C][C]-0.076599[/C][C]-0.5416[/C][C]0.295238[/C][/ROW]
[ROW][C]3[/C][C]0.095173[/C][C]0.673[/C][C]0.252031[/C][/ROW]
[ROW][C]4[/C][C]0.002721[/C][C]0.0192[/C][C]0.492364[/C][/ROW]
[ROW][C]5[/C][C]-0.349857[/C][C]-2.4739[/C][C]0.008403[/C][/ROW]
[ROW][C]6[/C][C]-0.061531[/C][C]-0.4351[/C][C]0.332685[/C][/ROW]
[ROW][C]7[/C][C]-0.104262[/C][C]-0.7372[/C][C]0.232209[/C][/ROW]
[ROW][C]8[/C][C]-0.217618[/C][C]-1.5388[/C][C]0.06508[/C][/ROW]
[ROW][C]9[/C][C]-0.237783[/C][C]-1.6814[/C][C]0.049463[/C][/ROW]
[ROW][C]10[/C][C]-0.167783[/C][C]-1.1864[/C][C]0.120535[/C][/ROW]
[ROW][C]11[/C][C]-0.067157[/C][C]-0.4749[/C][C]0.318472[/C][/ROW]
[ROW][C]12[/C][C]-0.003397[/C][C]-0.024[/C][C]0.490467[/C][/ROW]
[ROW][C]13[/C][C]0.191521[/C][C]1.3543[/C][C]0.090871[/C][/ROW]
[ROW][C]14[/C][C]-0.016848[/C][C]-0.1191[/C][C]0.452825[/C][/ROW]
[ROW][C]15[/C][C]-0.034565[/C][C]-0.2444[/C][C]0.403958[/C][/ROW]
[ROW][C]16[/C][C]-0.017934[/C][C]-0.1268[/C][C]0.4498[/C][/ROW]
[ROW][C]17[/C][C]-0.097598[/C][C]-0.6901[/C][C]0.246654[/C][/ROW]
[/TABLE]
Source: https://freestatistics.org/blog/index.php?pk=300700&T=2

Globally Unique Identifier (entire table): ba.freestatistics.org/blog/index.php?pk=300700&T=2

As an alternative you can also use a QR Code:  

The GUIDs for individual cells are displayed in the table below:

Partial Autocorrelation Function
Time lag kPACF(k)T-STATP-value
1-0.50577-3.57630.000392
2-0.076599-0.54160.295238
30.0951730.6730.252031
40.0027210.01920.492364
5-0.349857-2.47390.008403
6-0.061531-0.43510.332685
7-0.104262-0.73720.232209
8-0.217618-1.53880.06508
9-0.237783-1.68140.049463
10-0.167783-1.18640.120535
11-0.067157-0.47490.318472
12-0.003397-0.0240.490467
130.1915211.35430.090871
14-0.016848-0.11910.452825
15-0.034565-0.24440.403958
16-0.017934-0.12680.4498
17-0.097598-0.69010.246654


Parameters (Session):
par1 = 12 ; par2 = Double ; par3 = additive ; par4 = 12 ;
Parameters (R input):
par1 = Default ; par2 = 1 ; par3 = 1 ; par4 = 0 ; par5 = 12 ; par6 = White Noise ; par7 = 0.95 ; par8 = ;
R code (references can be found in the software module):
par8 <- ''
par7 <- '0.95'
par6 <- 'White Noise'
par5 <- '12'
par4 <- '0'
par3 <- '0'
par2 <- '1'
par1 <- 'Default'
if (par1 == 'Default') {
par1 = 10*log10(length(x))
} else {
par1 <- as.numeric(par1)
}
par2 <- as.numeric(par2)
par3 <- as.numeric(par3)
par4 <- as.numeric(par4)
par5 <- as.numeric(par5)
if (par6 == 'White Noise') par6 <- 'white' else par6 <- 'ma'
par7 <- as.numeric(par7)
if (par8 != '') par8 <- as.numeric(par8)
x <- na.omit(x)
ox <- x
if (par8 == '') {
if (par2 == 0) {
x <- log(x)
} else {
x <- (x ^ par2 - 1) / par2
}
} else {
x <- log(x,base=par8)
}
if (par3 > 0) x <- diff(x,lag=1,difference=par3)
if (par4 > 0) x <- diff(x,lag=par5,difference=par4)
bitmap(file='picts.png')
op <- par(mfrow=c(2,1))
plot(ox,type='l',main='Original Time Series',xlab='time',ylab='value')
if (par8=='') {
mytitle <- paste('Working Time Series (lambda=',par2,', d=',par3,', D=',par4,')',sep='')
mysub <- paste('(lambda=',par2,', d=',par3,', D=',par4,', CI=', par7, ', CI type=',par6,')',sep='')
} else {
mytitle <- paste('Working Time Series (base=',par8,', d=',par3,', D=',par4,')',sep='')
mysub <- paste('(base=',par8,', d=',par3,', D=',par4,', CI=', par7, ', CI type=',par6,')',sep='')
}
plot(x,type='l', main=mytitle,xlab='time',ylab='value')
par(op)
dev.off()
bitmap(file='pic1.png')
racf <- acf(x, par1, main='Autocorrelation', xlab='time lag', ylab='ACF', ci.type=par6, ci=par7, sub=mysub)
dev.off()
bitmap(file='pic2.png')
rpacf <- pacf(x,par1,main='Partial Autocorrelation',xlab='lags',ylab='PACF',sub=mysub)
dev.off()
(myacf <- c(racf$acf))
(mypacf <- c(rpacf$acf))
lengthx <- length(x)
sqrtn <- sqrt(lengthx)
load(file='createtable')
a<-table.start()
a<-table.row.start(a)
a<-table.element(a,'Autocorrelation Function',4,TRUE)
a<-table.row.end(a)
a<-table.row.start(a)
a<-table.element(a,'Time lag k',header=TRUE)
a<-table.element(a,'ACF(k)',header=TRUE)
a<-table.element(a,'T-STAT',header=TRUE)
a<-table.element(a,'P-value',header=TRUE)
a<-table.row.end(a)
for (i in 2:(par1+1)) {
a<-table.row.start(a)
a<-table.element(a,i-1,header=TRUE)
a<-table.element(a,round(myacf[i],6))
mytstat <- myacf[i]*sqrtn
a<-table.element(a,round(mytstat,4))
a<-table.element(a,round(1-pt(abs(mytstat),lengthx),6))
a<-table.row.end(a)
}
a<-table.end(a)
table.save(a,file='mytable.tab')
a<-table.start()
a<-table.row.start(a)
a<-table.element(a,'Partial Autocorrelation Function',4,TRUE)
a<-table.row.end(a)
a<-table.row.start(a)
a<-table.element(a,'Time lag k',header=TRUE)
a<-table.element(a,'PACF(k)',header=TRUE)
a<-table.element(a,'T-STAT',header=TRUE)
a<-table.element(a,'P-value',header=TRUE)
a<-table.row.end(a)
for (i in 1:par1) {
a<-table.row.start(a)
a<-table.element(a,i,header=TRUE)
a<-table.element(a,round(mypacf[i],6))
mytstat <- mypacf[i]*sqrtn
a<-table.element(a,round(mytstat,4))
a<-table.element(a,round(1-pt(abs(mytstat),lengthx),6))
a<-table.row.end(a)
}
a<-table.end(a)
table.save(a,file='mytable1.tab')