Free Statistics

of Irreproducible Research!

Author's title

Author*The author of this computation has been verified*
R Software Modulerwasp_structuraltimeseries.wasp
Title produced by softwareStructural Time Series Models
Date of computationFri, 16 Dec 2016 14:11:54 +0100
Cite this page as followsStatistical Computations at FreeStatistics.org, Office for Research Development and Education, URL https://freestatistics.org/blog/index.php?v=date/2016/Dec/16/t1481894179qr27lqctydo7ghz.htm/, Retrieved Fri, 01 Nov 2024 04:29:29 +0100
Statistical Computations at FreeStatistics.org, Office for Research Development and Education, URL https://freestatistics.org/blog/index.php?pk=, Retrieved Fri, 01 Nov 2024 04:29:29 +0100
QR Codes:

Original text written by user:
IsPrivate?No (this computation is public)
User-defined keywords
Estimated Impact0
Dataseries X:
3860
4300
6500
4830
2690
3700
4830
3270
2650
4070
5020
3350
2720
3010
5680
1950
2510
2580
4350
2830
1630
2720
4490
2360


Summary of computational transaction
Raw Input view raw input (R code)
Raw Outputview raw output of R engine
Computing time3 seconds
R ServerBig Analytics Cloud Computing Center

\begin{tabular}{lllllllll}
\hline
Summary of computational transaction \tabularnewline
Raw Input view raw input (R code)  \tabularnewline
Raw Outputview raw output of R engine  \tabularnewline
Computing time3 seconds \tabularnewline
R ServerBig Analytics Cloud Computing Center \tabularnewline
\hline
\end{tabular}
%Source: https://freestatistics.org/blog/index.php?pk=&T=0

[TABLE]
[ROW]
Summary of computational transaction[/C][/ROW] [ROW]Raw Input[/C] view raw input (R code) [/C][/ROW] [ROW]Raw Output[/C]view raw output of R engine [/C][/ROW] [ROW]Computing time[/C]3 seconds[/C][/ROW] [ROW]R Server[/C]Big Analytics Cloud Computing Center[/C][/ROW] [/TABLE] Source: https://freestatistics.org/blog/index.php?pk=&T=0

Globally Unique Identifier (entire table): ba.freestatistics.org/blog/index.php?pk=&T=0

As an alternative you can also use a QR Code:  

The GUIDs for individual cells are displayed in the table below:

Summary of computational transaction
Raw Input view raw input (R code)
Raw Outputview raw output of R engine
Computing time3 seconds
R ServerBig Analytics Cloud Computing Center


Structural Time Series Model -- Interpolation
tObservedLevelSlopeSeasonalStand. Residuals
138603860000
243004186.26134448496110.36482578861392.53228805788490.216406456481515
365005336.72640363295420.1193915531780.4440034881382.01023550012378
448305262.93316596282255.288768393517-140.055984607942-1.28753676715384
526904564.88383118704-131.105114121118-1328.25382645874-2.46990523936728
637004053.42268183033-265.365581737123-155.421838888479-0.91984961053123
748303764.29925810651-273.6730049876811078.10348329613-0.0577696413453916
832703282.41469673839-347.76584288560593.999728090013-0.49709362010524
926503311.8243990624-213.85459777319-843.2391007763310.876528387133725
1040703626.06217905419-26.3499953674832182.0878206784941.24814483943952
1150203792.6892150421642.19972511964771131.837450851170.455730803969555
1233503690.73948968048-8.97739726133669-269.57927875293-0.339801706022194
1327203717.381774008883.63729354487583-1014.866897377090.0838083774833607
1430103353.68805483892-126.602168628312-163.157633281387-0.864492507015258
1556803753.5426736790560.03878550167951668.081985966971.23827793914546
1619503144.96738016598-176.990335336056-866.591250047966-1.57330017576552
1725103109.82231239088-126.715347579538-669.4383228199790.333701013141342
1825802948.46597390612-138.994064281874-351.463723264476-0.0814917308586294
1943502637.81245801141-199.8353808337091796.41527507197-0.40377351408238
2028303003.829131401430.724154735315039-451.5116496088131.33108809106598
2116302733.70689246338-95.2719259354384-970.816694010072-0.637082431937244
2227202803.50706191783-36.7651722560034-164.5032799035590.388289247471319
2344902837.28366603242-11.76326201245491618.105347188110.165927308105385
2423602787.33507840028-25.2972173969249-408.599257130742-0.0898200099561229

\begin{tabular}{lllllllll}
\hline
Structural Time Series Model -- Interpolation \tabularnewline
t & Observed & Level & Slope & Seasonal & Stand. Residuals \tabularnewline
1 & 3860 & 3860 & 0 & 0 & 0 \tabularnewline
2 & 4300 & 4186.26134448496 & 110.364825788613 & 92.5322880578849 & 0.216406456481515 \tabularnewline
3 & 6500 & 5336.72640363295 & 420.1193915531 & 780.444003488138 & 2.01023550012378 \tabularnewline
4 & 4830 & 5262.93316596282 & 255.288768393517 & -140.055984607942 & -1.28753676715384 \tabularnewline
5 & 2690 & 4564.88383118704 & -131.105114121118 & -1328.25382645874 & -2.46990523936728 \tabularnewline
6 & 3700 & 4053.42268183033 & -265.365581737123 & -155.421838888479 & -0.91984961053123 \tabularnewline
7 & 4830 & 3764.29925810651 & -273.673004987681 & 1078.10348329613 & -0.0577696413453916 \tabularnewline
8 & 3270 & 3282.41469673839 & -347.765842885605 & 93.999728090013 & -0.49709362010524 \tabularnewline
9 & 2650 & 3311.8243990624 & -213.85459777319 & -843.239100776331 & 0.876528387133725 \tabularnewline
10 & 4070 & 3626.06217905419 & -26.3499953674832 & 182.087820678494 & 1.24814483943952 \tabularnewline
11 & 5020 & 3792.68921504216 & 42.1997251196477 & 1131.83745085117 & 0.455730803969555 \tabularnewline
12 & 3350 & 3690.73948968048 & -8.97739726133669 & -269.57927875293 & -0.339801706022194 \tabularnewline
13 & 2720 & 3717.38177400888 & 3.63729354487583 & -1014.86689737709 & 0.0838083774833607 \tabularnewline
14 & 3010 & 3353.68805483892 & -126.602168628312 & -163.157633281387 & -0.864492507015258 \tabularnewline
15 & 5680 & 3753.54267367905 & 60.0387855016795 & 1668.08198596697 & 1.23827793914546 \tabularnewline
16 & 1950 & 3144.96738016598 & -176.990335336056 & -866.591250047966 & -1.57330017576552 \tabularnewline
17 & 2510 & 3109.82231239088 & -126.715347579538 & -669.438322819979 & 0.333701013141342 \tabularnewline
18 & 2580 & 2948.46597390612 & -138.994064281874 & -351.463723264476 & -0.0814917308586294 \tabularnewline
19 & 4350 & 2637.81245801141 & -199.835380833709 & 1796.41527507197 & -0.40377351408238 \tabularnewline
20 & 2830 & 3003.82913140143 & 0.724154735315039 & -451.511649608813 & 1.33108809106598 \tabularnewline
21 & 1630 & 2733.70689246338 & -95.2719259354384 & -970.816694010072 & -0.637082431937244 \tabularnewline
22 & 2720 & 2803.50706191783 & -36.7651722560034 & -164.503279903559 & 0.388289247471319 \tabularnewline
23 & 4490 & 2837.28366603242 & -11.7632620124549 & 1618.10534718811 & 0.165927308105385 \tabularnewline
24 & 2360 & 2787.33507840028 & -25.2972173969249 & -408.599257130742 & -0.0898200099561229 \tabularnewline
\hline
\end{tabular}
%Source: https://freestatistics.org/blog/index.php?pk=&T=1

[TABLE]
[ROW][C]Structural Time Series Model -- Interpolation[/C][/ROW]
[ROW][C]t[/C][C]Observed[/C][C]Level[/C][C]Slope[/C][C]Seasonal[/C][C]Stand. Residuals[/C][/ROW]
[ROW][C]1[/C][C]3860[/C][C]3860[/C][C]0[/C][C]0[/C][C]0[/C][/ROW]
[ROW][C]2[/C][C]4300[/C][C]4186.26134448496[/C][C]110.364825788613[/C][C]92.5322880578849[/C][C]0.216406456481515[/C][/ROW]
[ROW][C]3[/C][C]6500[/C][C]5336.72640363295[/C][C]420.1193915531[/C][C]780.444003488138[/C][C]2.01023550012378[/C][/ROW]
[ROW][C]4[/C][C]4830[/C][C]5262.93316596282[/C][C]255.288768393517[/C][C]-140.055984607942[/C][C]-1.28753676715384[/C][/ROW]
[ROW][C]5[/C][C]2690[/C][C]4564.88383118704[/C][C]-131.105114121118[/C][C]-1328.25382645874[/C][C]-2.46990523936728[/C][/ROW]
[ROW][C]6[/C][C]3700[/C][C]4053.42268183033[/C][C]-265.365581737123[/C][C]-155.421838888479[/C][C]-0.91984961053123[/C][/ROW]
[ROW][C]7[/C][C]4830[/C][C]3764.29925810651[/C][C]-273.673004987681[/C][C]1078.10348329613[/C][C]-0.0577696413453916[/C][/ROW]
[ROW][C]8[/C][C]3270[/C][C]3282.41469673839[/C][C]-347.765842885605[/C][C]93.999728090013[/C][C]-0.49709362010524[/C][/ROW]
[ROW][C]9[/C][C]2650[/C][C]3311.8243990624[/C][C]-213.85459777319[/C][C]-843.239100776331[/C][C]0.876528387133725[/C][/ROW]
[ROW][C]10[/C][C]4070[/C][C]3626.06217905419[/C][C]-26.3499953674832[/C][C]182.087820678494[/C][C]1.24814483943952[/C][/ROW]
[ROW][C]11[/C][C]5020[/C][C]3792.68921504216[/C][C]42.1997251196477[/C][C]1131.83745085117[/C][C]0.455730803969555[/C][/ROW]
[ROW][C]12[/C][C]3350[/C][C]3690.73948968048[/C][C]-8.97739726133669[/C][C]-269.57927875293[/C][C]-0.339801706022194[/C][/ROW]
[ROW][C]13[/C][C]2720[/C][C]3717.38177400888[/C][C]3.63729354487583[/C][C]-1014.86689737709[/C][C]0.0838083774833607[/C][/ROW]
[ROW][C]14[/C][C]3010[/C][C]3353.68805483892[/C][C]-126.602168628312[/C][C]-163.157633281387[/C][C]-0.864492507015258[/C][/ROW]
[ROW][C]15[/C][C]5680[/C][C]3753.54267367905[/C][C]60.0387855016795[/C][C]1668.08198596697[/C][C]1.23827793914546[/C][/ROW]
[ROW][C]16[/C][C]1950[/C][C]3144.96738016598[/C][C]-176.990335336056[/C][C]-866.591250047966[/C][C]-1.57330017576552[/C][/ROW]
[ROW][C]17[/C][C]2510[/C][C]3109.82231239088[/C][C]-126.715347579538[/C][C]-669.438322819979[/C][C]0.333701013141342[/C][/ROW]
[ROW][C]18[/C][C]2580[/C][C]2948.46597390612[/C][C]-138.994064281874[/C][C]-351.463723264476[/C][C]-0.0814917308586294[/C][/ROW]
[ROW][C]19[/C][C]4350[/C][C]2637.81245801141[/C][C]-199.835380833709[/C][C]1796.41527507197[/C][C]-0.40377351408238[/C][/ROW]
[ROW][C]20[/C][C]2830[/C][C]3003.82913140143[/C][C]0.724154735315039[/C][C]-451.511649608813[/C][C]1.33108809106598[/C][/ROW]
[ROW][C]21[/C][C]1630[/C][C]2733.70689246338[/C][C]-95.2719259354384[/C][C]-970.816694010072[/C][C]-0.637082431937244[/C][/ROW]
[ROW][C]22[/C][C]2720[/C][C]2803.50706191783[/C][C]-36.7651722560034[/C][C]-164.503279903559[/C][C]0.388289247471319[/C][/ROW]
[ROW][C]23[/C][C]4490[/C][C]2837.28366603242[/C][C]-11.7632620124549[/C][C]1618.10534718811[/C][C]0.165927308105385[/C][/ROW]
[ROW][C]24[/C][C]2360[/C][C]2787.33507840028[/C][C]-25.2972173969249[/C][C]-408.599257130742[/C][C]-0.0898200099561229[/C][/ROW]
[/TABLE]
Source: https://freestatistics.org/blog/index.php?pk=&T=1

Globally Unique Identifier (entire table): ba.freestatistics.org/blog/index.php?pk=&T=1

As an alternative you can also use a QR Code:  

The GUIDs for individual cells are displayed in the table below:

Structural Time Series Model -- Interpolation
tObservedLevelSlopeSeasonalStand. Residuals
138603860000
243004186.26134448496110.36482578861392.53228805788490.216406456481515
365005336.72640363295420.1193915531780.4440034881382.01023550012378
448305262.93316596282255.288768393517-140.055984607942-1.28753676715384
526904564.88383118704-131.105114121118-1328.25382645874-2.46990523936728
637004053.42268183033-265.365581737123-155.421838888479-0.91984961053123
748303764.29925810651-273.6730049876811078.10348329613-0.0577696413453916
832703282.41469673839-347.76584288560593.999728090013-0.49709362010524
926503311.8243990624-213.85459777319-843.2391007763310.876528387133725
1040703626.06217905419-26.3499953674832182.0878206784941.24814483943952
1150203792.6892150421642.19972511964771131.837450851170.455730803969555
1233503690.73948968048-8.97739726133669-269.57927875293-0.339801706022194
1327203717.381774008883.63729354487583-1014.866897377090.0838083774833607
1430103353.68805483892-126.602168628312-163.157633281387-0.864492507015258
1556803753.5426736790560.03878550167951668.081985966971.23827793914546
1619503144.96738016598-176.990335336056-866.591250047966-1.57330017576552
1725103109.82231239088-126.715347579538-669.4383228199790.333701013141342
1825802948.46597390612-138.994064281874-351.463723264476-0.0814917308586294
1943502637.81245801141-199.8353808337091796.41527507197-0.40377351408238
2028303003.829131401430.724154735315039-451.5116496088131.33108809106598
2116302733.70689246338-95.2719259354384-970.816694010072-0.637082431937244
2227202803.50706191783-36.7651722560034-164.5032799035590.388289247471319
2344902837.28366603242-11.76326201245491618.105347188110.165927308105385
2423602787.33507840028-25.2972173969249-408.599257130742-0.0898200099561229


Structural Time Series Model -- Extrapolation
tObservedLevelSeasonal
11758.184544235932766.27638545309-1008.09184121715
22514.725797307322741.06960998235-226.343812675029
34361.006370144282715.862834511611645.14353563267
42279.948177300382690.65605904087-410.70788174049
51657.357442352992665.44928357014-1008.09184121715
62413.898695424372640.2425080994-226.343812675029
74260.179268261342615.035732628661645.14353563267
82179.121075417442589.82895715793-410.70788174049
91556.530340470042564.62218168719-1008.09184121715
102313.071593541422539.41540621645-226.343812675029
114159.352166378392514.208630745721645.14353563267
122078.293973534492489.00185527498-410.70788174049

\begin{tabular}{lllllllll}
\hline
Structural Time Series Model -- Extrapolation \tabularnewline
t & Observed & Level & Seasonal \tabularnewline
1 & 1758.18454423593 & 2766.27638545309 & -1008.09184121715 \tabularnewline
2 & 2514.72579730732 & 2741.06960998235 & -226.343812675029 \tabularnewline
3 & 4361.00637014428 & 2715.86283451161 & 1645.14353563267 \tabularnewline
4 & 2279.94817730038 & 2690.65605904087 & -410.70788174049 \tabularnewline
5 & 1657.35744235299 & 2665.44928357014 & -1008.09184121715 \tabularnewline
6 & 2413.89869542437 & 2640.2425080994 & -226.343812675029 \tabularnewline
7 & 4260.17926826134 & 2615.03573262866 & 1645.14353563267 \tabularnewline
8 & 2179.12107541744 & 2589.82895715793 & -410.70788174049 \tabularnewline
9 & 1556.53034047004 & 2564.62218168719 & -1008.09184121715 \tabularnewline
10 & 2313.07159354142 & 2539.41540621645 & -226.343812675029 \tabularnewline
11 & 4159.35216637839 & 2514.20863074572 & 1645.14353563267 \tabularnewline
12 & 2078.29397353449 & 2489.00185527498 & -410.70788174049 \tabularnewline
\hline
\end{tabular}
%Source: https://freestatistics.org/blog/index.php?pk=&T=2

[TABLE]
[ROW][C]Structural Time Series Model -- Extrapolation[/C][/ROW]
[ROW][C]t[/C][C]Observed[/C][C]Level[/C][C]Seasonal[/C][/ROW]
[ROW][C]1[/C][C]1758.18454423593[/C][C]2766.27638545309[/C][C]-1008.09184121715[/C][/ROW]
[ROW][C]2[/C][C]2514.72579730732[/C][C]2741.06960998235[/C][C]-226.343812675029[/C][/ROW]
[ROW][C]3[/C][C]4361.00637014428[/C][C]2715.86283451161[/C][C]1645.14353563267[/C][/ROW]
[ROW][C]4[/C][C]2279.94817730038[/C][C]2690.65605904087[/C][C]-410.70788174049[/C][/ROW]
[ROW][C]5[/C][C]1657.35744235299[/C][C]2665.44928357014[/C][C]-1008.09184121715[/C][/ROW]
[ROW][C]6[/C][C]2413.89869542437[/C][C]2640.2425080994[/C][C]-226.343812675029[/C][/ROW]
[ROW][C]7[/C][C]4260.17926826134[/C][C]2615.03573262866[/C][C]1645.14353563267[/C][/ROW]
[ROW][C]8[/C][C]2179.12107541744[/C][C]2589.82895715793[/C][C]-410.70788174049[/C][/ROW]
[ROW][C]9[/C][C]1556.53034047004[/C][C]2564.62218168719[/C][C]-1008.09184121715[/C][/ROW]
[ROW][C]10[/C][C]2313.07159354142[/C][C]2539.41540621645[/C][C]-226.343812675029[/C][/ROW]
[ROW][C]11[/C][C]4159.35216637839[/C][C]2514.20863074572[/C][C]1645.14353563267[/C][/ROW]
[ROW][C]12[/C][C]2078.29397353449[/C][C]2489.00185527498[/C][C]-410.70788174049[/C][/ROW]
[/TABLE]
Source: https://freestatistics.org/blog/index.php?pk=&T=2

Globally Unique Identifier (entire table): ba.freestatistics.org/blog/index.php?pk=&T=2

As an alternative you can also use a QR Code:  

The GUIDs for individual cells are displayed in the table below:

Structural Time Series Model -- Extrapolation
tObservedLevelSeasonal
11758.184544235932766.27638545309-1008.09184121715
22514.725797307322741.06960998235-226.343812675029
34361.006370144282715.862834511611645.14353563267
42279.948177300382690.65605904087-410.70788174049
51657.357442352992665.44928357014-1008.09184121715
62413.898695424372640.2425080994-226.343812675029
74260.179268261342615.035732628661645.14353563267
82179.121075417442589.82895715793-410.70788174049
91556.530340470042564.62218168719-1008.09184121715
102313.071593541422539.41540621645-226.343812675029
114159.352166378392514.208630745721645.14353563267
122078.293973534492489.00185527498-410.70788174049


Parameters (Session):
par1 = 111111additive44440FALSEFALSE111500DefaultDefaultDefaultDefaultDefault1DefaultDefault41additive444441212124 ; par2 = 1202104DoubleSingleDouble121110001210.0111111041212DoubleSingleDouble12121212 ; par3 = 112222additiveadditiveadditiveBFGS0001115000000001BFGSBFGSadditiveadditiveadditiveBFGSBFGSBFGSBFGS ; par4 = 444444121212111124124P1 P5 Q1 Q3 P95 P9900010000412121212 ; par5 = 44444444444 ; par6 = 333White NoiseWhite NoiseWhite NoiseWhite NoiseWhite NoiseWhite NoiseWhite NoiseWhite Noise ; par7 = 2110.950.950.950.950.95 ; par8 = 221 ; par9 = 111 ; par10 = FALSE ;
Parameters (R input):
par1 = 4 ; par2 = 12 ; par3 = BFGS ;
R code (references can be found in the software module):
par3 <- 'BFGS'
par2 <- '12'
par1 <- '12'
require('stsm')
require('stsm.class')
require('KFKSDS')
par1 <- as.numeric(par1)
par2 <- as.numeric(par2)
nx <- length(x)
x <- ts(x,frequency=par1)
m <- StructTS(x,type='BSM')
print(m$coef)
print(m$fitted)
print(m$resid)
mylevel <- as.numeric(m$fitted[,'level'])
myslope <- as.numeric(m$fitted[,'slope'])
myseas <- as.numeric(m$fitted[,'sea'])
myresid <- as.numeric(m$resid)
myfit <- mylevel+myseas
mm <- stsm.model(model = 'BSM', y = x, transPars = 'StructTS')
fit2 <- stsmFit(mm, stsm.method = 'maxlik.td.optim', method = par3, KF.args = list(P0cov = TRUE))
(fit2.comps <- tsSmooth(fit2, P0cov = FALSE)$states)
m2 <- set.pars(mm, pmax(fit2$par, .Machine$double.eps))
(ss <- char2numeric(m2))
(pred <- predict(ss, x, n.ahead = par2))
mylagmax <- nx/2
bitmap(file='test2.png')
op <- par(mfrow = c(2,2))
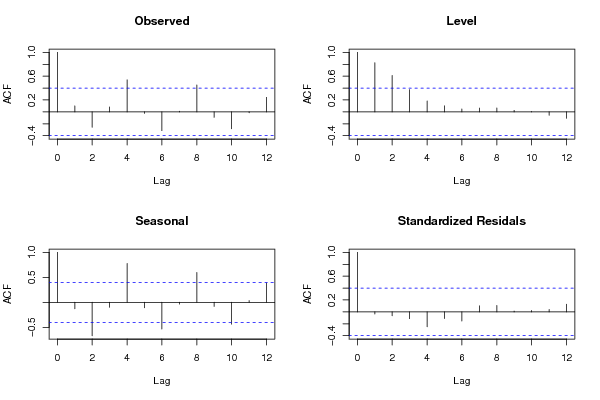
acf(as.numeric(x),lag.max = mylagmax,main='Observed')
acf(mylevel,na.action=na.pass,lag.max = mylagmax,main='Level')
acf(myseas,na.action=na.pass,lag.max = mylagmax,main='Seasonal')
acf(myresid,na.action=na.pass,lag.max = mylagmax,main='Standardized Residals')
par(op)
dev.off()
bitmap(file='test3.png')
op <- par(mfrow = c(2,2))
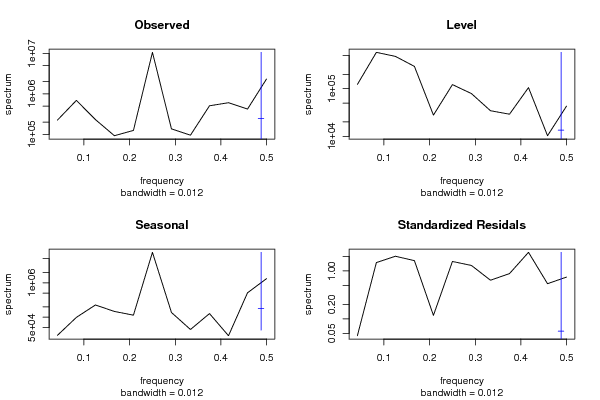
spectrum(as.numeric(x),main='Observed')
spectrum(mylevel,main='Level')
spectrum(myseas,main='Seasonal')
spectrum(myresid,main='Standardized Residals')
par(op)
dev.off()
bitmap(file='test4.png')
op <- par(mfrow = c(2,2))
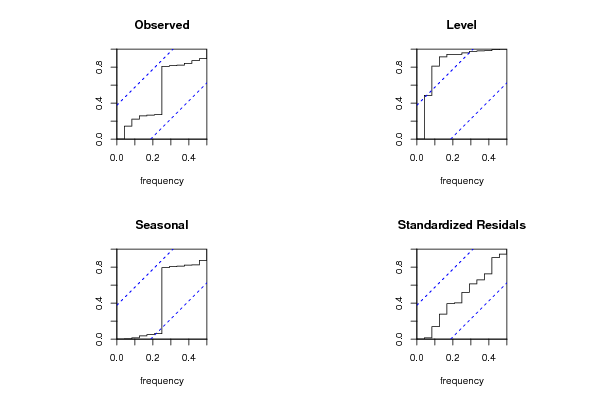
cpgram(as.numeric(x),main='Observed')
cpgram(mylevel,main='Level')
cpgram(myseas,main='Seasonal')
cpgram(myresid,main='Standardized Residals')
par(op)
dev.off()
bitmap(file='test1.png')
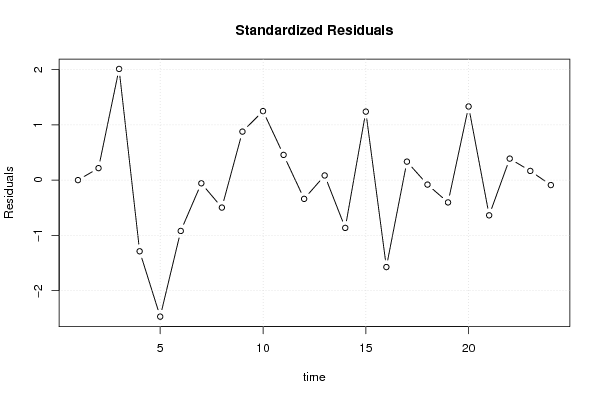
plot(as.numeric(m$resid),main='Standardized Residuals',ylab='Residuals',xlab='time',type='b')
grid()
dev.off()
bitmap(file='test5.png')
op <- par(mfrow = c(2,2))
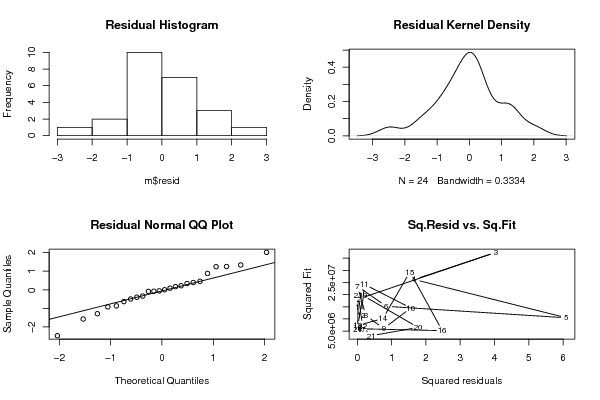
hist(m$resid,main='Residual Histogram')
plot(density(m$resid),main='Residual Kernel Density')
qqnorm(m$resid,main='Residual Normal QQ Plot')
qqline(m$resid)
plot(m$resid^2, myfit^2,main='Sq.Resid vs. Sq.Fit',xlab='Squared residuals',ylab='Squared Fit')
par(op)
dev.off()
bitmap(file='test6.png')
par(mfrow = c(3,1), mar = c(3,3,3,3))
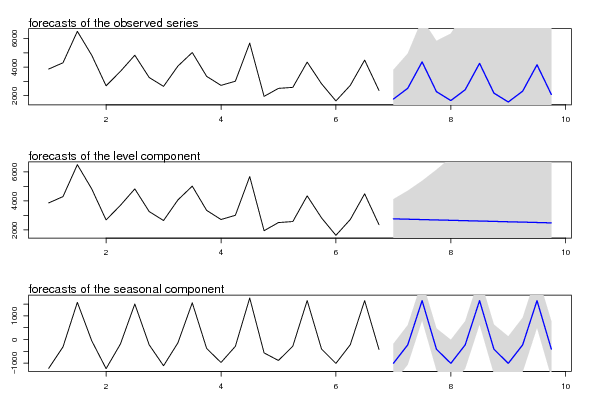
plot(cbind(x, pred$pred), type = 'n', plot.type = 'single', ylab = '')
lines(x)
polygon(c(time(pred$pred), rev(time(pred$pred))), c(pred$pred + 2 * pred$se, rev(pred$pred)), col = 'gray85', border = NA)
polygon(c(time(pred$pred), rev(time(pred$pred))), c(pred$pred - 2 * pred$se, rev(pred$pred)), col = ' gray85', border = NA)
lines(pred$pred, col = 'blue', lwd = 1.5)
mtext(text = 'forecasts of the observed series', side = 3, adj = 0)
plot(cbind(x, pred$a[,1]), type = 'n', plot.type = 'single', ylab = '')
lines(x)
polygon(c(time(pred$a[,1]), rev(time(pred$a[,1]))), c(pred$a[,1] + 2 * sqrt(pred$P[,1]), rev(pred$a[,1])), col = 'gray85', border = NA)
polygon(c(time(pred$a[,1]), rev(time(pred$a[,1]))), c(pred$a[,1] - 2 * sqrt(pred$P[,1]), rev(pred$a[,1])), col = ' gray85', border = NA)
lines(pred$a[,1], col = 'blue', lwd = 1.5)
mtext(text = 'forecasts of the level component', side = 3, adj = 0)
plot(cbind(fit2.comps[,3], pred$a[,3]), type = 'n', plot.type = 'single', ylab = '')
lines(fit2.comps[,3])
polygon(c(time(pred$a[,3]), rev(time(pred$a[,3]))), c(pred$a[,3] + 2 * sqrt(pred$P[,3]), rev(pred$a[,3])), col = 'gray85', border = NA)
polygon(c(time(pred$a[,3]), rev(time(pred$a[,3]))), c(pred$a[,3] - 2 * sqrt(pred$P[,3]), rev(pred$a[,3])), col = ' gray85', border = NA)
lines(pred$a[,3], col = 'blue', lwd = 1.5)
mtext(text = 'forecasts of the seasonal component', side = 3, adj = 0)
dev.off()
load(file='createtable')
a<-table.start()
a<-table.row.start(a)
a<-table.element(a,'Structural Time Series Model -- Interpolation',6,TRUE)
a<-table.row.end(a)
a<-table.row.start(a)
a<-table.element(a,'t',header=TRUE)
a<-table.element(a,'Observed',header=TRUE)
a<-table.element(a,'Level',header=TRUE)
a<-table.element(a,'Slope',header=TRUE)
a<-table.element(a,'Seasonal',header=TRUE)
a<-table.element(a,'Stand. Residuals',header=TRUE)
a<-table.row.end(a)
for (i in 1:nx) {
a<-table.row.start(a)
a<-table.element(a,i,header=TRUE)
a<-table.element(a,x[i])
a<-table.element(a,mylevel[i])
a<-table.element(a,myslope[i])
a<-table.element(a,myseas[i])
a<-table.element(a,myresid[i])
a<-table.row.end(a)
}
a<-table.end(a)
table.save(a,file='mytable.tab')
a<-table.start()
a<-table.row.start(a)
a<-table.element(a,'Structural Time Series Model -- Extrapolation',4,TRUE)
a<-table.row.end(a)
a<-table.row.start(a)
a<-table.element(a,'t',header=TRUE)
a<-table.element(a,'Observed',header=TRUE)
a<-table.element(a,'Level',header=TRUE)
a<-table.element(a,'Seasonal',header=TRUE)
a<-table.row.end(a)
for (i in 1:par2) {
a<-table.row.start(a)
a<-table.element(a,i,header=TRUE)
a<-table.element(a,pred$pred[i])
a<-table.element(a,pred$a[i,1])
a<-table.element(a,pred$a[i,3])
a<-table.row.end(a)
}
a<-table.end(a)
table.save(a,file='mytable1.tab')