Free Statistics

of Irreproducible Research!

Author's title

Author*The author of this computation has been verified*
R Software Modulerwasp_structuraltimeseries.wasp
Title produced by softwareStructural Time Series Models
Date of computationWed, 14 Dec 2016 18:16:06 +0100
Cite this page as followsStatistical Computations at FreeStatistics.org, Office for Research Development and Education, URL https://freestatistics.org/blog/index.php?v=date/2016/Dec/14/t1481735814vm84fhucf0cer68.htm/, Retrieved Fri, 01 Nov 2024 03:27:27 +0000
Statistical Computations at FreeStatistics.org, Office for Research Development and Education, URL https://freestatistics.org/blog/index.php?pk=299648, Retrieved Fri, 01 Nov 2024 03:27:27 +0000
QR Codes:

Original text written by user:
IsPrivate?No (this computation is public)
User-defined keywords
Estimated Impact94
Family? (F = Feedback message, R = changed R code, M = changed R Module, P = changed Parameters, D = changed Data)
-       [Structural Time Series Models] [] [2016-12-14 17:16:06] [130d73899007e5ff8a4f636b9bcfb397] [Current]
Feedback Forum

Post a new message
Dataseries X:
3913.98
3918.46
3920.72
3981.68
4047.83
4032.25
4054.52
4000.45
3991.03
4041.93
4048.3
4051.03
3988.96
3956.74
4020.78
4019.93
4085.91
4173.13
4209.46
4250.56
4273.58
4360.18
4446.81
4505.92
4496.46
4585.17
4656.57
4703
4782.58
4914.5
5123.02
5340.79
5526.35
5557.94
5708.63
5823.6
6049.46
6019.63
6243.26
6382.25
6501.27
6700.19
6799.1
6917.3


Summary of computational transaction
Raw Input view raw input (R code)
Raw Outputview raw output of R engine
Computing time4 seconds
R ServerBig Analytics Cloud Computing Center

\begin{tabular}{lllllllll}
\hline
Summary of computational transaction \tabularnewline
Raw Input view raw input (R code)  \tabularnewline
Raw Outputview raw output of R engine  \tabularnewline
Computing time4 seconds \tabularnewline
R ServerBig Analytics Cloud Computing Center \tabularnewline
\hline
\end{tabular}
%Source: https://freestatistics.org/blog/index.php?pk=299648&T=0

[TABLE]
[ROW]
Summary of computational transaction[/C][/ROW] [ROW]Raw Input[/C] view raw input (R code) [/C][/ROW] [ROW]Raw Output[/C]view raw output of R engine [/C][/ROW] [ROW]Computing time[/C]4 seconds[/C][/ROW] [ROW]R Server[/C]Big Analytics Cloud Computing Center[/C][/ROW] [/TABLE] Source: https://freestatistics.org/blog/index.php?pk=299648&T=0

Globally Unique Identifier (entire table): ba.freestatistics.org/blog/index.php?pk=299648&T=0

As an alternative you can also use a QR Code:  

The GUIDs for individual cells are displayed in the table below:

Summary of computational transaction
Raw Input view raw input (R code)
Raw Outputview raw output of R engine
Computing time4 seconds
R ServerBig Analytics Cloud Computing Center


Structural Time Series Model -- Interpolation
tObservedLevelSlopeSeasonalStand. Residuals
13913.983913.98000
23918.463917.940824790720.3827202900327610.2206873021459260.0555901181470357
33920.723920.192004491550.7120900241075480.2357436160244840.0383336491686922
43981.683973.7521511233412.73517188517250.2463405569519011.03666935642545
54047.834040.1885767526126.4521486609930.2043994366349811.02471334026486
64032.254036.1420693290318.21986812961740.225956774031268-0.573782394181513
74054.524054.3020016456318.20325197640840.2259881406118-0.00111964215604468
84000.454008.65779598580.2706034166918450.249702134980342-1.18858152949348
93991.033992.89359939732-4.261843504791350.253882794769459-0.298003045966208
104041.934035.504145190749.028788714848950.2453317463637940.870417166327216
114048.34047.645004721929.912576539514310.2449349176839730.0577693406398188
124051.034051.572842254998.211689203631520.245468092852906-0.111075648862879
133988.964017.27111308671-3.36918008396332-22.9583263697452-0.917986899077738
143956.743960.80075544302-17.72765422189130.806799926971052-0.816378134476342
154020.784010.901523120211.497086455225440.9493208379048471.25969049159273
164019.934018.221121397893.154648558640980.9433608190510730.107908112547704
174085.914077.6351694142419.16233831581630.879885075629491.04246165544176
184173.134163.5306596847438.14193438427980.8226999831454091.2370763256585
194209.464207.8307794030439.8931122078450.8189432533916410.114199304760789
204250.564249.5071203493540.4001907038210.8181799851597850.0330767005520609
214273.584274.7522746718136.0905848030850.822715750131784-0.281151620397928
224360.184353.7211519349648.28429803979590.813749859597150.795548046387047
234446.814440.8831395781359.34075431731480.8080714459380060.721372800903117
244505.924504.5435923243460.56927649687580.8076307649343760.0801555017354684
254496.464521.1860655531148.3184615828429-19.0683525554461-0.884002493048563
264585.174581.9298614390651.73667271795561.930313998878380.205356581483762
274656.574652.1773763532256.98982504494751.955555108506390.343685109333011
2847034701.9844074485954.94555774611641.96044046827943-0.133176590418944
294782.584777.8797880490460.90584419934891.944808651626920.388388729312578
304914.54904.0102568832579.45693529786481.907870485055891.20955284086307
315123.025105.14654579647114.0610435516861.858822834665052.25701171858232
325340.795325.03070897448144.1553280763111.828895784716211.96321019395412
335526.355518.09208448587158.0636166228251.819225213047120.907390458883552
345557.945570.07338170713127.8942838704651.83388013287052-1.96836063984515
355708.635705.76958636596130.1131716653061.833127289927520.144771579754761
365823.65823.40857413937126.5654039542831.83396801382666-0.231476838546259
376049.466043.24503204989152.753361425082-5.889542884362561.82954333483608
386019.636038.59903492058109.078747151998-1.32242877091304-2.68592812552897
396243.266233.23146449438133.371851485606-1.235769266990281.5882528853223
406382.256381.52936040618137.619206693291-1.243321201789490.276808489240943
416501.276504.44025702361133.434939106966-1.23515670827924-0.27274799949718
426700.196694.05537737365149.413729135067-1.258825964003111.0420208070555
436799.16805.36332581331138.576542098686-1.24739921315521-0.706905288111993
446917.36921.49725492589132.19400001625-1.24267771787216-0.416385266719377

\begin{tabular}{lllllllll}
\hline
Structural Time Series Model -- Interpolation \tabularnewline
t & Observed & Level & Slope & Seasonal & Stand. Residuals \tabularnewline
1 & 3913.98 & 3913.98 & 0 & 0 & 0 \tabularnewline
2 & 3918.46 & 3917.94082479072 & 0.382720290032761 & 0.220687302145926 & 0.0555901181470357 \tabularnewline
3 & 3920.72 & 3920.19200449155 & 0.712090024107548 & 0.235743616024484 & 0.0383336491686922 \tabularnewline
4 & 3981.68 & 3973.75215112334 & 12.7351718851725 & 0.246340556951901 & 1.03666935642545 \tabularnewline
5 & 4047.83 & 4040.18857675261 & 26.452148660993 & 0.204399436634981 & 1.02471334026486 \tabularnewline
6 & 4032.25 & 4036.14206932903 & 18.2198681296174 & 0.225956774031268 & -0.573782394181513 \tabularnewline
7 & 4054.52 & 4054.30200164563 & 18.2032519764084 & 0.2259881406118 & -0.00111964215604468 \tabularnewline
8 & 4000.45 & 4008.6577959858 & 0.270603416691845 & 0.249702134980342 & -1.18858152949348 \tabularnewline
9 & 3991.03 & 3992.89359939732 & -4.26184350479135 & 0.253882794769459 & -0.298003045966208 \tabularnewline
10 & 4041.93 & 4035.50414519074 & 9.02878871484895 & 0.245331746363794 & 0.870417166327216 \tabularnewline
11 & 4048.3 & 4047.64500472192 & 9.91257653951431 & 0.244934917683973 & 0.0577693406398188 \tabularnewline
12 & 4051.03 & 4051.57284225499 & 8.21168920363152 & 0.245468092852906 & -0.111075648862879 \tabularnewline
13 & 3988.96 & 4017.27111308671 & -3.36918008396332 & -22.9583263697452 & -0.917986899077738 \tabularnewline
14 & 3956.74 & 3960.80075544302 & -17.7276542218913 & 0.806799926971052 & -0.816378134476342 \tabularnewline
15 & 4020.78 & 4010.90152312021 & 1.49708645522544 & 0.949320837904847 & 1.25969049159273 \tabularnewline
16 & 4019.93 & 4018.22112139789 & 3.15464855864098 & 0.943360819051073 & 0.107908112547704 \tabularnewline
17 & 4085.91 & 4077.63516941424 & 19.1623383158163 & 0.87988507562949 & 1.04246165544176 \tabularnewline
18 & 4173.13 & 4163.53065968474 & 38.1419343842798 & 0.822699983145409 & 1.2370763256585 \tabularnewline
19 & 4209.46 & 4207.83077940304 & 39.893112207845 & 0.818943253391641 & 0.114199304760789 \tabularnewline
20 & 4250.56 & 4249.50712034935 & 40.400190703821 & 0.818179985159785 & 0.0330767005520609 \tabularnewline
21 & 4273.58 & 4274.75227467181 & 36.090584803085 & 0.822715750131784 & -0.281151620397928 \tabularnewline
22 & 4360.18 & 4353.72115193496 & 48.2842980397959 & 0.81374985959715 & 0.795548046387047 \tabularnewline
23 & 4446.81 & 4440.88313957813 & 59.3407543173148 & 0.808071445938006 & 0.721372800903117 \tabularnewline
24 & 4505.92 & 4504.54359232434 & 60.5692764968758 & 0.807630764934376 & 0.0801555017354684 \tabularnewline
25 & 4496.46 & 4521.18606555311 & 48.3184615828429 & -19.0683525554461 & -0.884002493048563 \tabularnewline
26 & 4585.17 & 4581.92986143906 & 51.7366727179556 & 1.93031399887838 & 0.205356581483762 \tabularnewline
27 & 4656.57 & 4652.17737635322 & 56.9898250449475 & 1.95555510850639 & 0.343685109333011 \tabularnewline
28 & 4703 & 4701.98440744859 & 54.9455577461164 & 1.96044046827943 & -0.133176590418944 \tabularnewline
29 & 4782.58 & 4777.87978804904 & 60.9058441993489 & 1.94480865162692 & 0.388388729312578 \tabularnewline
30 & 4914.5 & 4904.01025688325 & 79.4569352978648 & 1.90787048505589 & 1.20955284086307 \tabularnewline
31 & 5123.02 & 5105.14654579647 & 114.061043551686 & 1.85882283466505 & 2.25701171858232 \tabularnewline
32 & 5340.79 & 5325.03070897448 & 144.155328076311 & 1.82889578471621 & 1.96321019395412 \tabularnewline
33 & 5526.35 & 5518.09208448587 & 158.063616622825 & 1.81922521304712 & 0.907390458883552 \tabularnewline
34 & 5557.94 & 5570.07338170713 & 127.894283870465 & 1.83388013287052 & -1.96836063984515 \tabularnewline
35 & 5708.63 & 5705.76958636596 & 130.113171665306 & 1.83312728992752 & 0.144771579754761 \tabularnewline
36 & 5823.6 & 5823.40857413937 & 126.565403954283 & 1.83396801382666 & -0.231476838546259 \tabularnewline
37 & 6049.46 & 6043.24503204989 & 152.753361425082 & -5.88954288436256 & 1.82954333483608 \tabularnewline
38 & 6019.63 & 6038.59903492058 & 109.078747151998 & -1.32242877091304 & -2.68592812552897 \tabularnewline
39 & 6243.26 & 6233.23146449438 & 133.371851485606 & -1.23576926699028 & 1.5882528853223 \tabularnewline
40 & 6382.25 & 6381.52936040618 & 137.619206693291 & -1.24332120178949 & 0.276808489240943 \tabularnewline
41 & 6501.27 & 6504.44025702361 & 133.434939106966 & -1.23515670827924 & -0.27274799949718 \tabularnewline
42 & 6700.19 & 6694.05537737365 & 149.413729135067 & -1.25882596400311 & 1.0420208070555 \tabularnewline
43 & 6799.1 & 6805.36332581331 & 138.576542098686 & -1.24739921315521 & -0.706905288111993 \tabularnewline
44 & 6917.3 & 6921.49725492589 & 132.19400001625 & -1.24267771787216 & -0.416385266719377 \tabularnewline
\hline
\end{tabular}
%Source: https://freestatistics.org/blog/index.php?pk=299648&T=1

[TABLE]
[ROW][C]Structural Time Series Model -- Interpolation[/C][/ROW]
[ROW][C]t[/C][C]Observed[/C][C]Level[/C][C]Slope[/C][C]Seasonal[/C][C]Stand. Residuals[/C][/ROW]
[ROW][C]1[/C][C]3913.98[/C][C]3913.98[/C][C]0[/C][C]0[/C][C]0[/C][/ROW]
[ROW][C]2[/C][C]3918.46[/C][C]3917.94082479072[/C][C]0.382720290032761[/C][C]0.220687302145926[/C][C]0.0555901181470357[/C][/ROW]
[ROW][C]3[/C][C]3920.72[/C][C]3920.19200449155[/C][C]0.712090024107548[/C][C]0.235743616024484[/C][C]0.0383336491686922[/C][/ROW]
[ROW][C]4[/C][C]3981.68[/C][C]3973.75215112334[/C][C]12.7351718851725[/C][C]0.246340556951901[/C][C]1.03666935642545[/C][/ROW]
[ROW][C]5[/C][C]4047.83[/C][C]4040.18857675261[/C][C]26.452148660993[/C][C]0.204399436634981[/C][C]1.02471334026486[/C][/ROW]
[ROW][C]6[/C][C]4032.25[/C][C]4036.14206932903[/C][C]18.2198681296174[/C][C]0.225956774031268[/C][C]-0.573782394181513[/C][/ROW]
[ROW][C]7[/C][C]4054.52[/C][C]4054.30200164563[/C][C]18.2032519764084[/C][C]0.2259881406118[/C][C]-0.00111964215604468[/C][/ROW]
[ROW][C]8[/C][C]4000.45[/C][C]4008.6577959858[/C][C]0.270603416691845[/C][C]0.249702134980342[/C][C]-1.18858152949348[/C][/ROW]
[ROW][C]9[/C][C]3991.03[/C][C]3992.89359939732[/C][C]-4.26184350479135[/C][C]0.253882794769459[/C][C]-0.298003045966208[/C][/ROW]
[ROW][C]10[/C][C]4041.93[/C][C]4035.50414519074[/C][C]9.02878871484895[/C][C]0.245331746363794[/C][C]0.870417166327216[/C][/ROW]
[ROW][C]11[/C][C]4048.3[/C][C]4047.64500472192[/C][C]9.91257653951431[/C][C]0.244934917683973[/C][C]0.0577693406398188[/C][/ROW]
[ROW][C]12[/C][C]4051.03[/C][C]4051.57284225499[/C][C]8.21168920363152[/C][C]0.245468092852906[/C][C]-0.111075648862879[/C][/ROW]
[ROW][C]13[/C][C]3988.96[/C][C]4017.27111308671[/C][C]-3.36918008396332[/C][C]-22.9583263697452[/C][C]-0.917986899077738[/C][/ROW]
[ROW][C]14[/C][C]3956.74[/C][C]3960.80075544302[/C][C]-17.7276542218913[/C][C]0.806799926971052[/C][C]-0.816378134476342[/C][/ROW]
[ROW][C]15[/C][C]4020.78[/C][C]4010.90152312021[/C][C]1.49708645522544[/C][C]0.949320837904847[/C][C]1.25969049159273[/C][/ROW]
[ROW][C]16[/C][C]4019.93[/C][C]4018.22112139789[/C][C]3.15464855864098[/C][C]0.943360819051073[/C][C]0.107908112547704[/C][/ROW]
[ROW][C]17[/C][C]4085.91[/C][C]4077.63516941424[/C][C]19.1623383158163[/C][C]0.87988507562949[/C][C]1.04246165544176[/C][/ROW]
[ROW][C]18[/C][C]4173.13[/C][C]4163.53065968474[/C][C]38.1419343842798[/C][C]0.822699983145409[/C][C]1.2370763256585[/C][/ROW]
[ROW][C]19[/C][C]4209.46[/C][C]4207.83077940304[/C][C]39.893112207845[/C][C]0.818943253391641[/C][C]0.114199304760789[/C][/ROW]
[ROW][C]20[/C][C]4250.56[/C][C]4249.50712034935[/C][C]40.400190703821[/C][C]0.818179985159785[/C][C]0.0330767005520609[/C][/ROW]
[ROW][C]21[/C][C]4273.58[/C][C]4274.75227467181[/C][C]36.090584803085[/C][C]0.822715750131784[/C][C]-0.281151620397928[/C][/ROW]
[ROW][C]22[/C][C]4360.18[/C][C]4353.72115193496[/C][C]48.2842980397959[/C][C]0.81374985959715[/C][C]0.795548046387047[/C][/ROW]
[ROW][C]23[/C][C]4446.81[/C][C]4440.88313957813[/C][C]59.3407543173148[/C][C]0.808071445938006[/C][C]0.721372800903117[/C][/ROW]
[ROW][C]24[/C][C]4505.92[/C][C]4504.54359232434[/C][C]60.5692764968758[/C][C]0.807630764934376[/C][C]0.0801555017354684[/C][/ROW]
[ROW][C]25[/C][C]4496.46[/C][C]4521.18606555311[/C][C]48.3184615828429[/C][C]-19.0683525554461[/C][C]-0.884002493048563[/C][/ROW]
[ROW][C]26[/C][C]4585.17[/C][C]4581.92986143906[/C][C]51.7366727179556[/C][C]1.93031399887838[/C][C]0.205356581483762[/C][/ROW]
[ROW][C]27[/C][C]4656.57[/C][C]4652.17737635322[/C][C]56.9898250449475[/C][C]1.95555510850639[/C][C]0.343685109333011[/C][/ROW]
[ROW][C]28[/C][C]4703[/C][C]4701.98440744859[/C][C]54.9455577461164[/C][C]1.96044046827943[/C][C]-0.133176590418944[/C][/ROW]
[ROW][C]29[/C][C]4782.58[/C][C]4777.87978804904[/C][C]60.9058441993489[/C][C]1.94480865162692[/C][C]0.388388729312578[/C][/ROW]
[ROW][C]30[/C][C]4914.5[/C][C]4904.01025688325[/C][C]79.4569352978648[/C][C]1.90787048505589[/C][C]1.20955284086307[/C][/ROW]
[ROW][C]31[/C][C]5123.02[/C][C]5105.14654579647[/C][C]114.061043551686[/C][C]1.85882283466505[/C][C]2.25701171858232[/C][/ROW]
[ROW][C]32[/C][C]5340.79[/C][C]5325.03070897448[/C][C]144.155328076311[/C][C]1.82889578471621[/C][C]1.96321019395412[/C][/ROW]
[ROW][C]33[/C][C]5526.35[/C][C]5518.09208448587[/C][C]158.063616622825[/C][C]1.81922521304712[/C][C]0.907390458883552[/C][/ROW]
[ROW][C]34[/C][C]5557.94[/C][C]5570.07338170713[/C][C]127.894283870465[/C][C]1.83388013287052[/C][C]-1.96836063984515[/C][/ROW]
[ROW][C]35[/C][C]5708.63[/C][C]5705.76958636596[/C][C]130.113171665306[/C][C]1.83312728992752[/C][C]0.144771579754761[/C][/ROW]
[ROW][C]36[/C][C]5823.6[/C][C]5823.40857413937[/C][C]126.565403954283[/C][C]1.83396801382666[/C][C]-0.231476838546259[/C][/ROW]
[ROW][C]37[/C][C]6049.46[/C][C]6043.24503204989[/C][C]152.753361425082[/C][C]-5.88954288436256[/C][C]1.82954333483608[/C][/ROW]
[ROW][C]38[/C][C]6019.63[/C][C]6038.59903492058[/C][C]109.078747151998[/C][C]-1.32242877091304[/C][C]-2.68592812552897[/C][/ROW]
[ROW][C]39[/C][C]6243.26[/C][C]6233.23146449438[/C][C]133.371851485606[/C][C]-1.23576926699028[/C][C]1.5882528853223[/C][/ROW]
[ROW][C]40[/C][C]6382.25[/C][C]6381.52936040618[/C][C]137.619206693291[/C][C]-1.24332120178949[/C][C]0.276808489240943[/C][/ROW]
[ROW][C]41[/C][C]6501.27[/C][C]6504.44025702361[/C][C]133.434939106966[/C][C]-1.23515670827924[/C][C]-0.27274799949718[/C][/ROW]
[ROW][C]42[/C][C]6700.19[/C][C]6694.05537737365[/C][C]149.413729135067[/C][C]-1.25882596400311[/C][C]1.0420208070555[/C][/ROW]
[ROW][C]43[/C][C]6799.1[/C][C]6805.36332581331[/C][C]138.576542098686[/C][C]-1.24739921315521[/C][C]-0.706905288111993[/C][/ROW]
[ROW][C]44[/C][C]6917.3[/C][C]6921.49725492589[/C][C]132.19400001625[/C][C]-1.24267771787216[/C][C]-0.416385266719377[/C][/ROW]
[/TABLE]
Source: https://freestatistics.org/blog/index.php?pk=299648&T=1

Globally Unique Identifier (entire table): ba.freestatistics.org/blog/index.php?pk=299648&T=1

As an alternative you can also use a QR Code:  

The GUIDs for individual cells are displayed in the table below:

Structural Time Series Model -- Interpolation
tObservedLevelSlopeSeasonalStand. Residuals
13913.983913.98000
23918.463917.940824790720.3827202900327610.2206873021459260.0555901181470357
33920.723920.192004491550.7120900241075480.2357436160244840.0383336491686922
43981.683973.7521511233412.73517188517250.2463405569519011.03666935642545
54047.834040.1885767526126.4521486609930.2043994366349811.02471334026486
64032.254036.1420693290318.21986812961740.225956774031268-0.573782394181513
74054.524054.3020016456318.20325197640840.2259881406118-0.00111964215604468
84000.454008.65779598580.2706034166918450.249702134980342-1.18858152949348
93991.033992.89359939732-4.261843504791350.253882794769459-0.298003045966208
104041.934035.504145190749.028788714848950.2453317463637940.870417166327216
114048.34047.645004721929.912576539514310.2449349176839730.0577693406398188
124051.034051.572842254998.211689203631520.245468092852906-0.111075648862879
133988.964017.27111308671-3.36918008396332-22.9583263697452-0.917986899077738
143956.743960.80075544302-17.72765422189130.806799926971052-0.816378134476342
154020.784010.901523120211.497086455225440.9493208379048471.25969049159273
164019.934018.221121397893.154648558640980.9433608190510730.107908112547704
174085.914077.6351694142419.16233831581630.879885075629491.04246165544176
184173.134163.5306596847438.14193438427980.8226999831454091.2370763256585
194209.464207.8307794030439.8931122078450.8189432533916410.114199304760789
204250.564249.5071203493540.4001907038210.8181799851597850.0330767005520609
214273.584274.7522746718136.0905848030850.822715750131784-0.281151620397928
224360.184353.7211519349648.28429803979590.813749859597150.795548046387047
234446.814440.8831395781359.34075431731480.8080714459380060.721372800903117
244505.924504.5435923243460.56927649687580.8076307649343760.0801555017354684
254496.464521.1860655531148.3184615828429-19.0683525554461-0.884002493048563
264585.174581.9298614390651.73667271795561.930313998878380.205356581483762
274656.574652.1773763532256.98982504494751.955555108506390.343685109333011
2847034701.9844074485954.94555774611641.96044046827943-0.133176590418944
294782.584777.8797880490460.90584419934891.944808651626920.388388729312578
304914.54904.0102568832579.45693529786481.907870485055891.20955284086307
315123.025105.14654579647114.0610435516861.858822834665052.25701171858232
325340.795325.03070897448144.1553280763111.828895784716211.96321019395412
335526.355518.09208448587158.0636166228251.819225213047120.907390458883552
345557.945570.07338170713127.8942838704651.83388013287052-1.96836063984515
355708.635705.76958636596130.1131716653061.833127289927520.144771579754761
365823.65823.40857413937126.5654039542831.83396801382666-0.231476838546259
376049.466043.24503204989152.753361425082-5.889542884362561.82954333483608
386019.636038.59903492058109.078747151998-1.32242877091304-2.68592812552897
396243.266233.23146449438133.371851485606-1.235769266990281.5882528853223
406382.256381.52936040618137.619206693291-1.243321201789490.276808489240943
416501.276504.44025702361133.434939106966-1.23515670827924-0.27274799949718
426700.196694.05537737365149.413729135067-1.258825964003111.0420208070555
436799.16805.36332581331138.576542098686-1.24739921315521-0.706905288111993
446917.36921.49725492589132.19400001625-1.24267771787216-0.416385266719377


Structural Time Series Model -- Extrapolation
tObservedLevelSeasonal
17038.946393649227007.8647229206731.0816707285557
27143.465202089587122.1428868545721.3223152350121
37270.529289182047236.4210507884834.1082383935635
47372.978664192317350.6992147223822.279449469923
57463.411975675947464.97737865629-1.56540298035367
67521.242092639837579.25554259019-58.0134499503646
77659.878616146777693.5337065241-33.6550903773292
87767.824062763667807.81187045801-39.9878076943428
97895.328425261087922.09003439191-26.7616091308285
108039.029211816028036.368198325822.66101349020409
118171.876439868758150.6463622597221.2300776090267
128292.225121400568264.9245261936327.3005952069336

\begin{tabular}{lllllllll}
\hline
Structural Time Series Model -- Extrapolation \tabularnewline
t & Observed & Level & Seasonal \tabularnewline
1 & 7038.94639364922 & 7007.86472292067 & 31.0816707285557 \tabularnewline
2 & 7143.46520208958 & 7122.14288685457 & 21.3223152350121 \tabularnewline
3 & 7270.52928918204 & 7236.42105078848 & 34.1082383935635 \tabularnewline
4 & 7372.97866419231 & 7350.69921472238 & 22.279449469923 \tabularnewline
5 & 7463.41197567594 & 7464.97737865629 & -1.56540298035367 \tabularnewline
6 & 7521.24209263983 & 7579.25554259019 & -58.0134499503646 \tabularnewline
7 & 7659.87861614677 & 7693.5337065241 & -33.6550903773292 \tabularnewline
8 & 7767.82406276366 & 7807.81187045801 & -39.9878076943428 \tabularnewline
9 & 7895.32842526108 & 7922.09003439191 & -26.7616091308285 \tabularnewline
10 & 8039.02921181602 & 8036.36819832582 & 2.66101349020409 \tabularnewline
11 & 8171.87643986875 & 8150.64636225972 & 21.2300776090267 \tabularnewline
12 & 8292.22512140056 & 8264.92452619363 & 27.3005952069336 \tabularnewline
\hline
\end{tabular}
%Source: https://freestatistics.org/blog/index.php?pk=299648&T=2

[TABLE]
[ROW][C]Structural Time Series Model -- Extrapolation[/C][/ROW]
[ROW][C]t[/C][C]Observed[/C][C]Level[/C][C]Seasonal[/C][/ROW]
[ROW][C]1[/C][C]7038.94639364922[/C][C]7007.86472292067[/C][C]31.0816707285557[/C][/ROW]
[ROW][C]2[/C][C]7143.46520208958[/C][C]7122.14288685457[/C][C]21.3223152350121[/C][/ROW]
[ROW][C]3[/C][C]7270.52928918204[/C][C]7236.42105078848[/C][C]34.1082383935635[/C][/ROW]
[ROW][C]4[/C][C]7372.97866419231[/C][C]7350.69921472238[/C][C]22.279449469923[/C][/ROW]
[ROW][C]5[/C][C]7463.41197567594[/C][C]7464.97737865629[/C][C]-1.56540298035367[/C][/ROW]
[ROW][C]6[/C][C]7521.24209263983[/C][C]7579.25554259019[/C][C]-58.0134499503646[/C][/ROW]
[ROW][C]7[/C][C]7659.87861614677[/C][C]7693.5337065241[/C][C]-33.6550903773292[/C][/ROW]
[ROW][C]8[/C][C]7767.82406276366[/C][C]7807.81187045801[/C][C]-39.9878076943428[/C][/ROW]
[ROW][C]9[/C][C]7895.32842526108[/C][C]7922.09003439191[/C][C]-26.7616091308285[/C][/ROW]
[ROW][C]10[/C][C]8039.02921181602[/C][C]8036.36819832582[/C][C]2.66101349020409[/C][/ROW]
[ROW][C]11[/C][C]8171.87643986875[/C][C]8150.64636225972[/C][C]21.2300776090267[/C][/ROW]
[ROW][C]12[/C][C]8292.22512140056[/C][C]8264.92452619363[/C][C]27.3005952069336[/C][/ROW]
[/TABLE]
Source: https://freestatistics.org/blog/index.php?pk=299648&T=2

Globally Unique Identifier (entire table): ba.freestatistics.org/blog/index.php?pk=299648&T=2

As an alternative you can also use a QR Code:  

The GUIDs for individual cells are displayed in the table below:

Structural Time Series Model -- Extrapolation
tObservedLevelSeasonal
17038.946393649227007.8647229206731.0816707285557
27143.465202089587122.1428868545721.3223152350121
37270.529289182047236.4210507884834.1082383935635
47372.978664192317350.6992147223822.279449469923
57463.411975675947464.97737865629-1.56540298035367
67521.242092639837579.25554259019-58.0134499503646
77659.878616146777693.5337065241-33.6550903773292
87767.824062763667807.81187045801-39.9878076943428
97895.328425261087922.09003439191-26.7616091308285
108039.029211816028036.368198325822.66101349020409
118171.876439868758150.6463622597221.2300776090267
128292.225121400568264.9245261936327.3005952069336


Parameters (Session):
par1 = 12 ; par2 = 12 ; par3 = BFGS ;
Parameters (R input):
par1 = 12 ; par2 = 12 ; par3 = BFGS ;
R code (references can be found in the software module):
require('stsm')
require('stsm.class')
require('KFKSDS')
par1 <- as.numeric(par1)
par2 <- as.numeric(par2)
nx <- length(x)
x <- ts(x,frequency=par1)
m <- StructTS(x,type='BSM')
print(m$coef)
print(m$fitted)
print(m$resid)
mylevel <- as.numeric(m$fitted[,'level'])
myslope <- as.numeric(m$fitted[,'slope'])
myseas <- as.numeric(m$fitted[,'sea'])
myresid <- as.numeric(m$resid)
myfit <- mylevel+myseas
mm <- stsm.model(model = 'BSM', y = x, transPars = 'StructTS')
fit2 <- stsmFit(mm, stsm.method = 'maxlik.td.optim', method = par3, KF.args = list(P0cov = TRUE))
(fit2.comps <- tsSmooth(fit2, P0cov = FALSE)$states)
m2 <- set.pars(mm, pmax(fit2$par, .Machine$double.eps))
(ss <- char2numeric(m2))
(pred <- predict(ss, x, n.ahead = par2))
mylagmax <- nx/2
bitmap(file='test2.png')
op <- par(mfrow = c(2,2))
acf(as.numeric(x),lag.max = mylagmax,main='Observed')
acf(mylevel,na.action=na.pass,lag.max = mylagmax,main='Level')
acf(myseas,na.action=na.pass,lag.max = mylagmax,main='Seasonal')
acf(myresid,na.action=na.pass,lag.max = mylagmax,main='Standardized Residals')
par(op)
dev.off()
bitmap(file='test3.png')
op <- par(mfrow = c(2,2))
spectrum(as.numeric(x),main='Observed')
spectrum(mylevel,main='Level')
spectrum(myseas,main='Seasonal')
spectrum(myresid,main='Standardized Residals')
par(op)
dev.off()
bitmap(file='test4.png')
op <- par(mfrow = c(2,2))
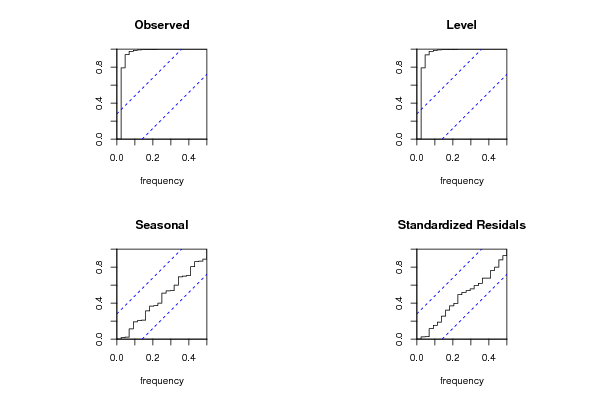
cpgram(as.numeric(x),main='Observed')
cpgram(mylevel,main='Level')
cpgram(myseas,main='Seasonal')
cpgram(myresid,main='Standardized Residals')
par(op)
dev.off()
bitmap(file='test1.png')
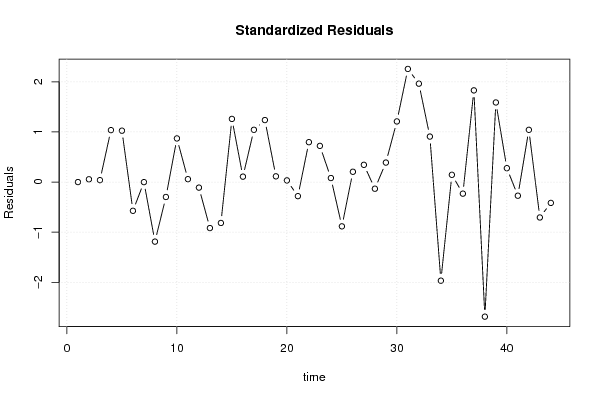
plot(as.numeric(m$resid),main='Standardized Residuals',ylab='Residuals',xlab='time',type='b')
grid()
dev.off()
bitmap(file='test5.png')
op <- par(mfrow = c(2,2))
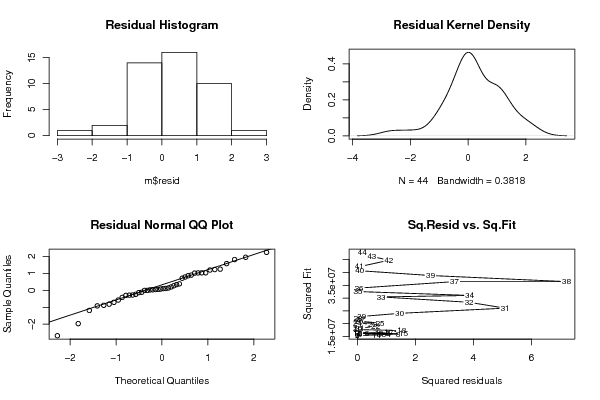
hist(m$resid,main='Residual Histogram')
plot(density(m$resid),main='Residual Kernel Density')
qqnorm(m$resid,main='Residual Normal QQ Plot')
qqline(m$resid)
plot(m$resid^2, myfit^2,main='Sq.Resid vs. Sq.Fit',xlab='Squared residuals',ylab='Squared Fit')
par(op)
dev.off()
bitmap(file='test6.png')
par(mfrow = c(3,1), mar = c(3,3,3,3))
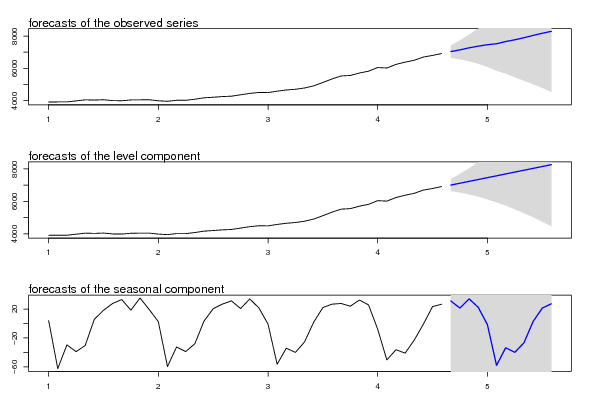
plot(cbind(x, pred$pred), type = 'n', plot.type = 'single', ylab = '')
lines(x)
polygon(c(time(pred$pred), rev(time(pred$pred))), c(pred$pred + 2 * pred$se, rev(pred$pred)), col = 'gray85', border = NA)
polygon(c(time(pred$pred), rev(time(pred$pred))), c(pred$pred - 2 * pred$se, rev(pred$pred)), col = ' gray85', border = NA)
lines(pred$pred, col = 'blue', lwd = 1.5)
mtext(text = 'forecasts of the observed series', side = 3, adj = 0)
plot(cbind(x, pred$a[,1]), type = 'n', plot.type = 'single', ylab = '')
lines(x)
polygon(c(time(pred$a[,1]), rev(time(pred$a[,1]))), c(pred$a[,1] + 2 * sqrt(pred$P[,1]), rev(pred$a[,1])), col = 'gray85', border = NA)
polygon(c(time(pred$a[,1]), rev(time(pred$a[,1]))), c(pred$a[,1] - 2 * sqrt(pred$P[,1]), rev(pred$a[,1])), col = ' gray85', border = NA)
lines(pred$a[,1], col = 'blue', lwd = 1.5)
mtext(text = 'forecasts of the level component', side = 3, adj = 0)
plot(cbind(fit2.comps[,3], pred$a[,3]), type = 'n', plot.type = 'single', ylab = '')
lines(fit2.comps[,3])
polygon(c(time(pred$a[,3]), rev(time(pred$a[,3]))), c(pred$a[,3] + 2 * sqrt(pred$P[,3]), rev(pred$a[,3])), col = 'gray85', border = NA)
polygon(c(time(pred$a[,3]), rev(time(pred$a[,3]))), c(pred$a[,3] - 2 * sqrt(pred$P[,3]), rev(pred$a[,3])), col = ' gray85', border = NA)
lines(pred$a[,3], col = 'blue', lwd = 1.5)
mtext(text = 'forecasts of the seasonal component', side = 3, adj = 0)
dev.off()
load(file='createtable')
a<-table.start()
a<-table.row.start(a)
a<-table.element(a,'Structural Time Series Model -- Interpolation',6,TRUE)
a<-table.row.end(a)
a<-table.row.start(a)
a<-table.element(a,'t',header=TRUE)
a<-table.element(a,'Observed',header=TRUE)
a<-table.element(a,'Level',header=TRUE)
a<-table.element(a,'Slope',header=TRUE)
a<-table.element(a,'Seasonal',header=TRUE)
a<-table.element(a,'Stand. Residuals',header=TRUE)
a<-table.row.end(a)
for (i in 1:nx) {
a<-table.row.start(a)
a<-table.element(a,i,header=TRUE)
a<-table.element(a,x[i])
a<-table.element(a,mylevel[i])
a<-table.element(a,myslope[i])
a<-table.element(a,myseas[i])
a<-table.element(a,myresid[i])
a<-table.row.end(a)
}
a<-table.end(a)
table.save(a,file='mytable.tab')
a<-table.start()
a<-table.row.start(a)
a<-table.element(a,'Structural Time Series Model -- Extrapolation',4,TRUE)
a<-table.row.end(a)
a<-table.row.start(a)
a<-table.element(a,'t',header=TRUE)
a<-table.element(a,'Observed',header=TRUE)
a<-table.element(a,'Level',header=TRUE)
a<-table.element(a,'Seasonal',header=TRUE)
a<-table.row.end(a)
for (i in 1:par2) {
a<-table.row.start(a)
a<-table.element(a,i,header=TRUE)
a<-table.element(a,pred$pred[i])
a<-table.element(a,pred$a[i,1])
a<-table.element(a,pred$a[i,3])
a<-table.row.end(a)
}
a<-table.end(a)
table.save(a,file='mytable1.tab')